Friday, 16.11.2018

- Topic 1: Norway - Upswing in the far north
- Topic 2: General Motors / Ford - Car manufacturers with strong figures
Norway
Upswing in the far north
The oil sector has been the main driving force behind the current upswing being enjoyed in Norway. At the same time, the Scandinavian country is benefitting from the flourishing business of the fishing industry. According to the current forecasts of the International Monetary Fund (IMF), Norway’s gross domestic product in 2018 could on the whole grow by more than 2% for the first time since 2012. The ETT (symbol: ETLNO) on the MSCI™ Daily TR Net Norway Index allows investors to take up a diversified position on the equity market of this small economy. With the PERLES (symbol: REUFIU) on the Norway Fish Equity Basket, investors can focus on the country’s second largest export sector.
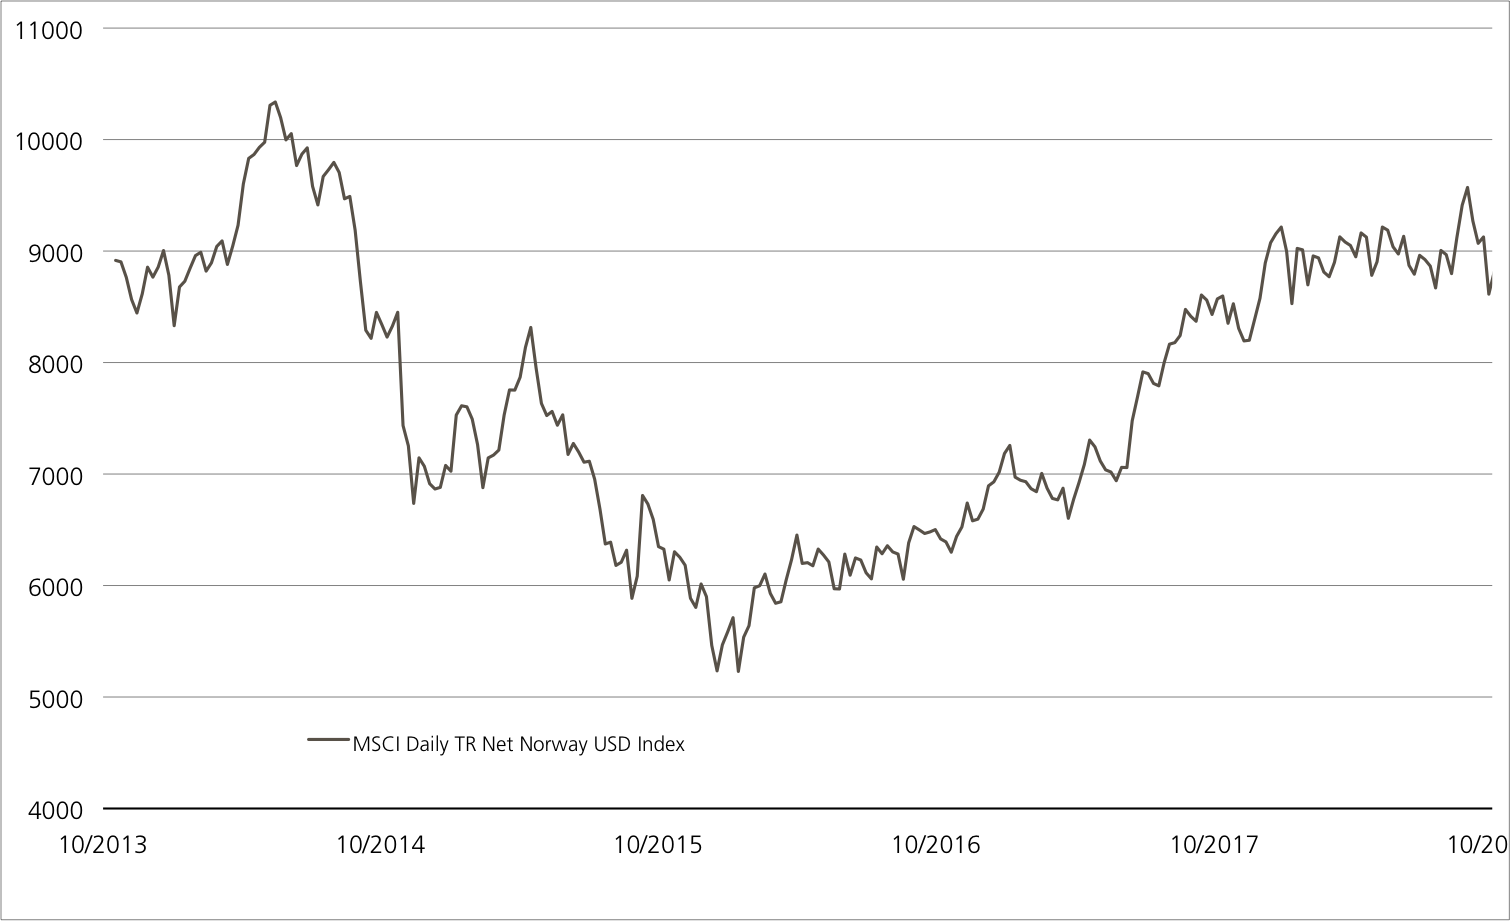
While Norway attracts millions of tourists every year with its breathtaking fjords, huge glaciers, picturesque villages and modern cities, the country in the far north is also proving attractive for investors. Over the past year, the MSCI™ Daily TR Net Norway Index has recorded positive growth of 2.2%. This sets the Oslo Stock Exchange apart from the European stock market, which is dominated by negative performances.¹ Norway’s outperformance was driven by the oil industry, which is home to Equinor, by far the largest company in the country. The energy multinational, which has operations in more than 30 countries, has just published its figures for the first nine months of 2018. Its quarterly report illustrates how the rise in oil prices during this period had a positive impact on earnings. Standing at USD 13.4 billion, operating earnings for the period from January to September were up 56% on the previous year. Equinor’s operating cash flow after nine months totaled USD 15.5 billion, which means that it has already surpassed the figure recorded in 2017 as a whole. (Source: Equinor Financial Report Q3 2018)
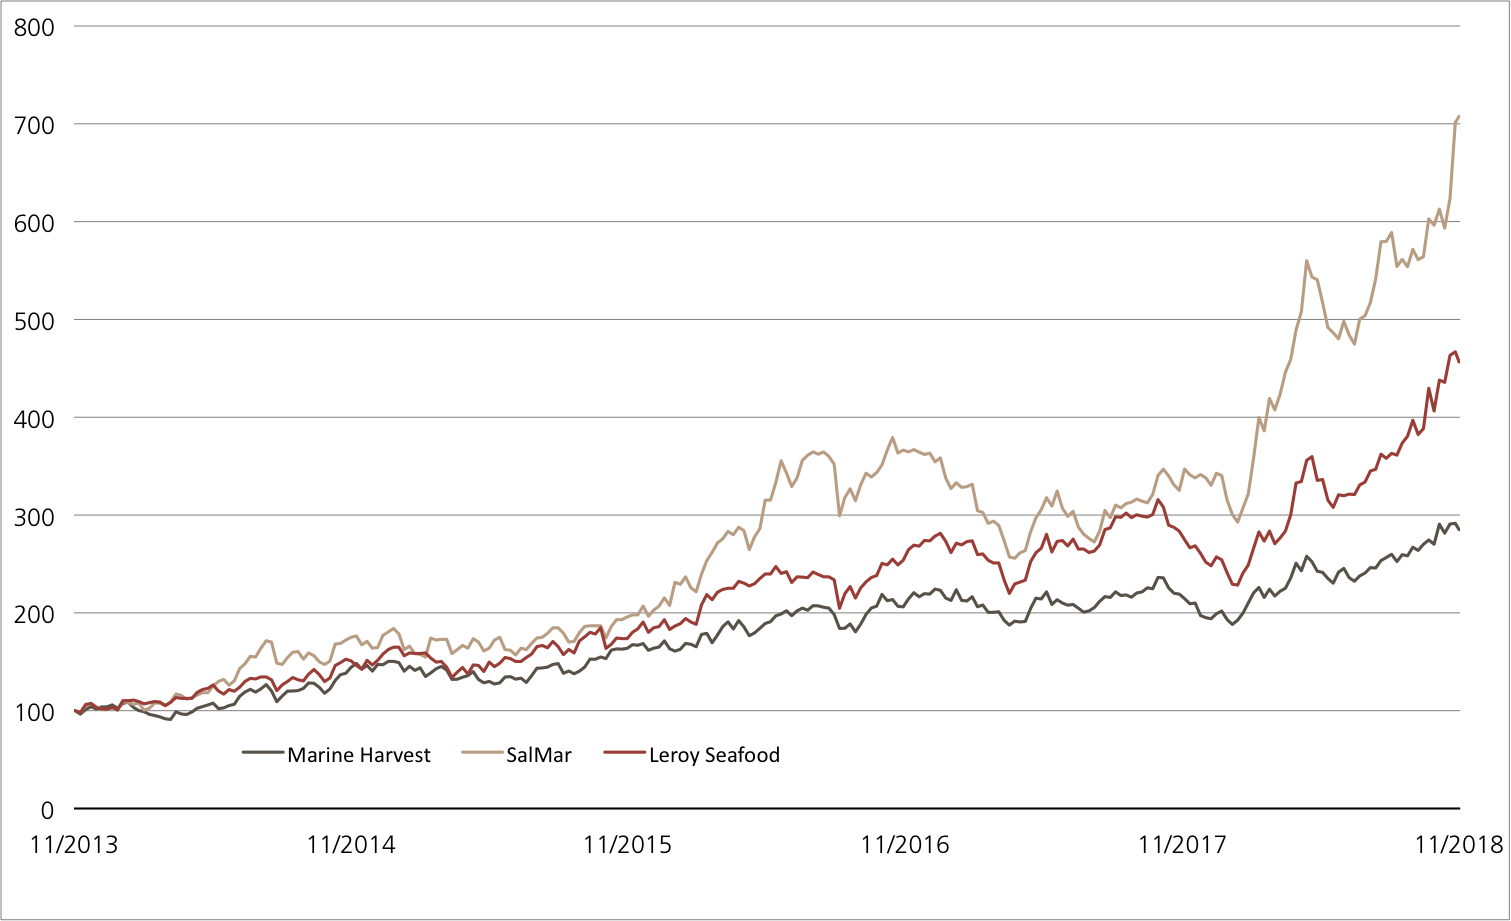
The Norwegian fishing industry has also been flourishing lately. The country’s second most important export sector is benefitting from changing dietary habits among the world’s population, with farm-raised salmon in particular appealing to the taste buds of an ever-increasing number of consumers. In August alone, Norway exported 100,000 tons of the typically pink fish – a new record for the summer month. In the first eight months of the year, the Scandinavians increased total seafood exports by 11% to 1.8 million tons. (Source: Norwegian Seafood Council press release, October 18, 2018) In light of this, it is not surprising that Marine Harvest’s share is trading at record levels.¹ Especially as the world’s largest salmon farmer exceeded expectations in the third quarter in terms of both volume and earnings. (Source: Thomson Reuters media report, October 15, 2018)Opportunities: Equinor and Marine Harvest are among the heavyweights in the MSCI Daily TR Net Norway Index. In addition to the aforementioned duo, eight other shares are included in the benchmark. According to index provider MSCI, the benchmark thus covers around 85% of the free-float-adjusted market capitalization of the Scandinavian country. The ETT (symbol: ETLNO) tracks the index at a subscription ratio of 100:1. There are usually no ongoing management fees for this product structure.² The dividend payments made by the included companies are reinvested net in the index. In June 2017, UBS launched the PERLES (symbol: REUFIU) on the Norway Fish Equity Basket. The participation product denominated in Norwegian kroner is now trading at 65% above the issue price. The basket includes the industry leader Marine Harvest together with six other shares in Norwegian fisheries.
Risks: The aforementioned products do not have capital protection. Should the underlying assets deliver a negative performance, the ETT and PERLES will incur commensurate losses. Investors in structured products are also exposed to issuer risk, which means that the capital invested may be lost if UBS AG becomes insolvent, regardless of the performance of the underlying.
More UBS products and further information on the risks and opportunities are available at ubs.com/keyinvest.
MSCI™ Daily TR Net Norway USD Index 5 years¹

The MSCI™ Daily Norway Index has been trending upwards since the beginning of 2016. At the end of September, the benchmark climbed to its highest level in around four years.
Source: UBS AG, Bloomberg
As of 14.11.2018
Marine Harvest vs. SalMar vs. Leroy Seafood 5 years¹

Marine Harvest, SalMar and Leroy Seafood are the three largest members of the Norway Fish Equity Basket in terms of market value. In recent years, the trio has made impressive gains.
Source: UBS AG, Bloomberg
As of: 14.11.2018
¹) Please be aware that past performance does not indicate future results.
²) The conditions of ETTs are reviewed on a yearly basis and can be adjusted with a deadline of 13 months after the announcement.
PERLES on Norway Fish Equity Basket
| Symbol | REUFIU |
| SVSP Name | Tracker Certifikat |
| SPVSP Code | 1300 |
| Underlying | Norway Fish Equity Basket |
| Currency | NOK |
| Ratio | 1:1 |
| Participation | 100% |
| Expiry | 03.06.2019 |
| Issuer | UBS AG, London |
| Bid/Ask | NOK 1’569.00 / 1’585.00 |
More UBS products and further information on the risks and opportunities are available at ubs.com/keyinvest.
Source: UBS AG, Bloomberg
As of: 14.11.2018
Market overview
| Index | Quotation | Week¹ |
| SMI™ | 8’931.20 | -1.3% |
| SLI™ | 1’392.78 | -2.3% |
| S&P 500™ | 2’701.58 | -4.0% |
| Euro STOXX 50™ | 3’205.36 | -1.3% |
| S&P™ BRIC 40 | 3’812.92 | -3.6% |
| CMCI™ Compos. | 907.58 | -2.2% |
| Gold (troy ounce) | 1’210.10 USD | -1.5% |
¹ Change based on the closing price of the previous day compared to the closing price a week ago.
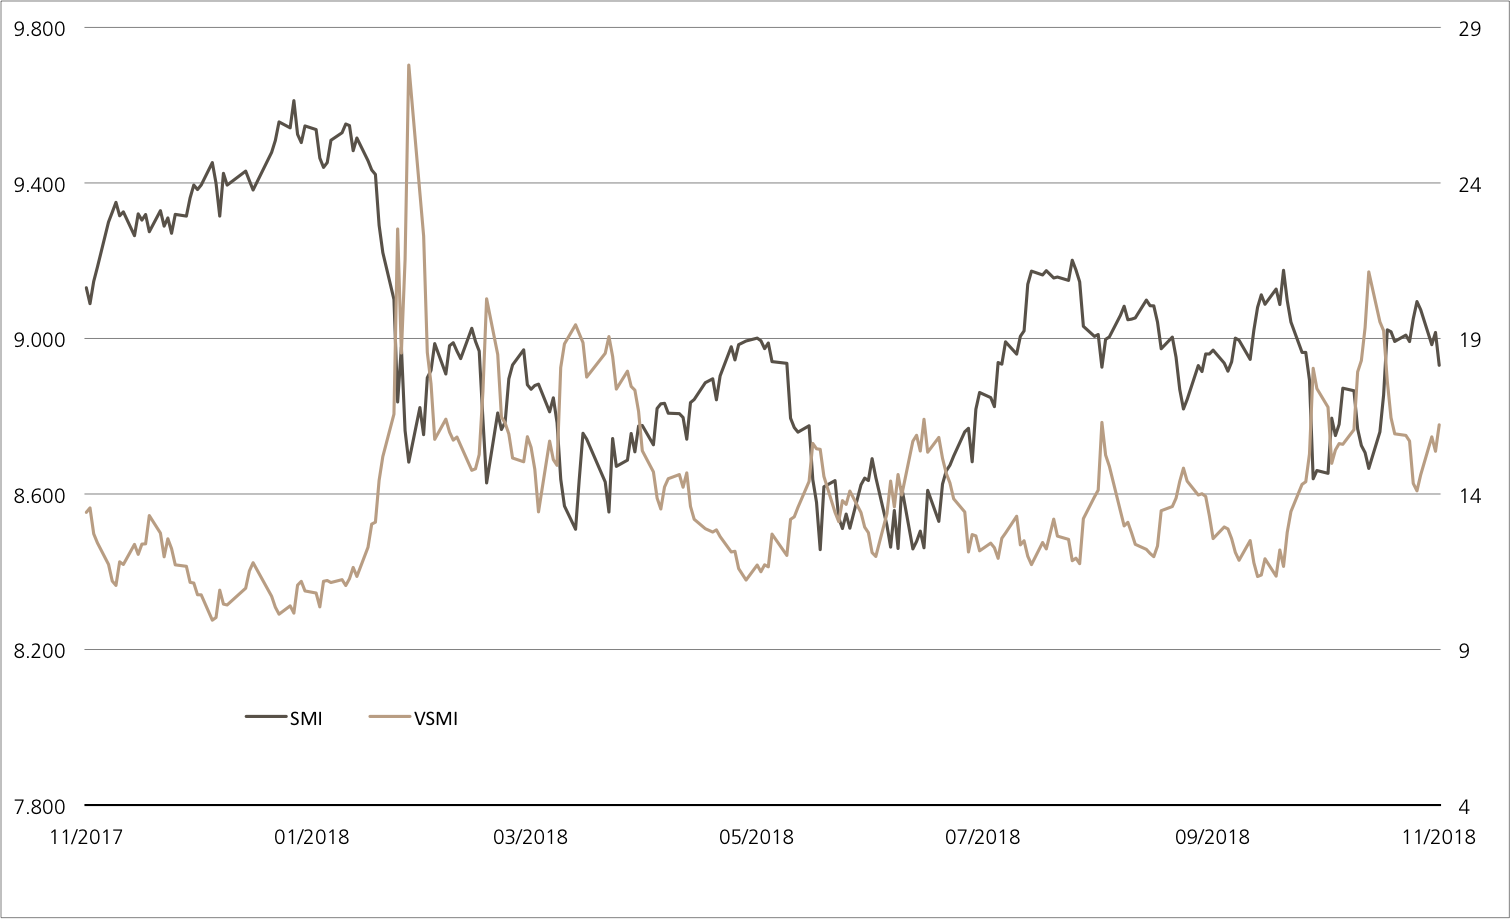
SMI™ vs. VSMI™ 1 year

The VSMI™ Index is calculated since 2005. It shows the volatility of the stocks within the SMI™ index. A portfolio which reacts only to changes in volatility instead of volatility itself is relevant for the calculation. Thereby, the VSMI™ methodology uses the squared volatility, known as variance, of the SMI options with remaining time to expiry of 30 days traded at the Eurex.
Source: UBS AG, Bloomberg
As of: 14.11.2018
General Motors / Ford
Car manufacturers with strong figures
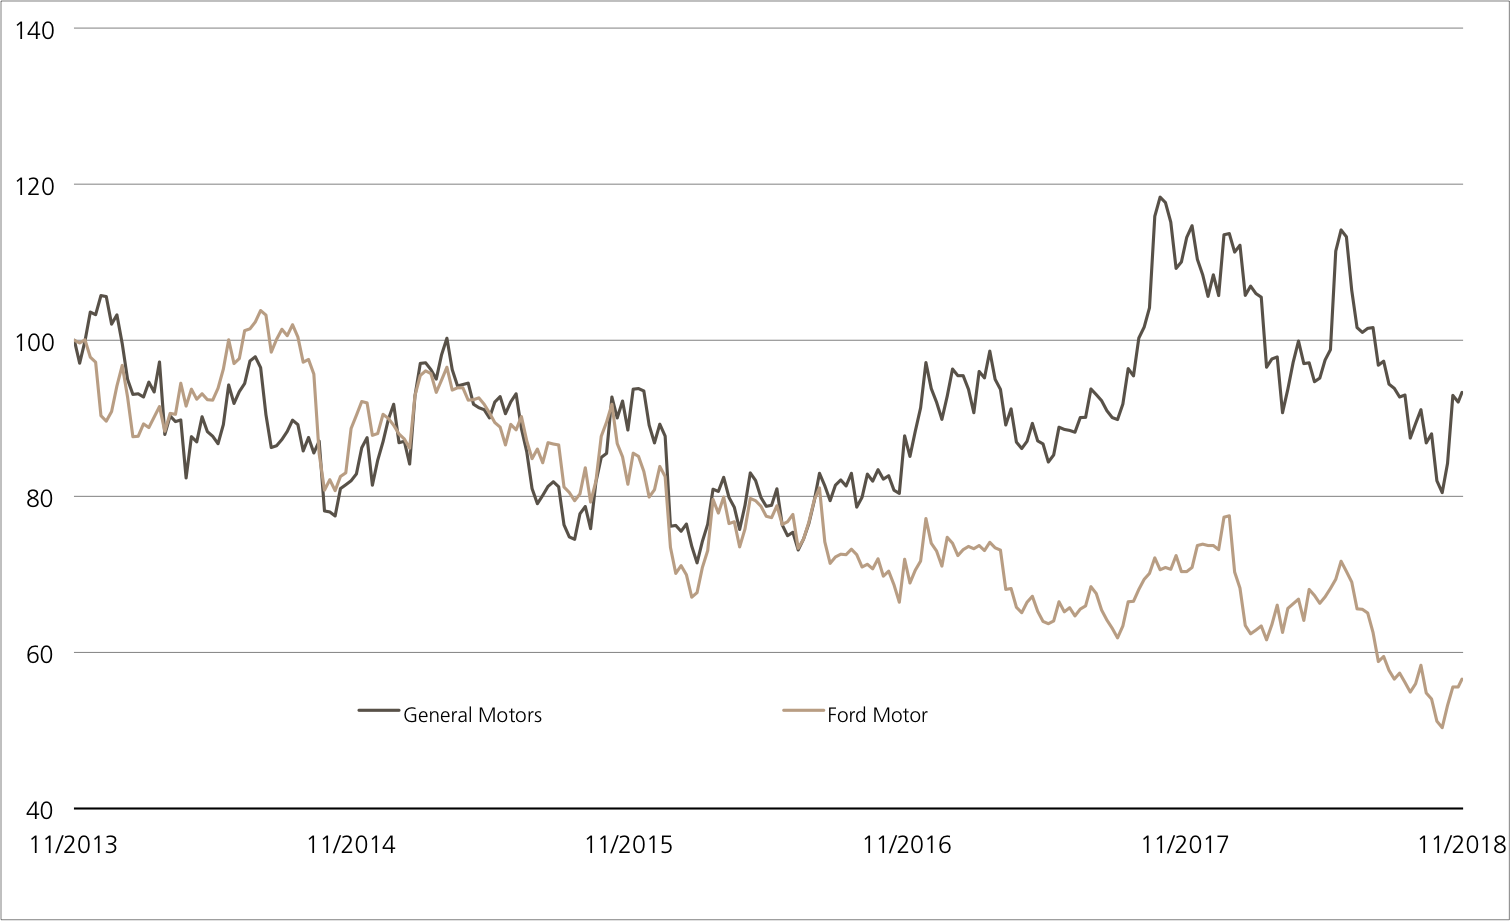
In the car world, off-road vehicles are currently all the rage. This can also be seen in the US registration figures for October. Let’s take Ford as an example – while sales of sedans seemed to be reversing out of the parking lot, SUVs recorded double-digit sales growth and over 70,000 F-Series vehicles were sold for the eighth month in a row. Business at General Motors (GM) is also flourishing thanks to SUVs. In the third quarter, the high-priced models caused operating profits to jump by 25%. Stock exchange speculators are clapping their hands with glee at the moment, as both shares have achieved double-digit percentage growth in the past four weeks.¹ The new Worst of Kick-In GOAL (symbol: KCVNDU) on the two automotive companies does not require the growth in share prices to pick up any further. The product offers an annual coupon of 10% and a risk buffer of 40% should the prices move sideways.
Not only did GM record greater earnings than expected in the third quarter, but the car manufacturer also narrowed its annual targets. The upper end of the USD 5.80 to 6.20 range for adjusted pre-tax earnings per share is now expected to be achieved in 2018. To ensure that the Group can continue making such high profits in the future, cuts are being made, with 18,000 of the 50,000 employees in North America having recently received a severance offer. As revealed in Ford’s latest quarterly report, the car manufacturer has also outperformed market forecasts. The company is still in the midst of a corporate restructuring, but this should pay off soon. Chief Financial Officer Bob Shanks confirmed the pre-tax margin target of 8% when presenting the quarterly figures. However, this will probably not be possible by 2020 as was announced. In addition, the company is investigating the opportunities presented by “the car of the future”. According to a media report, Ford is currently in discussions with VW to work together on the costly development of autonomous driving technology and electric cars. Although nothing has yet been decided, a Ford spokesman stated that the US group’s letter of intent with VW included discussions on potential collaborations in a number of areas. (Source: Thomson Reuters media report, October 31, 2018).
Opportunities: In order to generate a profit with the Worst of Kick-In GOAL (Symbol: KCVNDU), the share prices of Ford and GM only need to trend sideways. The product in subscription pays an annual coupon of 10% regardless of price performance. The repayment of the nominal is, however, linked to the underlyings. If none of the shares fall level with or below the barrier of 60% of the initial fixings, investors will remain safe from losses.
Risks: Worst-of Kick-In GOALs do not have capital protection. If the underlyings of the Kick-In GOAL touch or fall below the respective Kick-In Level (barrier), the amount repaid on the maturity date is reflecting the worst performance of the underlyings (but not more than notional value plus coupon). In this case, it is likely that losses will be incurred. Investors in structured products are also exposed to issuer risk, which means that the capital invested may be lost if UBS AG becomes insolvent, regardless of the performance of the underlying.
More UBS products and further information on the risks and opportunities are available at ubs.com/keyinvest.
General Motors vs. Ford Motor 5 years¹

Source: UBS AG, Bloomberg
As of: 14.11.2018
10.00% p.a. Worst of Kick-In GOAL on General Motors / Ford
| Symbol | KCVNDU |
| SVSP Name | Barrier Reverse Convertible |
| SPVSP Code | 1230 |
| Underlyings | General Motors / Ford |
| Currency | USD |
| Coupon | 10.00% p.a. |
| Kick-In Level | 60.00% |
| Expiry | 21.11.2019 |
| Issuer | UBS AG, London |
| Subscription until | 21.11.2018, 15:00 h |
More UBS products and further information on the risks and opportunities are available at ubs.com/keyinvest.
Source: UBS AG, Bloomberg
As of: 14.11.2018
¹) Please be aware that past performance does not indicate future results.
²) The conditions of ETTs are reviewed on a yearly basis and can be adjusted with a deadline of 13 months after the announcement.