Friday, 14.12.2018

- Topic 1: Fintech - The change goes on
- Topic 2: Airlines - A turbulent year
Fintech
The change goes on
Equities have fallen right of favor as an asset class in 2018. With little time left to the end of the year, negative numbers predominate all round the world. But there are exceptions. Despite all concerns about a crisis, for example, digitalization moves relentlessly on in all sorts of areas in life and business. Including, and especially, in financial services. So the Solactive FinTech 20 Total Return Index is on the winning side in 2018. Although the innovative benchmark has corrected from its all-time high in early October, it is 8% up since the end of last year in US dollars.¹ UBS passively replicates the Solactive FinTech 20 Total Return Index with an Open End PERLES. This allows investors to invest in the megatrend in a diversified manner with no maturity limitation. The participation product is available in Swiss francs (symbol: FINTE), US dollars (symbol: FINTEU) and euro (symbol: FINTEE).
UBS CIO GWM defines fintech as innovations that make banking and financial services easier. The megatrend also appears in the recent publication “Year Ahead 2019” from the world’s leading wealth manager. In this outlook the CIO GWM ranks fintech as one of the most promising longer term investments (LTI). In the current environment in particular, with growth harder to find, experts see such long-term investments as attractive. The LTIs are thematic ideas based on structural trends like population growth, aging and urbanization. CIO GWM believes such themes can guide investors through the current turbulence on the markets and into the future. It sees several driving factors in favor of fintech. Along with rising urbanization, millennials are driving up demand for digital financial solutions.
This is the generation born between 1982 and 1998 who grew up with digitalization. With regulation supportive too, CIO GWM sees fintech at a turning point: segment revenue could rise from USD 120 billion last year to USD 265 billion by 2025. Capital market professionals recommend taking a diversified position in LTIs to reduce dependence on individual stocks. (source: UBS CIO GWM, “Year Ahead 2019”, 6 December 2018) A glance at the Solactive FinTech 20 Total Return Index shows that this strategy paid off in 2018, which was a difficult year on the stock market. Five of the 20 constituents, including Swiss banking software specialist Temenos, are down year to date. But one-third of the stocks in the index are in positive territory, including current index heavyweight MarketAxess. The operator of an electronic trading platform has added 7.2% to the benchmark. The equally heavily weighted financial information services provider Thomson Reuters has also gained in 2018 to date.¹ The index, for which only companies with a significant share of their business in fintech qualify, is updated twice a year. Provider Solactive then rebalances, so all constituents are once again equally weighted.Opportunities: UBS opened the Open End PERLES on the dynamic benchmark back in May 2015. Investors can implement this long-term investment idea without any maturity limitation and in the three index currencies: Swiss francs (symbol: FINTE), US dollars (symbol: FINTEU) and euro (symbol: FINTEE). The management fee is a consistent 0.75% p.a. Any net dividends paid by index companies are reinvested in the underlying stock.
Risks: Open End PERLES do not have capital protection. Losses will be made if the underlying index declines. The currency risk must also be taken into account, as the trading currency of the PERLES shown may differ from the currencies of the index members. Investors in structured products are also exposed to issuer risk, which means that the capital invested may be lost if UBS AG becomes insolvent, regardless of the performance of the underlying.
More UBS products and further information on the risks and opportunities are available at ubs.com/keyinvest.
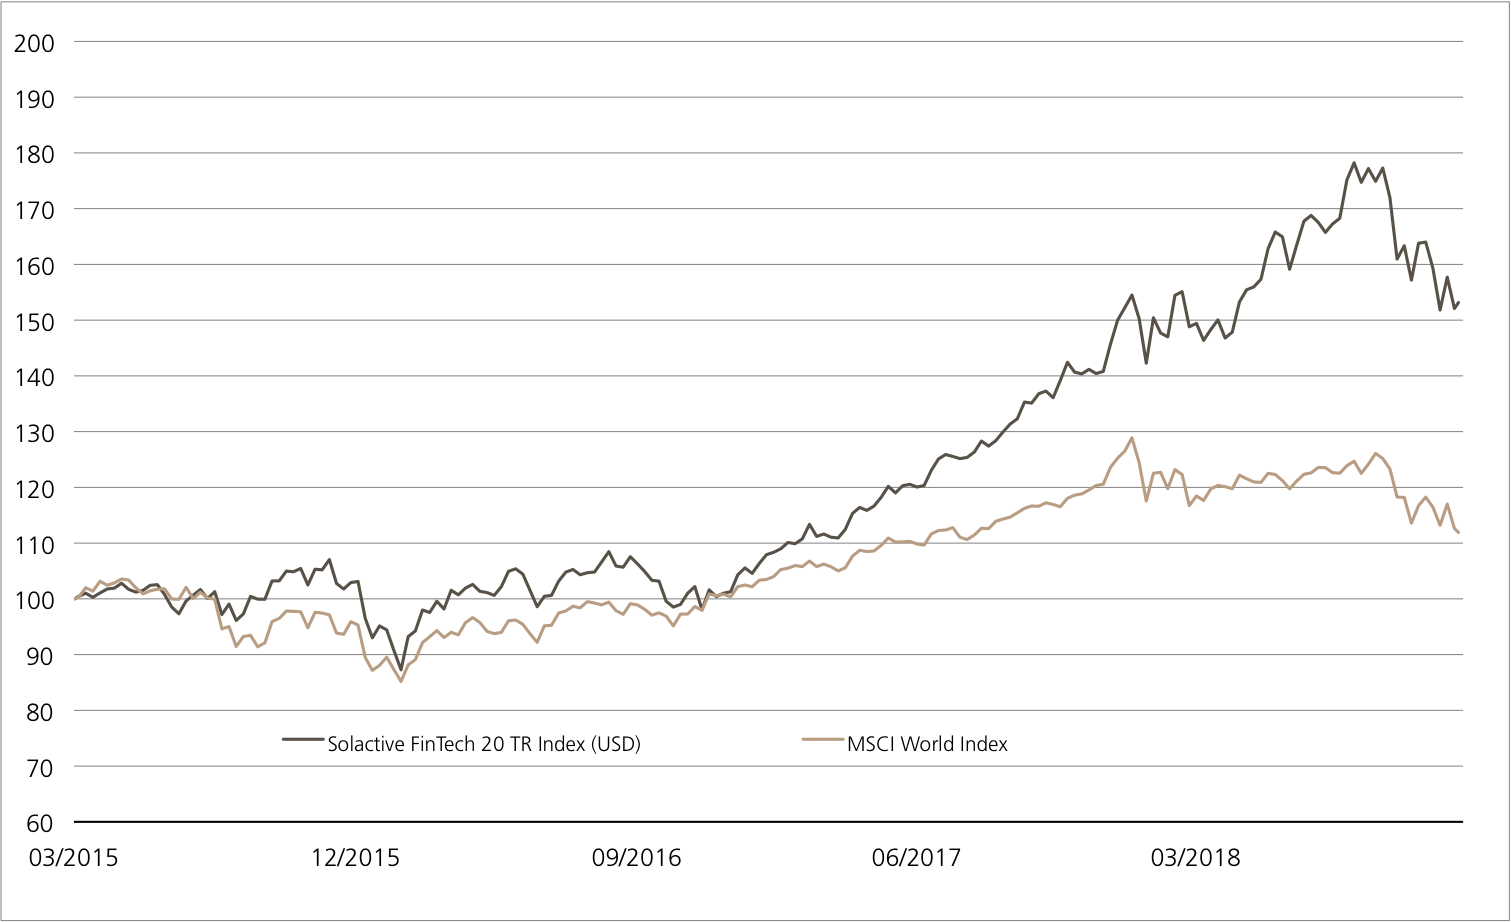
Solactive FinTech 20 TR Index (USD) vs. MSCI™ World Index (from 30 March 2015, for illustrative purposes only, figures in%)¹

The fintech segment has not been able to avoid the correction on the stock market. The sector index has outperformed the global equity market both since launch in March 2015 and in the current year.
Source: UBS AG, Bloomberg
As of 13.12.2018
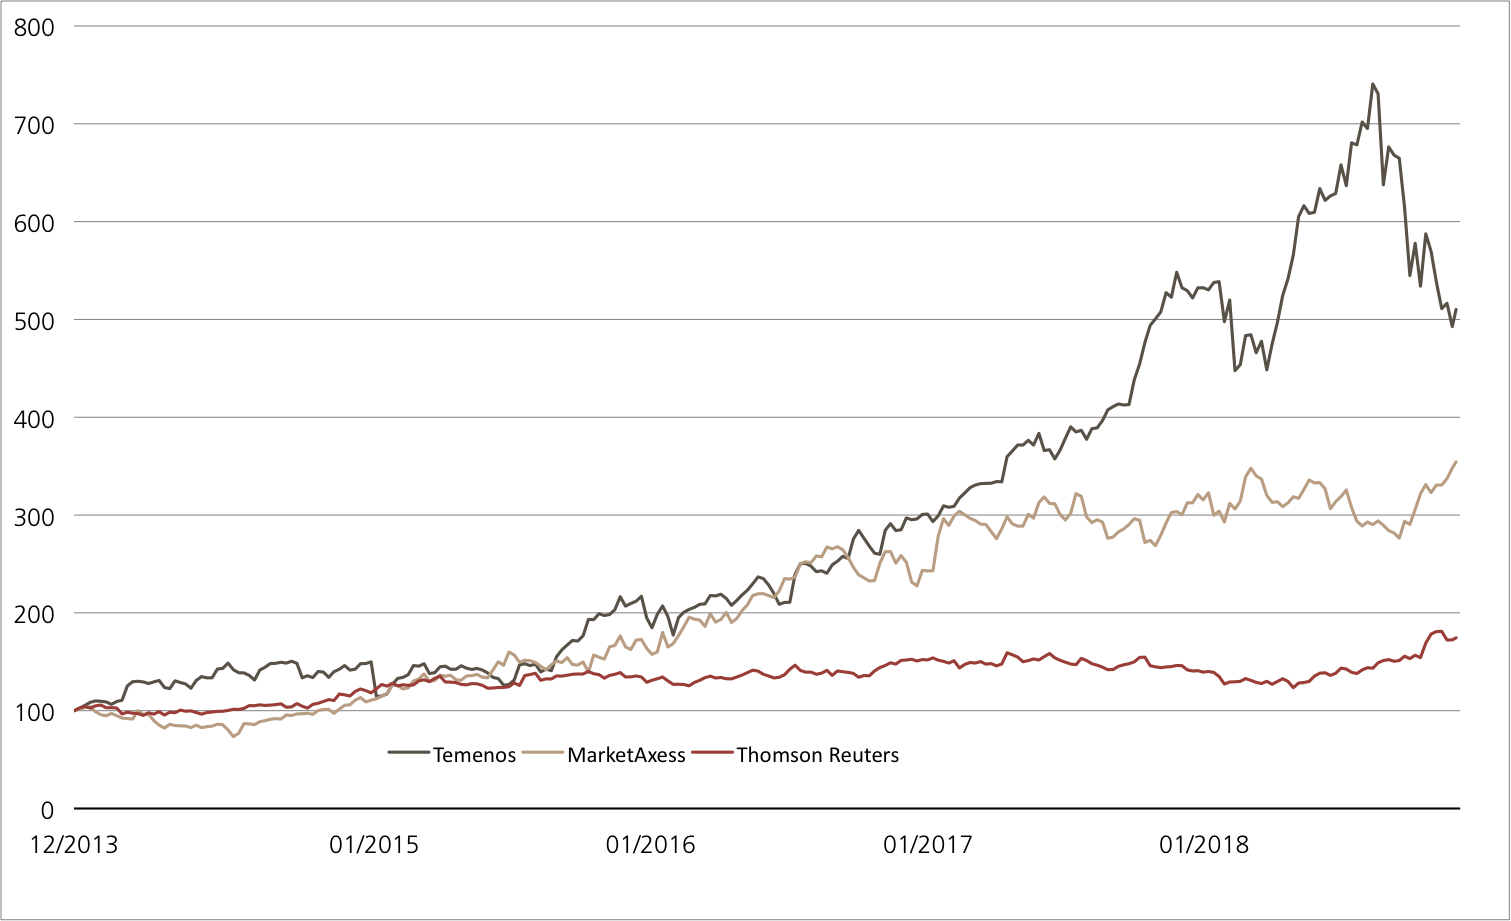
Temenos vs. MarketAxess vs. Thomson Reuters vs. Intel (five years, for illustrative purposes only, figures in %)¹

Temenos has weakened considerably from its all-time high. Even so, the banking software specialist has still beaten both MarketAxess and Thomson Reuters over five years.
Source: UBS AG, Bloomberg
As of: 13.12.2018
¹) Please be aware that past performance does not indicate future results.
²) The conditions of ETTs are reviewed on a yearly basis and can be adjusted with a deadline of 13 months after the announcement.
Open End PERLES on Solactive FinTech 20 Total Return Index (CHF)
| Symbol | FINTE |
| SVSP Name | Tracker Certificates |
| SPVSP Code | 1300 |
| Underlying | Solactive FinTech 20 Total Return Index (CHF) |
| Currency | CHF |
| Ratio | 1.0108:1 |
| Administration fee | 0.75% p.a. |
| Expiry | Open End |
| Participation | 100% |
| Issuer | UBS AG, London |
| Bid/Ask | CHF 162.60 / 164.30 |
Open End PERLES on Solactive FinTech 20 Total Return Index (USD)
| Symbol | FINTEU |
| SVSP Name | Tracker Certificates |
| SPVSP Code | 1300 |
| Underlying | Solactive FinTech 20 Total Return Index (USD) |
| Currency | USD |
| Ratio | 1:1.013685 |
| Administration fee | 0.75% p.a. |
| Participation |
100% |
| Expiry | Open End |
| Issuer | UBS AG, London |
| Bid/Ask | USD 153.20 / 154.80 |
More UBS products and further information on the risks and opportunities are available at ubs.com/keyinvest.
Source: UBS AG, Bloomberg
As of: 13.12.2018
Market overview
| Index | Quotation | Week¹ |
| SMI™ | 8’861.14 | -0.9% |
| SLI™ | 1’361.78 | -1.1% |
| S&P 500™ | 2’651.07 | -1.8% |
| Euro STOXX 50™ | 3’107.97 | -1.3% |
| S&P™ BRIC 40 | 3’889.01 | -2.5% |
| CMCI™ Compos. | 890.00 | -1.0% |
| Gold (troy ounce) | 1’250.00 USD | 0.6% |
¹ Change based on the closing price of the previous day compared to the closing price a week ago.
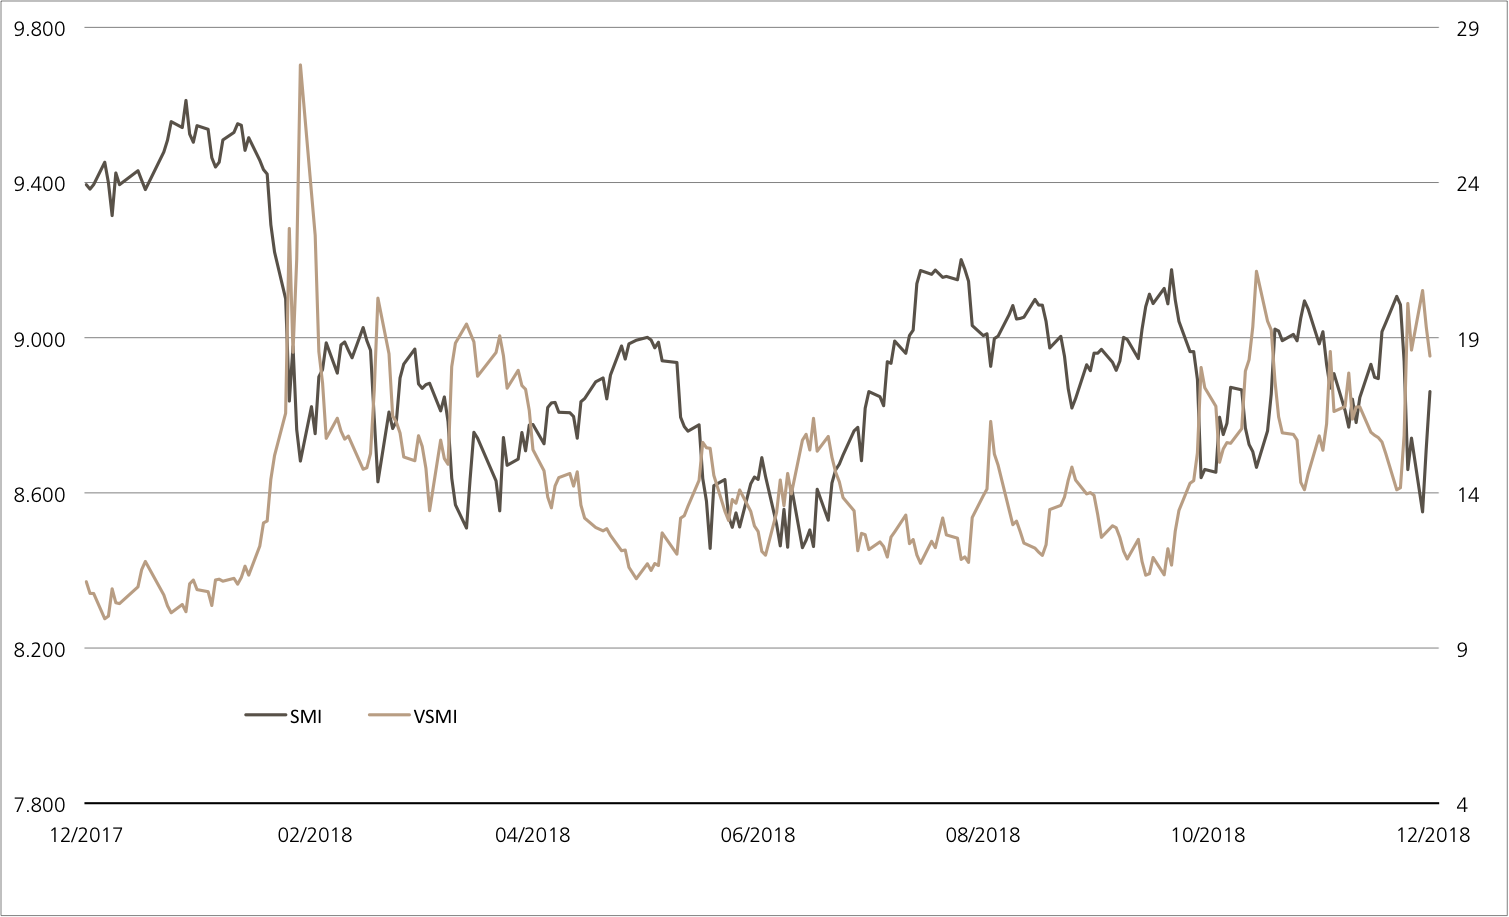
SMI™ vs. VSMI™ 1 year

The VSMI™ Index is calculated since 2005. It shows the volatility of the stocks within the SMI™ index. A portfolio which reacts only to changes in volatility instead of volatility itself is relevant for the calculation. Thereby, the VSMI™ methodology uses the squared volatility, known as variance, of the SMI options with remaining time to expiry of 30 days traded at the Eurex.
Source: UBS AG, Bloomberg
As of: 13.12.2018
Airlines
A turbulent year
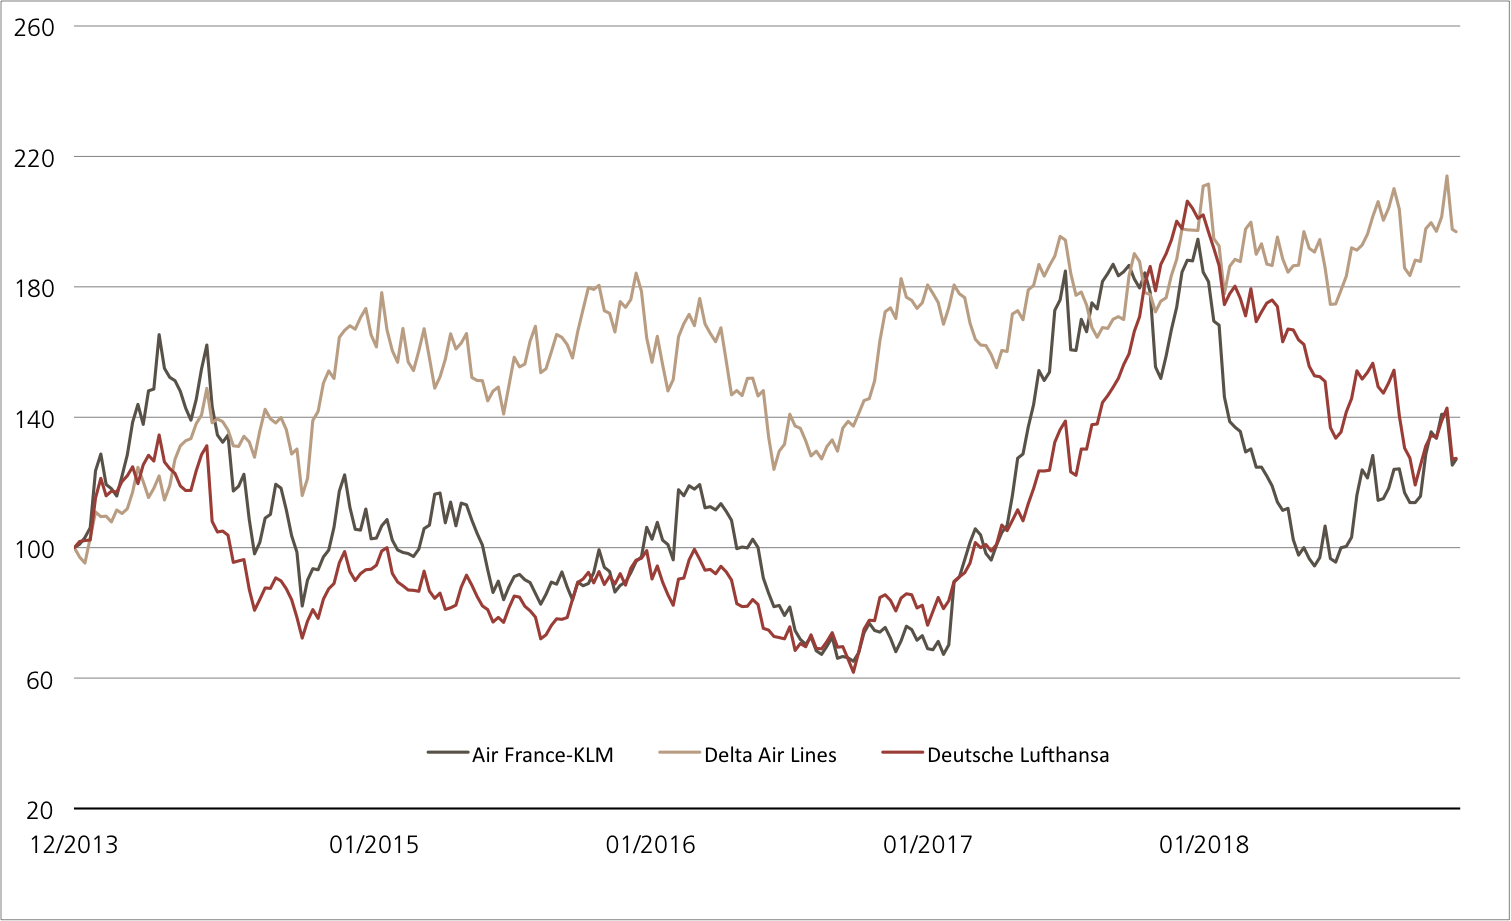
Numerous flight cancellations and delays and a sharp rise in aviation fuel prices have caused problems for airlines in 2018. Industry stocks in Europe in particular have fallen heavily in value. Lufthansa and Air France-KLM have stabilized recently, while US competitor Delta Air Lines continues its 2018 uptrend. The three carriers allow attractive conditions as underlying for a Callable Kick-In GOAL (Symbol: KCKLDU): the product offers a positive minimum return of 16.4% p.a. at maturity. The current worst performer, Lufthansa, has a safety buffer of just under 28%.
Growth in the airline industry remains intact. The group, which includes SWISS, transported around 10.6 million passengers in November, 6.1% more than in the same month the previous year. Between January and November 132.4 million passengers boarded Lufthansa aircraft, a growth rate of 10.3% year on year. (source: Lufthansa press release, 11 December 2018) Air France-KLM has not been able to keep up. Its passenger numbers rose 2% to 78.8 million in the first eleven months. However, the French had not increased capacity as much as their German competitor. (source: Air France-KLM press release, 10 December 2018) Delta Air Lines moved a hefty 177.2 million people around the world between January and November 2018. It was not so much the growth rate as the outlook that went down poorly with the stock market: Delta is expecting revenue per passenger mile to rise 3-5% in the current (fourth) quarter. This forecast is at the lower end of previous expectations. (Source: Thomson Reuters media report, 4 December 2018)
Opportunities: With the Callable Kick-In GOAL (symbol: KCKLDU) investors are counting on the three airline stocks being able to maintain their current “altitude” until final maturity. If this calculation proves correct, the product will pay a return of 16.4% p.a. in September 2020. While Air France-KLM has been largely steady since the product was launched, Lufthansa is well below the initial fixing. There remains just under 28% before the worst performer touches the barrier. The issuer is entitled to terminate the product early for the first time on 19 September 2019, and subsequently every three months thereafter. If it uses the callable function, holders get the full nominal back plus the pro rata coupon.
Risks: This product does not have capital protection. If the underlyings touch or fall below the respective kick-in level (barrier) and the callable feature does not apply, the amount repaid on the date of maturity may be in cash, reflecting the worst performance of the three index shares (but not more than nominal value plus coupon). In this case, it is likely that losses will be incurred. Investors in structured products are also exposed to issuer risk, which means that the capital invested may be lost if UBS AG becomes insolvent, regardless of the performance of the underlying.
More UBS products and further information on the risks and opportunities are available at ubs.com/keyinvest.
Air France-KLM vs. Delta Air Lines vs. Deutsche Lufthansa (five years, for illustrative purposes only, figures in %)¹

Source: UBS AG, Bloomberg
As of: 13.12.2018
11.00% p.a. Callable Kick-In GOAL on Air France-KLM / Delta Air Lines / Lufthansa
| Symbol | KCKLDU |
| SVSP Name | Barrier Reverse Convertible |
| SPVSP Code | 1230 (Auto-Callable) |
| Underlyings | Air France-KLM / Delta Air Lines / Deutsche Lufthansa |
| Currency | EUR |
| Coupon | 11.00% p.a. |
| Sideways return | 29.70% (15.57% p.a.) |
| Kick-In Level (Distance) | Air France-KLM: EUR 5.4132 (44.40%) Delta Air Lines: USD 34.74 (38.36%) Lufthansa: EUR 13.902 (29.38%) |
| Expiry | 21.09.2020 |
| Issuer | UBS AG, London |
| Bid/Ask | 90.74% / 91.74% |
More UBS products and further information on the risks and opportunities are available at ubs.com/keyinvest.
Source: UBS AG, Bloomberg
As of: 13.12.2018
¹) Please be aware that past performance does not indicate future results.
²) The conditions of ETTs are reviewed on a yearly basis and can be adjusted with a deadline of 13 months after the announcement.