Friday, 25.01.2019

- Topic 1: Mergers and acquisitions - Systematic premium hunting
- Topic 2: Netflix - Performing well
Mergers and acquisitions
Systematic premium hunting
In the Swiss mergers and acquisitions (M&A) market, 2019 began with a bang: On January 16, the logistics group DSV made a non-binding offer for Panalpina. The Danes indicated that they were prepared to pay CHF 170 in cash in addition to treasury shares for each share in the company. The price offered thus represented a premium of 24.1% over the closing price fixed for Panalpina on the day prior to publication.¹ This is yet another example of how lucrative M&A events can be for investors. With Open End PERLES (symbol: MANDAU) on the Solactive M&A Europa Total Return Index, it is possible to systematically hunt for acquisition premiums. The participation product replicates the 40 potential takeover candidates in the benchmark with a subscription ratio of 1:1.
It is clear that some investors are betting on there being further bidders for Panalpina. In any case, one week after the approach by DSV, the logistics company’s shares have been trading almost seven francs higher than the offer price. One potential counterbidder would be Kühne+Nagel. The Swiss sector player already signaled its interest in Panalpina last autumn. In response to an inquiry from Reuters, Kühne+Nagel did not wish to comment on the latest developments, however. (Source: Thomson Reuters media report, 1/16/2019).
Nevertheless, DSV’s approach for the Swiss mid-cap company underlines just how active the Swiss M&A market is. According to a recent study by the consulting and audit company KPMG, the number of deals over the last year rose by 24.8% to 493, which is the highest number since the survey began in 2007. In terms of transaction volumes, the experts have observed above-average growth: This figure increased by 30.9% to USD 101.5 billion, which is still somewhat short of the record USD 188.1 billion from 2014. The largest deal of the year involved an SMI™ heavyweight: Novartis sold a 36.5% stake in a joint venture to GlaxoSmithKline for USD 13 billion. (Source: KPMG, press release, January 16, 2019) The only Swiss company currently in the M&A Europe Index also comes from the same sector as these two major corporations. Vifor Pharma is one of a total of 40 shares to have currently made it through the multi-level selection process. The first criteria stipulated by the index methodology relate to trading liquidity and market capitalization. All shares that meet these quantitative requirements are then subjected to checks using well-known stock market indicators. In addition to the average analysts’ forecast regarding earnings per share for the upcoming fiscal year (FY1 IBES EPS), the price-to-book value (PBV) ratio and the one-year revenue growth must be positive. Stocks that are overvalued in terms of PBV compared to their sector are not included. The same applies to companies whose average EPS estimate is below the sector median. Of the remaining stocks, the 40 companies with the strongest revenue growth are taken into the index with equal weightings. Each quarter, Solactive carries out a review and makes adjustments as necessary – this process involves restoring the 40 component stocks to equal weightings.Opportunities: All it takes is a single order to make this dynamic, Europe-focused M&A strategy part of your portfolio with Open End PERLES (symbol: MANDAU). The product passively replicates the underlying assets without any maturity limitation after deduction of the annual management fee of 0.75% p.a. It allows investors to participate in the distributions from the shares contained in the index – any net dividends are reinvested in the benchmark.
Risks: Open End PERLES do not have capital protection. Losses will be made if the underlying index declines. The currency risk must also be taken into account, as the trading currency of some index constituents may differ from the trading currency of the certificate shown. Investors in structured products are also exposed to issuer risk, which means that the invested capital may be lost if UBS AG becomes insolvent, regardless of the performance of the underlying.
More UBS products and further information on the risks and opportunities are available at ubs.com/keyinvest.
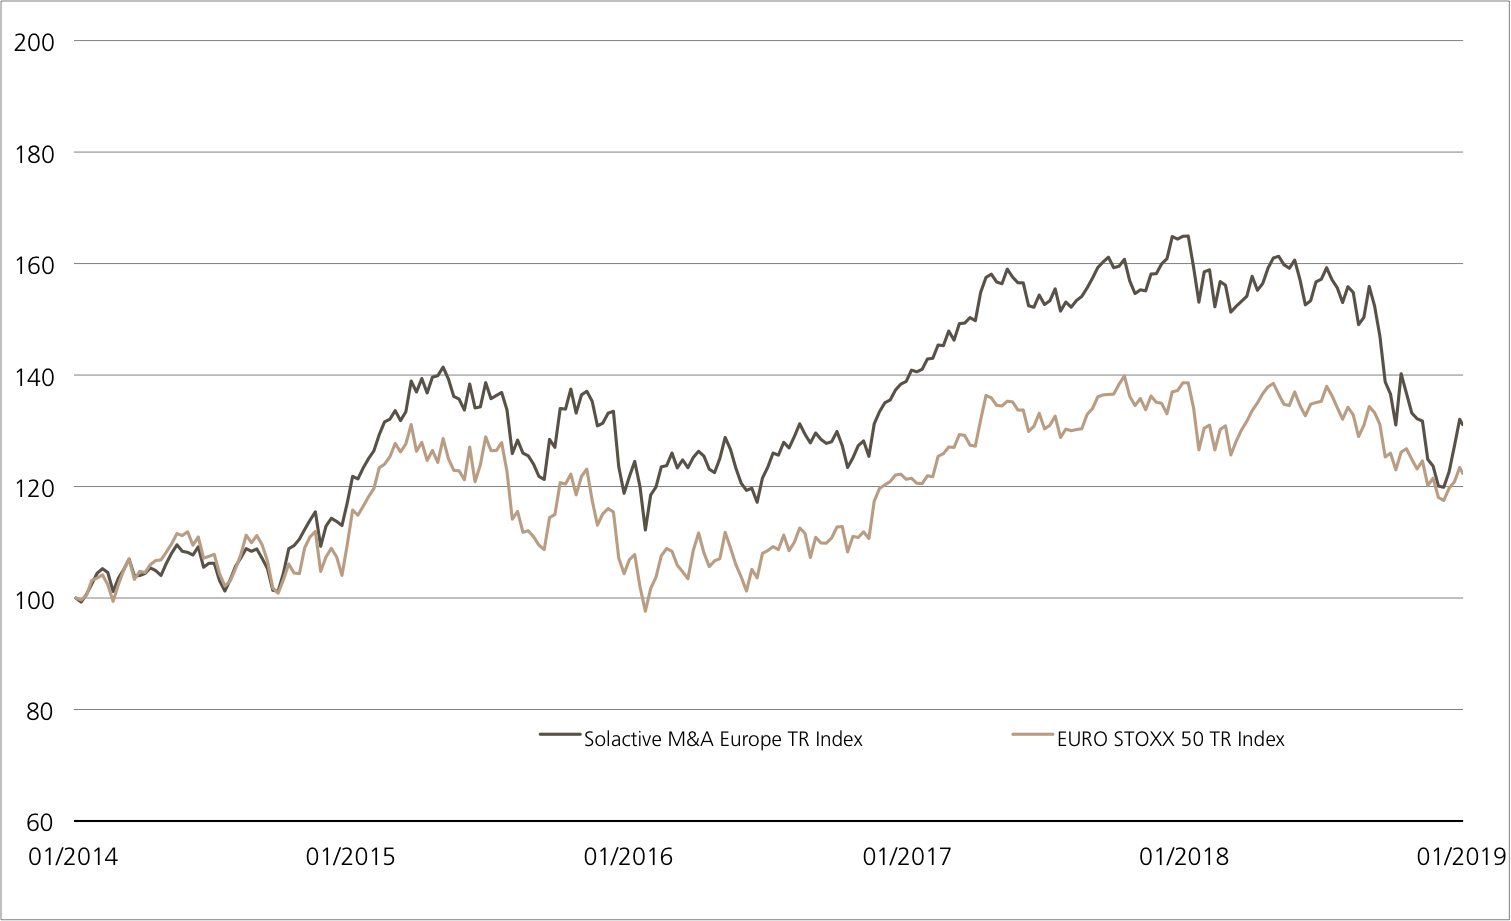
Solactive M&A Europe TR Index vs. EURO STOXX 50™ TR Index
(5 years; for illustrative purposes only; figures in %)

In the wake of the recent stock market correction, the M&A benchmark lost its long-term advantage over the EURO STOXX 50™. However, it was able to make up some ground at the start of 2019.
Source: UBS AG, Bloomberg
As of 23.01.2019
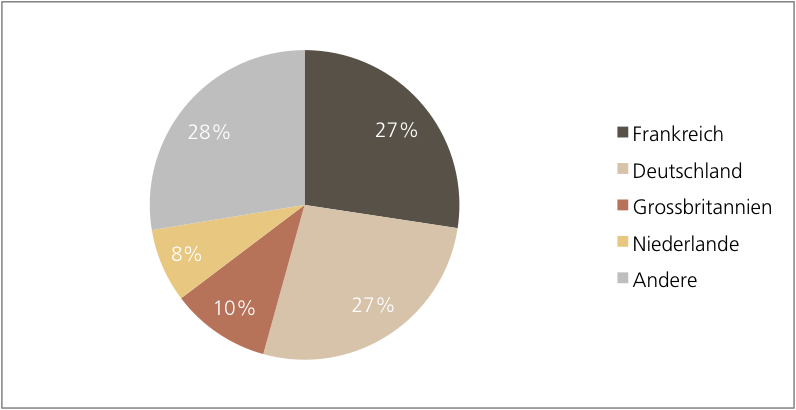
Solactive M&A Europe TR Index: Weighting by country

French companies in the Solactive M&A Europa TR Index are currently setting the tone. German and UK shares are the only others to account for double-digit percentage weightings.
Source: UBS AG, Bloomberg
As of: 23.01.2019
¹) Please be aware that past performance does not indicate future results.
²) The conditions of ETTs are reviewed on a yearly basis and can be adjusted with a deadline of 13 months after the announcement.
Open End PERLES on Solactive M&A Europe Total Return Index
| Symbol | MANDAU |
| SVSP Name | Tracker Certificates |
| SPVSP Code | 1300 |
| Underlying | Solactive M&A Europe Total Return Index |
| Currency | EUR |
| Ratio | 1:1 |
| Administration fee | 0.75% p.a. |
| Expiry | Open End |
| Participation | 100% |
| Issuer | UBS AG, London |
| Bid/Ask | EUR 176.20 / 178.00 |
Key facts Solactive M&A Europe Total Return Index
| ISIN | DE000SLA16H5 |
| Index Sponsor | Solactive AG |
| Index Currency |
EUR |
| Index Components | 40 |
| Dividend | Reinvest (Total Return Index) |
| Coupon | 14.00% p.a. |
| Current status |
182.10 |
| Underlying / date | 100 / 01.03.2010 |
| Issuer | UBS AG, London |
| Subscription until | 30.01.2019, 15:00 h |
More UBS products and further information on the risks and opportunities are available at ubs.com/keyinvest.
Source: UBS AG, Bloomberg
As of: 23.01.2019
Market overview
| Index | Quotation | Week¹ |
| SMI™ | 8’957.19 | 0.9% |
| SLI™ | 1’390.66 | 1.2% |
| S&P 500™ | 2’638.70 | 0.9% |
| Euro STOXX 50™ | 3’112.13 | 1.1% |
| S&P™ BRIC 40 | 4’025.73 | 0.3% |
| CMCI™ Compos. | 896.53 | 0.4% |
| Gold (troy ounce) | 1’284.00 USD | -0.8% |
¹ Change based on the closing price of the previous day compared to the closing price a week ago.
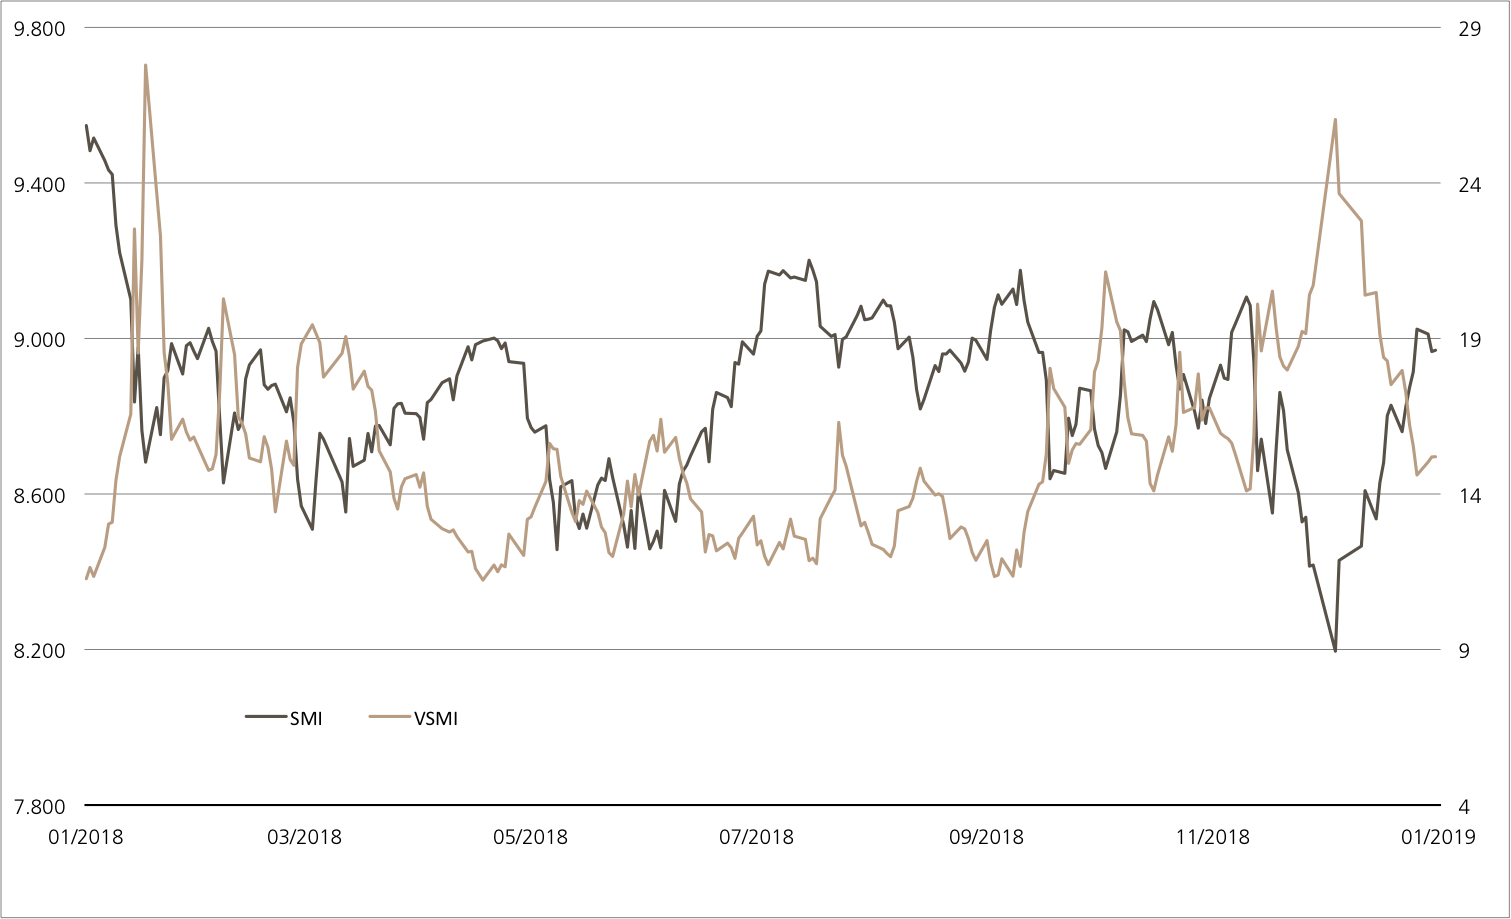
SMI™ vs. VSMI™ 1 year

The VSMI™ Index is calculated since 2005. It shows the volatility of the stocks within the SMI™ index. A portfolio which reacts only to changes in volatility instead of volatility itself is relevant for the calculation. Thereby, the VSMI™ methodology uses the squared volatility, known as variance, of the SMI options with remaining time to expiry of 30 days traded at the Eurex.
Source: UBS AG, Bloomberg
As of: 23.01.2019
Netflix
Performing well
The Netflix share price is once again keeping Wall Street on its toes. Since the start of the year, the streaming service provider has gained 26%, helping it to further build on its long-term lead over the NASDAQ-100 Index (see chart)¹. Even if the technology high-flyer does not maintain this pace, a minimum return of almost 16% would be possible with Kick-In GOAL (symbol: KCEFDU). At present, the underlying stock is 37% away from the barrier.
Netflix has been disrupting the media sector for many years. Now the streaming service provider also has its eyes on the greatest film awards in the world. The Netflix production “Roma” has received ten nominations for this year’s Oscars, including in the “Best Film” category. If it were to actually win this coveted prize, this would be yet another key milestone for Netflix. (Source: Thomson Reuters media report, January 22, 2019).
In operational terms, the company continued to grow in 2018. In the fourth quarter alone, Netflix attracted 8.8 million new customers – more than in any other previous quarter. The company now has 139 million subscribers. By contrast, Wall Street was less impressed with its outlook. For the ongoing first quarter, the company’s management are expecting revenues of almost USD 4.5 billion, with a profit of USD 253 million. This forecast is significantly below previous analyst expectations. In light of this, the euphoria surrounding the Nasdaq share, which was sparked by the announcement of price increases, abated somewhat. (Source: Thomson Reuters media report, January 18, 2019).Opportunities: Although Kick-In GOAL (symbol: KCEFDU) was able to make up some ground following the recent price rally by Netflix, the structured product is trading some way below the 100% mark. This means there is a return opportunity, which is somewhat larger than the coupon. On maturity, there is the prospect of income amounting to 20% p.a. for Kick-In GOAL. This requires that Netflix does not fall to or below the barrier of USD 208.566. At present, the underlying stock has a safety buffer of 36.6%
Risks: This product does not have capital protection. If Netflix falls to or below the kick-in level (barrier) once during the term, the underlying stock has to be trading at least at the strike level on maturity. Otherwise, the amount repaid will fall in line with the decline in the Netflix share price. In this case, it is likely that losses will be incurred. Investors in structured products are also exposed to issuer risk, which means that the invested capital may be lost if UBS AG becomes insolvent, regardless of the performance of the underlying.
More UBS products and further information on the risks and opportunities are available at ubs.com/keyinvest.
Netflix vs. Nasdaq-100 Index
(five years, for illustrative purposes only, figures in %)¹

Source: UBS AG, Bloomberg
As of: 23.01.2019
10.00% p.a. Kick-In GOAL on Netflix
| Symbol | KCEFDU |
| SVSP Name | Barrier Reverse Convertibles |
| SPVSP Code | 1230 |
| Underlyings | Netflix |
| Currency | USD |
| Coupon | 10.00% p.a. |
| Sideways return | 13.93% (18.02% p.a.) |
| Kick-In Level (Distance) |
USD 208.566 (35.56%) |
| Expiry | 07.11.2019 |
| Issuer | UBS AG, London |
| Bid/Ask | 93.14% / 94.14% |
More UBS products and further information on the risks and opportunities are available at ubs.com/keyinvest.
Source: UBS AG, Bloomberg
As of: 23.01.2019
¹) Please be aware that past performance does not indicate future results.
²) The conditions of ETTs are reviewed on a yearly basis and can be adjusted with a deadline of 13 months after the announcement.