Friday, 21.12.2018

- Topic 1: Investment idea 2019 I - Dividend stocks
- Topic 2: Investment idea 2019 II - European Utilities
Investment idea 2019 I
Dividend stocks
On 6 December UBS published its much-respected report “Year Ahead”. Suitably for the current situation on the financial markets, the 2019 outlook is entitled “Turning Points”. In the 76-page publication the experts at the world’s leading wealth manager take a close look at what might happen in the new year. They also, as usual, make specific recommendations. You can find “Year Ahead” at ubs.com/cio. As far as equities as an asset class are concerned, European utilities are among the favorites of UBS CIO GWM – see page 3. They also think dividend stocks are promising. With the Open End PERLES (symbol: SWDIV) on the Dow Jones Switzerland Select Dividend 15 Index™ investors can gain exposure to high-yielding shares in the domestic market at a single stroke. This tracker certificate has been on the market for over seven years, whereas the Open End PERLES (symbol QIXEUU) on the QIX Dividenden Europa Index was launched in mid-2017.
The Chief Investment Office of UBS Global Wealth Management (CIO GWM) expects global economic growth to weaken from 3.8% in the year now ending to 3.6% in 2019. Corporate earnings will also rise more slowly. CIO GWM feels that the prices of many financial assets already reflect the uncertain prospects. UBS Wealth Management is therefore going in 2019 overweight in global equities. Given the advanced stage of the market cycle, though, they recommend diversification and hedging. “Investors should hold on to their positions in global equities, but be braced for market volatility,” is how Mark Haefele, Chief Investment Officer at CIO GWM, summarizes the outlook. (Source: UBS, press release, 06.12.2018)
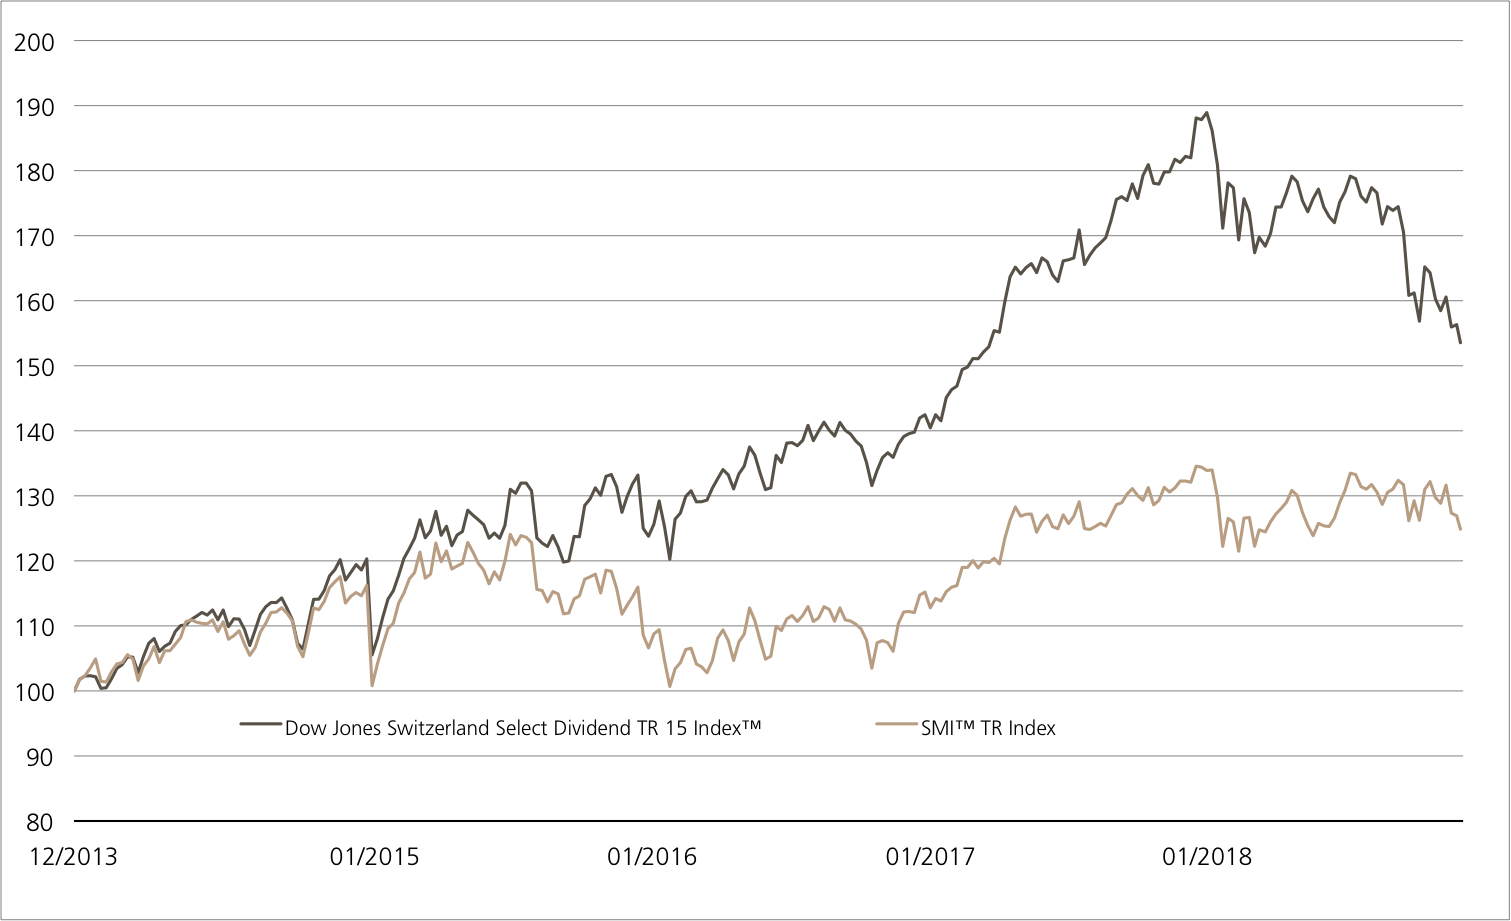
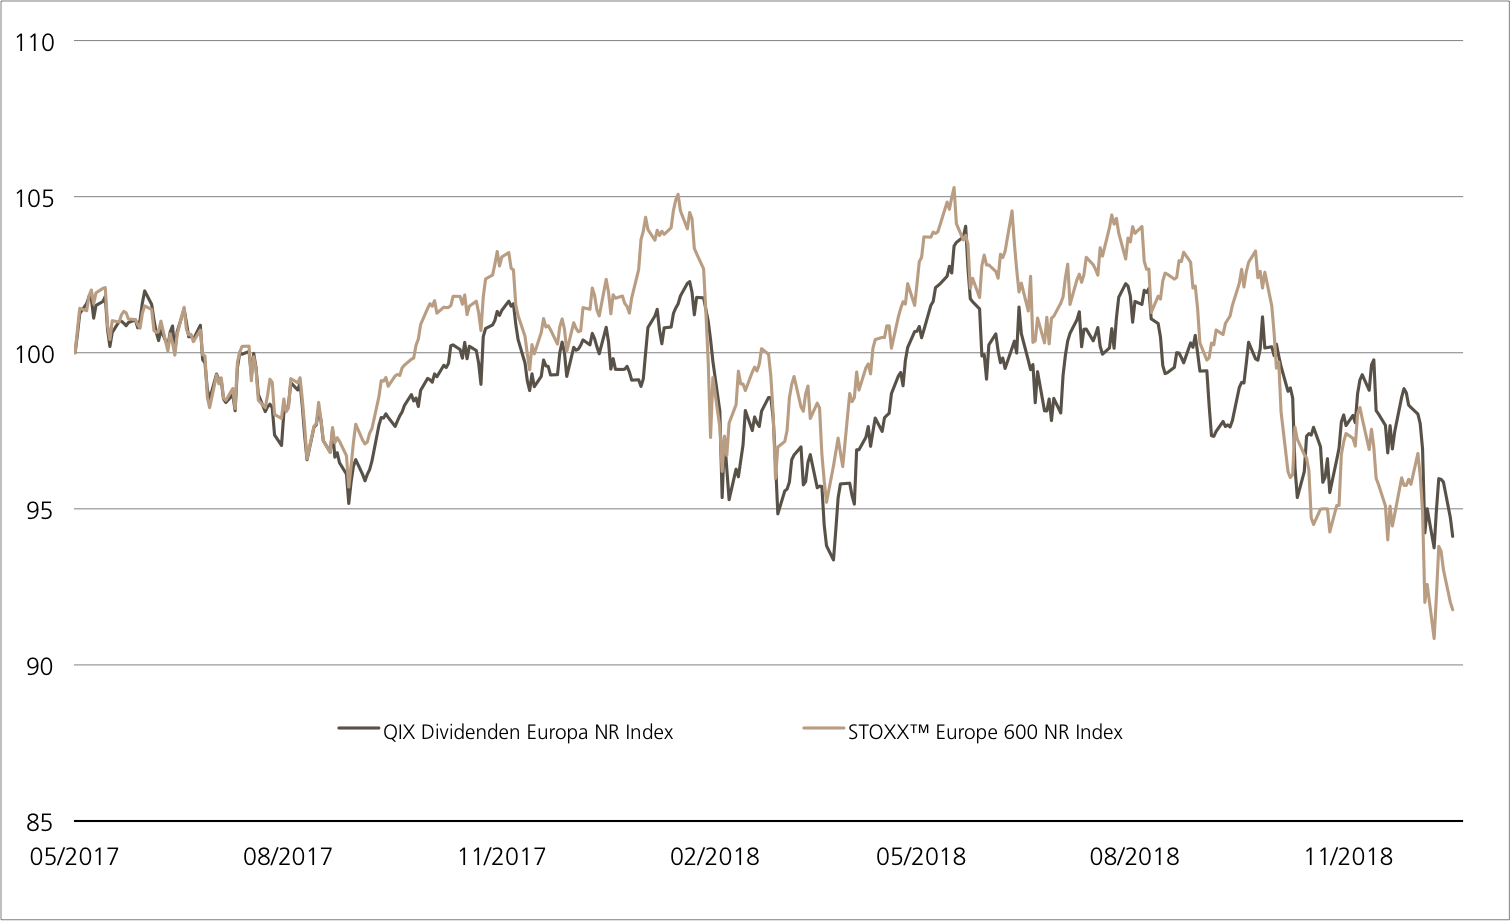
One argument in favor of equities as an asset class is the dividends. According to CIO GWM, this is particularly the case for the Eurozone and Switzerland, where investors still face low interest rates. The dividend yield on the Swiss Performance Index (SPI™) is currently around 3%. By way of comparison, 10-year Swiss government bonds yield less than zero. The analysts argue that solid corporate balance sheets and profitability indicate the payouts are sustainable. In fact as dividends might be more stable than profits, they say this approach is especially promising when times are uncertain. “Our strategy is based on dividend sustainability, above-average dividend growth and a relatively attractive dividend yield,” says CIO GWM. (Source: UBS, «Year Ahead», 06.12.2018) The Dow Jones Switzerland Select Dividend 15 Index™ follows an entirely suitable approach. The benchmark systematically searches the Swiss equity market for attractive dividend stocks. So far the approach has worked: the dividend strategy has clearly outperformed the SMI™ (see chart)¹. The QIX Dividenden Europe Index has a relatively short history. The benchmark has a multi-stage selection process that looks at both expected and historic dividend yields. Steadiness of distributions plays a key role.Opportunities: With Open End PERLES investors can implement the dividend strategy in Switzerland (Symbol: SWDIV) and/or across Europe (symbol: QIXEUU). The products track the Dow Jones Switzerland Select Dividend 15 Index™ and QIX Dividenden Europe Index at a ratio of 10:1 and 100:1 respectively. In line with the investment theme, investors also benefit from the distributions made by the constituents in the underlying. Any dividend payments are reflected in the index calculation.
Risks: Open End PERLES do not have capital protection. Losses will be made if the underlying index declines. The currency risk must also be taken into account, as the trading currency of some index constituents may differ from the trading currency of the certificate shown. Investors in structured products are also exposed to issuer risk, which means that the capital invested may be lost if UBS AG becomes insolvent, regardless of the performance of the underlying.
More UBS products and further information on the risks and opportunities are available at ubs.com/keyinvest.
Dow Jones Switzerland Select Dividend 15 Index™ vs. SMI™ Index (5 years, for illustrative purposes only, figures in %)

The Dow Jones Switzerland Select Dividend 15 Index™ hit an all-time high in January 2018. Although it was unable to stay at this level, it has beaten the SMI™ over five years.
Source: UBS AG, Bloomberg
As of 19.12.2018
QIX Dividenden Europa Index vs. Intel vs. STOXX™ Europe 600 Index (from 3 May 2017, for illustrative purposes only, figures in %)

The QIX Dividenden Europa Index has fallen in a weak market environment since launch. However, the rule-based strategy did slightly better than the STOXX™ Europe 600.
Source: UBS AG, Bloomberg
As of: 19.12.2018
¹) Please be aware that past performance does not indicate future results.
²) The conditions of ETTs are reviewed on a yearly basis and can be adjusted with a deadline of 13 months after the announcement.
Open End PERLES on Dow Jones Switzerland Select Dividend 15 Index™
| Symbol | SWDIV |
| SVSP Name | Tracker Certificates |
| SPVSP Code | 1300 |
| Underlying | Dow Jones Switzerland Select Dividend 15 Index™ Total Return (CHF) |
| Currency | CHF |
| Ratio | 10:1 |
| Administration fee | 0.40% p.a. |
| Expiry | Open End |
| Participation | 100% |
| Issuer | UBS AG, London |
| Bid/Ask | CHF 190.30 / 191.50 |
Open End PERLES on QIX Dividenden Europa Index (EUR)
| Symbol | QIXEUU |
| SVSP Name | Tracker Certificates |
| SPVSP Code | 1300 |
| Underlying | QIX Dividenden Europa Net Return Index (EUR) |
| Currency | EUR |
| Ratio | 100:1 |
| Administration fee | 1.50% p.a. |
| Participation |
100% |
| Expiry | Open End |
| Issuer | UBS AG, London |
| Bid/Ask | EUR 91.80 /92.10 |
More UBS products and further information on the risks and opportunities are available at ubs.com/keyinvest.
Source: UBS AG, Bloomberg
As of: 19.12.2018
Market overview
| Index | Quotation | Week¹ |
| SMI™ | 8’540.16 | -3.6% |
| SLI™ | 1’314.35 | -3.5% |
| S&P 500™ | 2’506.96 | -5.4% |
| Euro STOXX 50™ | 3’051.38 | -1.8% |
| S&P™ BRIC 40 | 3’748.10 | -3.6% |
| CMCI™ Compos. | 871.43 | -2.0% |
| Gold (troy ounce) | 1’256.40 USD | 0.5% |
¹ Change based on the closing price of the previous day compared to the closing price a week ago.
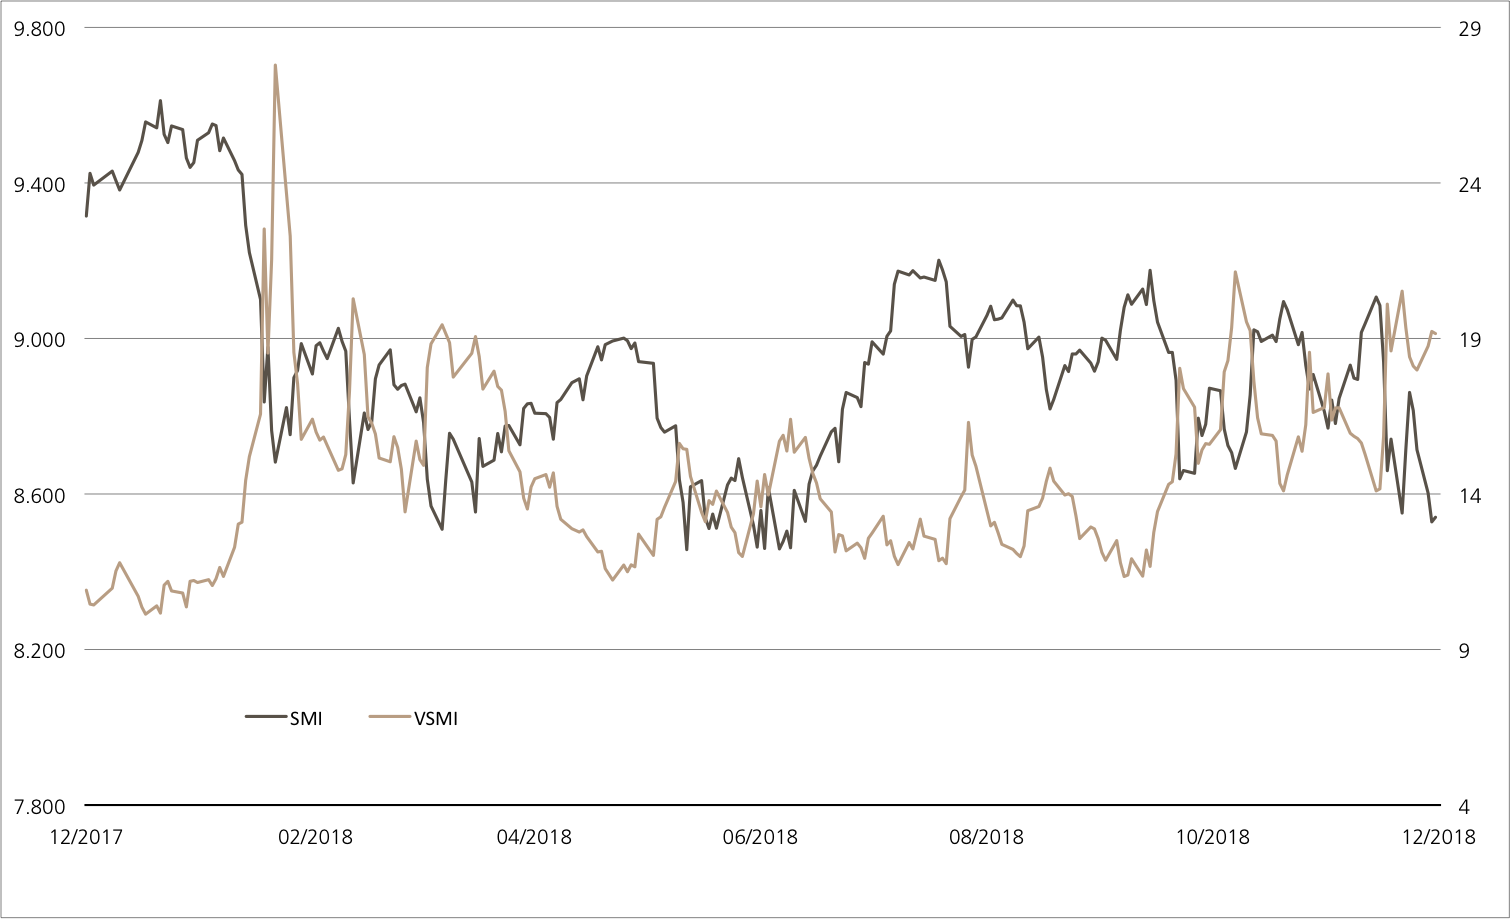
SMI™ vs. VSMI™ 1 year

The VSMI™ Index is calculated since 2005. It shows the volatility of the stocks within the SMI™ index. A portfolio which reacts only to changes in volatility instead of volatility itself is relevant for the calculation. Thereby, the VSMI™ methodology uses the squared volatility, known as variance, of the SMI options with remaining time to expiry of 30 days traded at the Eurex.
Source: UBS AG, Bloomberg
As of: 19.12.2018
Investment idea 2019 II
European Utilities
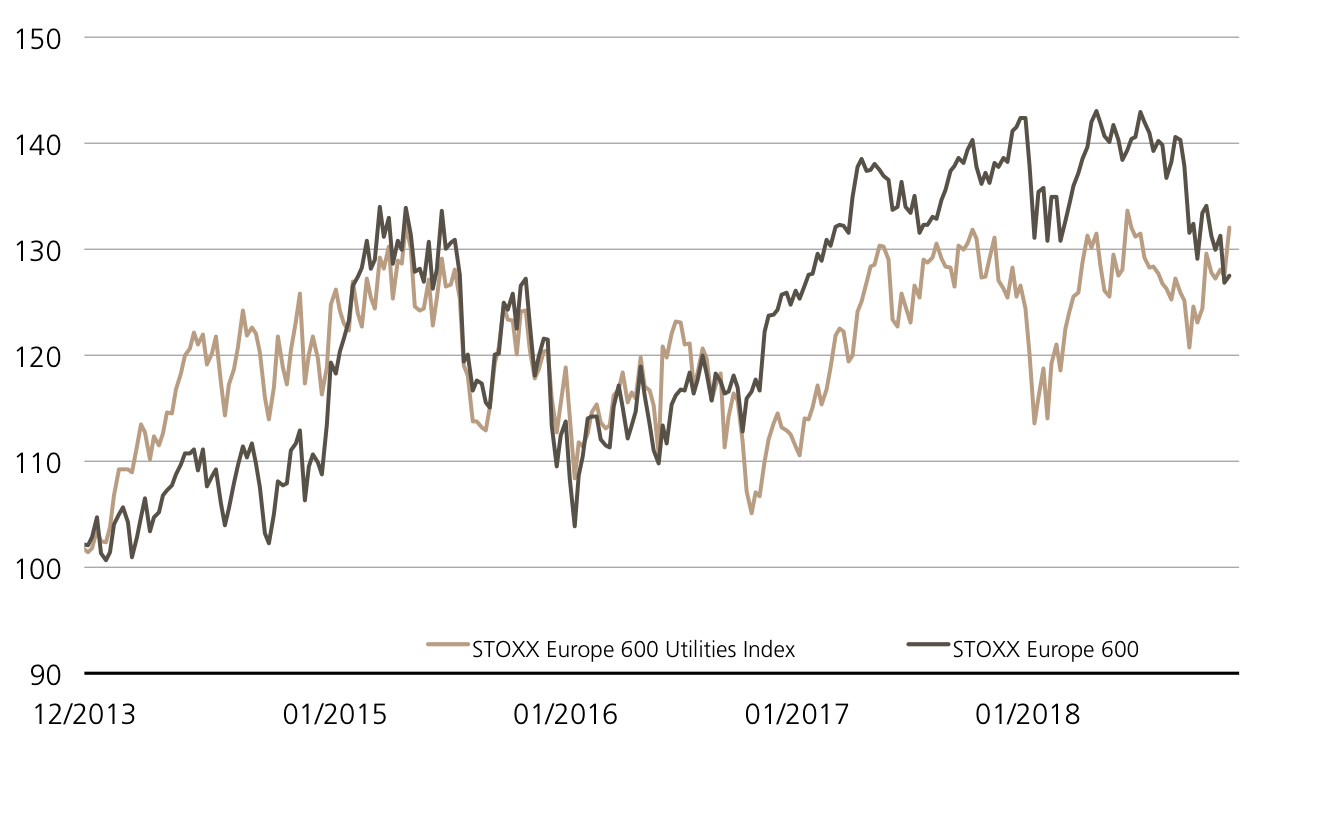
The macro-economic picture for 2019 has both light and shade. One sector that is relatively insensitive to a possible global slowdown and the ongoing trade disputes is utilities. In a chaotic year on the markets in 2018 European power companies as measured by the STOXX™ Europe 600 Utilities Index clearly outperformed the broad market.¹ UBS CIO GWM is still positive on the sector: the analysts regard valuations as attractive compared to other non-cyclical sectors such as consumer goods and healthcare. (Source: UBS CIO GWM, European Utilities, 17.12.2018) Investors can literally “electrify” their portfolio with an ETT (symbol: ETUTI) on the STOXX™ Europe 600 Utilities Net Return Index. The product currently has no ongoing management fee and also offers an attractive dividend yield.²
There are good reasons why European utilities have done well: according to UBS CIO GWM they have been driven by companies where the profit prospects benefit from rising wholesale electricity prices. In 2018, tariffs were up 20-40% in Europe. The analysts name EDF, RWE and Fortum as specific beneficiaries of this trend. (Source: UBS CIO GWM, European Utilities, 17.12.2018) When it comes to profits, Iberdrola may also score well in this regard. Operating profit was up 34% in Q3, ahead of market expectations. The Spanish utility boosted revenue by 24%. With an weighting of just under 13%, Iberdrola is currently the heavyweight in the STOXX™ Europe 600 Utilities Index. (Source: STOXX™ Index factsheet, 31.10.2018) The experts at UBS CIO GWM see political and regulatory risks for the sector in 2019, such as Brexit and potential government intervention in the sector in Italy. But the profit outlook for utilities is positive, with an estimated growth rate of 6%. (Source: UBS CIO GWM, European Utilities, 17.12.2018)
Opportunities: All the sector companies mentioned so far are constituents of the STOXX™ Europe 600 Utilities NR Index. Recently the 28 stocks in the index have moved up against a weak market environment.¹ With the ETT (symbol: ETUTI) it is possible to back a continuation of the positive price performance in this “energetic” sector. As the underlying in this case is a net return variant, dividends are reinvested in the index. The current distribution yield is an above-average 4.6%.
Risks: This product does not have capital protection. Should the underlying assets deliver a negative performance, the ETT will incur commensurate losses. Investors in structured products are also exposed to issuer risk, which means that the invested capital may be lost if UBS AG becomes insolvent, regardless of the performance of the underlying.
More UBS products and further information on the risks and opportunities are available at ubs.com/keyinvest.
STOXX™ Europe 600 Utilities Index vs. STOXX™ Europe 600 Index (5 years, for illustrative purposes only, figures in %)

Source: UBS AG, Bloomberg
As of: 19.12.2018
ETT on STOXX™ Europe 600 Utilities Net Return Index
| Symbol | ETUTI |
| SVSP Name | Tracker Certifikates |
| SPVSP Code | 1300 |
| Underlyings | STOXX™ Europe 600 Utilities Net Return Index |
| Currency | EUR |
| Ratio | 1:1 |
| Administration fee | 0.00% p.a.² |
| Participation | 100% |
| Expiry | Open End |
| Issuer | UBS AG, London |
| Bid/Ask | EUR 826.50 / 831.00 |
More UBS products and further information on the risks and opportunities are available at ubs.com/keyinvest.
Source: UBS AG, Bloomberg
As of: 19.12.2018
¹) Please be aware that past performance does not indicate future results.
²) The conditions of ETTs are reviewed on a yearly basis and can be adjusted with a deadline of 13 months after the announcement.