Weekly Hits: Food sector, Temenos & SAP
Friday, 22.02.2019

- Topic 1: Food sector - Acquiring a taste for more
- Topic 2: Temenos/SAP - Fast-growing software duo
Food sector
Acquiring a taste for more
In 2018, Nestlé generated organic revenue growth of 3%, in line with the target. According to the reported figures, not only the share of the world’s largest food company climbed to an all-time high. The STOXX™ Europe 600 Food & Beverage Index also reached a historic best in the wake of the industry giant.¹ An ETT (symbol: ETFOO) replicates the benchmark of 24 European food and beverage manufacturers. Last summer Nestlé, along with Barry Callebaut and EMMI, was selected as the underlying for an Early Redemption (ER) Kick-In GOAL (symbol: KCAODU). With this product, investors can add a return opportunity of 6.7% p.a. to their portfolio. Even the current worst performer, EMMI, has a comfortable distance to the barrier of 38.8%.
«Growth has picked up in our two largest markets, the U.S. and China, as well as in infant nutrition,» explained Nestlé CEO Mark Schneider. At the same time, he stressed that the Group had «made significant progress» with its realignment. The profit grew disproportionately, not least thanks to one-off effects from the saleof business units: Below the line, Nestlé earned CHF 10.1 billion in 2018, 41.6% more than in the previous year. Shareholders are to participate with a dividend that increased by 10 centimes to CHF 2.45 per share certificate. Schneider is anticipating a further acceleration in growth for 2019. At the same time, he wants to improve the margin, profit and capital efficiency. (Source: Nestlé, media release, February 14, 2019)
According to UBS CIO GWM, the food company has achieved a turnaround in 2018 after six years of declining growth. For the current period, analysts already believe that the industry giant will generate organic sales growth of 3.6%. CIO GWM continues to rate the large cap as a «buy» and raised its price target to CHF 100. (Source: UBS CIO GWM, Nestlé, February 18, 2019) A few days after Nestlé, Danone corroborated the upturn in the food industry. On a comparable basis, the dairy group reported sales growth of 2.9% in 2018, which exceeded expectations. For 2019, the French company forecasts a growth in sales of around 3%. (Source: Thomson Reuters, media release, February 19, 2019) EMMI’s latest figures fit the latest world’s largest yogurt producer’s expectations : On January 30, 2019, the domestic milk processor reported organic (currency- and acquisition-adjusted) revenue growth of 2.3% for last year. According to the company, this was the highest increase since 2014.Opportunities: Investors who have acquired a taste for the food industry can position themselves in the European food sector in an easy and diversified manner with the ETT (symbol: ETFOO) on the STOXX™ Europe 600 Food & Beverage Index. There are typically no ongoing fees for this product structure.² EMMI is not included in this benchmark.- The mid cap however, together with Nestlé and chocolate specialist Barry Callebaut, provides an attractive yield opportunity of 6.7% p.a. for the ER Kick-In GOAL (Symbol: KCAODU). Although EMMI exhibits the weakest price trend of the three compared to when shares were issued, the share has a distance to the barrier of 38.8%. Once all three underlyings are quoted at or above the starting level on an observation date, the early redemption will take place and the issuer will repay the full nominal and pro-rata coupon early.
Risks: The aforementioned products do not have capital protection. Should the underlying assets deliver a negative performance, the ETT will incur commensurate losses. If one of the underlyings in a Worst of Kick-In GOAL touches or falls below the respective kick-in level (barrier) and the early redemption feature does not apply, repayment at maturity may be in cash, reflecting the weakest performance of the trio from strike (but no more than nominal value plus coupon). In this case, it is likely that losses will be incurred. Investors in structured products are also exposed to issuer risk, which means that the invested capital may be lost if UBS AG becomes insolvent, regardless of the performance of the underlying.
More UBS products and further information on the risks and opportunities are available at ubs.com/keyinvest.
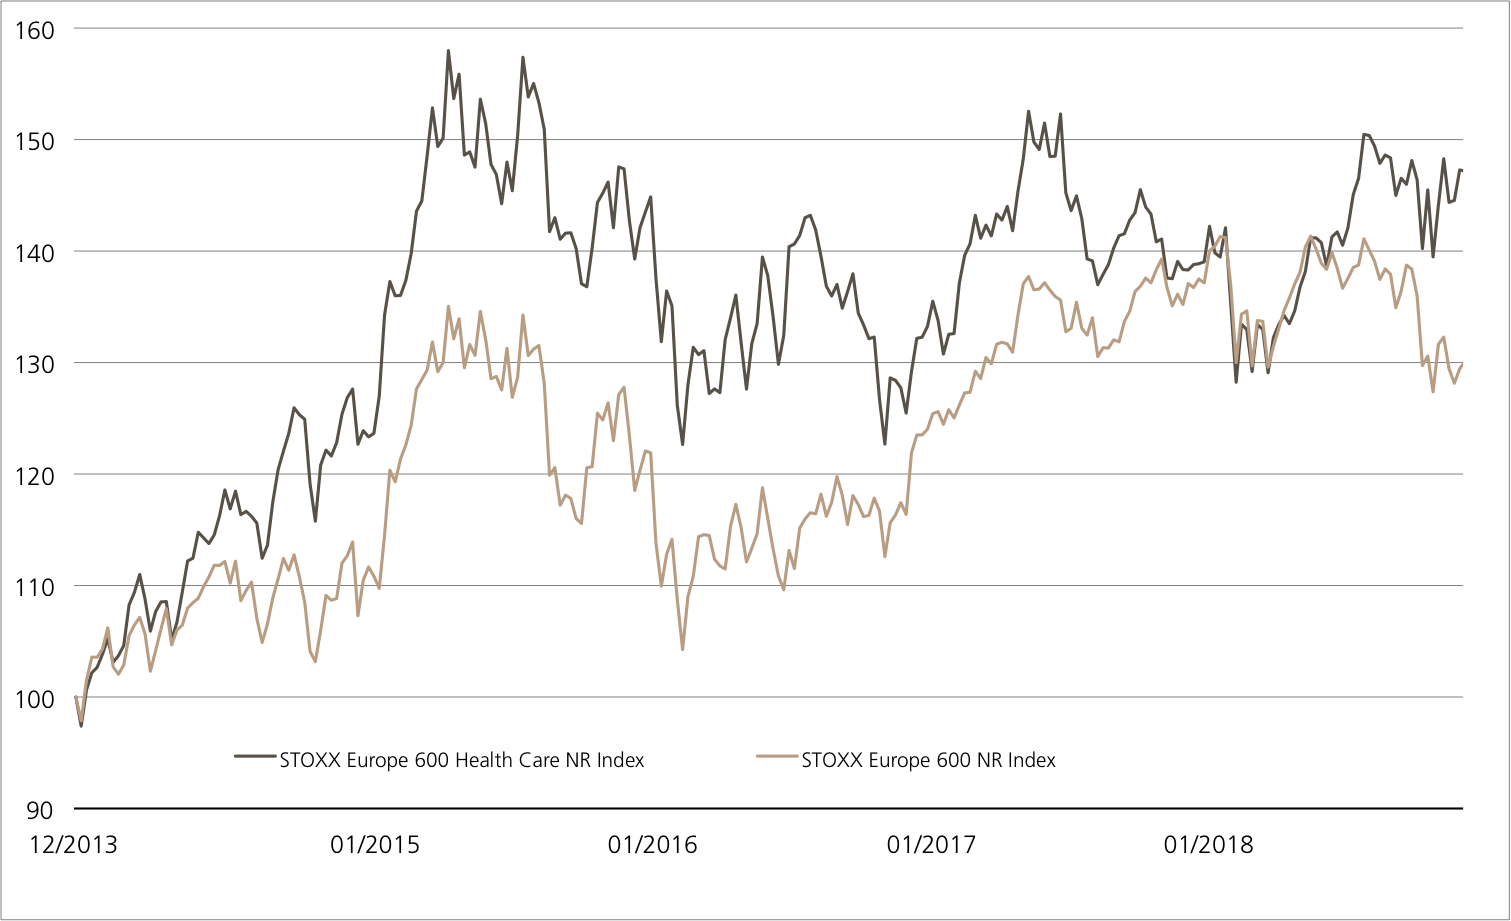
STOXX™ Europe 600 Food & Beverages Index vs. STOXX™ Europe 600 Index
(five years, for illustrative purposes only, figures in %)¹
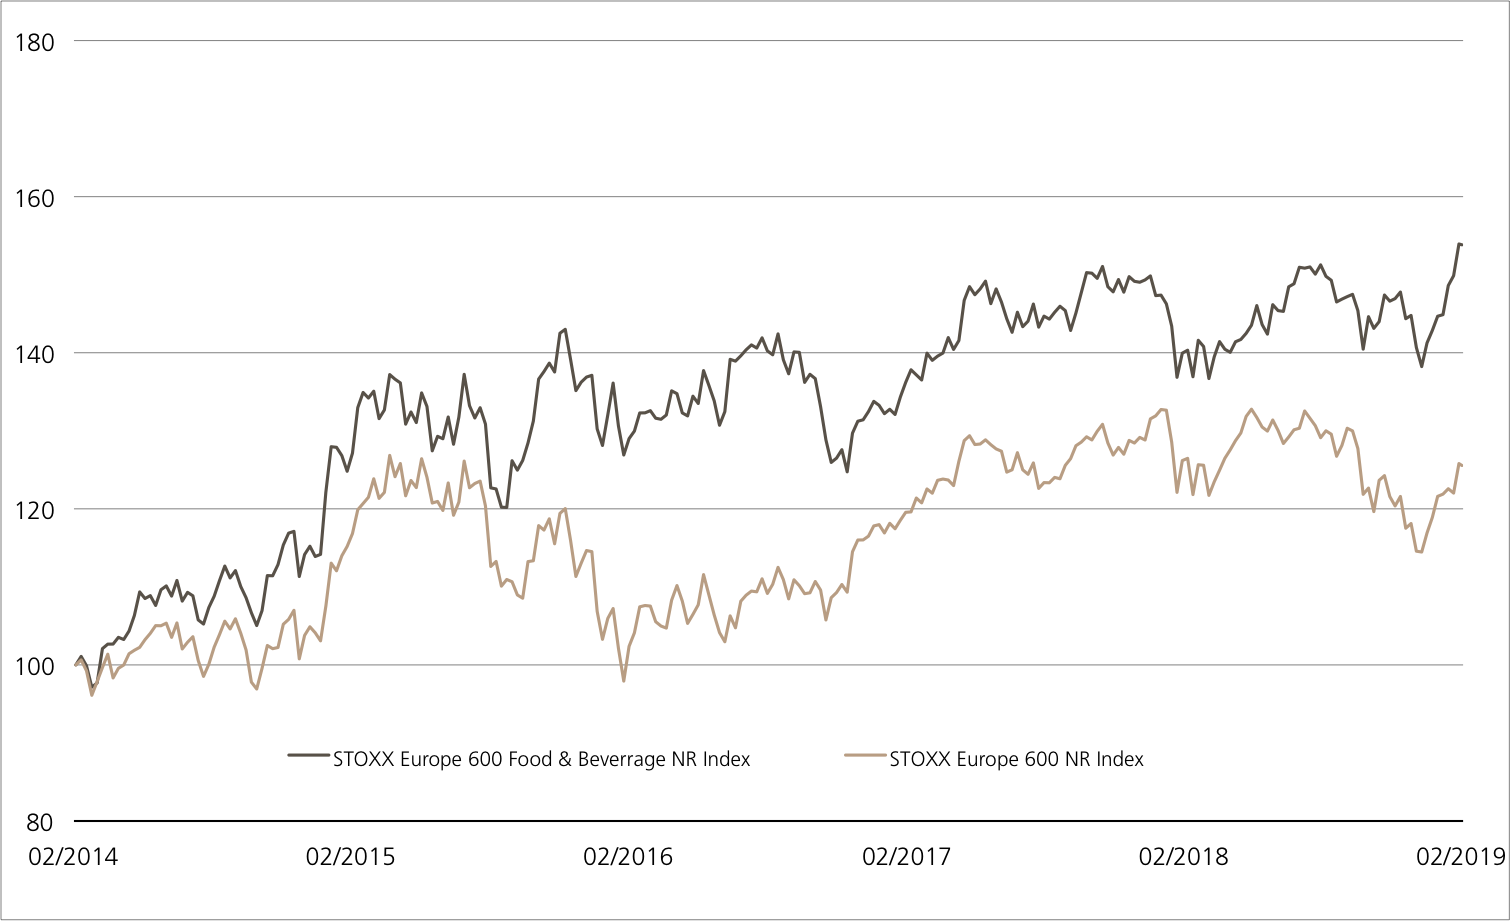
With the recent all-time high, the STOXX™ Europe 600 Food & Beverages Index set out to break out of a sideways movement that had been observed for almost two years.
Source: UBS AG, Bloomberg
As of 20.02.2019
Barry Callebaut vs. EMMI vs. Nestlé
(five years, for illustrative purposes only, figures in %)¹
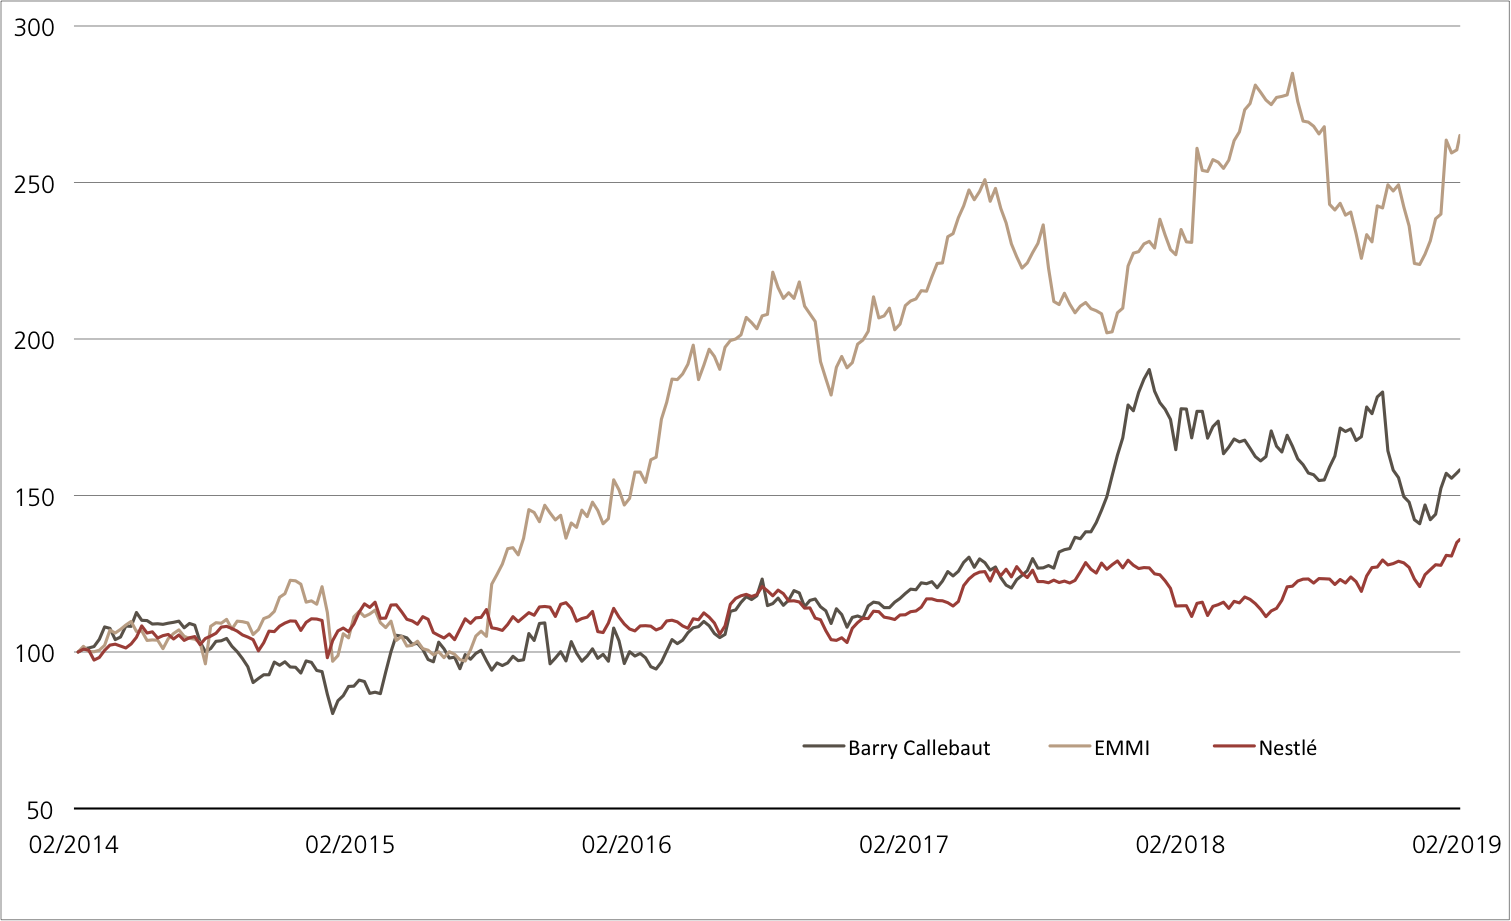
EMMI outperformed the two large caps over a period of five years. While both the milk processor and Barry Callebaut showed marked swings, Nestlé exhibited a relatively stable upward trend.
Source: UBS AG, Bloomberg
As of: 20.02.2019
¹) Please be aware that past performance does not indicate future results.
²) The conditions of ETTs are reviewed on a yearly basis and can be adjusted with a deadline of 13 months after the announcement.
ETT on STOXX™ Europe 600 Food & Beverages NR Index
| Symbol | ETFOO |
| SVSP Name | Tracker Certificates |
| SPVSP Code | 1300 |
| Underlying | STOXX™ Europe 600 Food & Beverages Net Return Index |
| Currency | EUR |
| Ratio | 1:1 |
| Administration fee | 0.00% p.a.² |
| Expiry | Open End |
| Participation | 100% |
| Issuer | UBS AG, London |
| Bid/Ask | EUR 1’291.00 / 1’298.00 |
5.00% p.a. Early Redemption Kick-In GOAL on Barry Callebaut / EMMI AG / Nestlé
| Symbol | KCAODU |
| SVSP Name | Barrier Reverse Convertible |
| SPVSP Code | 1230 (Auto-Callable) |
| Underlying | Barry Callebaut / EMMI AG / Nestlé |
| Currency | CHF |
| Coupon | 5.00% p.a. |
| Sideways return | 13.03% (6.47% p.a.) |
| Kick-In Level (Distance) | Barry Callebaut: CHF 1’041.00 (40.14%) EMMI AG: CHF 490.50 (39.52%) Nestlé: CHF 47.94 (47.04%) |
| Expiry | 26.01.2021 |
| Issuer | UBS AG, London |
| Bid/Ask | 96.10% / 97.10% |
More UBS products and further information on the risks and opportunities are available at ubs.com/keyinvest.
Source: UBS AG, Bloomberg
As of: 20.02.2019
Market overview
| Index | Quotation | Week¹ |
| SMI™ | 9’315.63 Pt. | 1.7% |
| SLI™ | 1’433.77 Pt. | 1.2% |
| S&P 500™ | 2’284.70 Pt. | 1.2% |
| Euro STOXX 50™ | 3’259.49 Pt. | 1.8% |
| S&P™ BRIC 40 | 4’180.10 Pt. | 0.0% |
| CMCI™ Compos. | 928.80 Pt. | 2.6% |
| Gold (troy ounce) | 1’347.90 USD | 2.5% |
¹ Change based on the closing price of the previous day compared to the closing price a week ago.
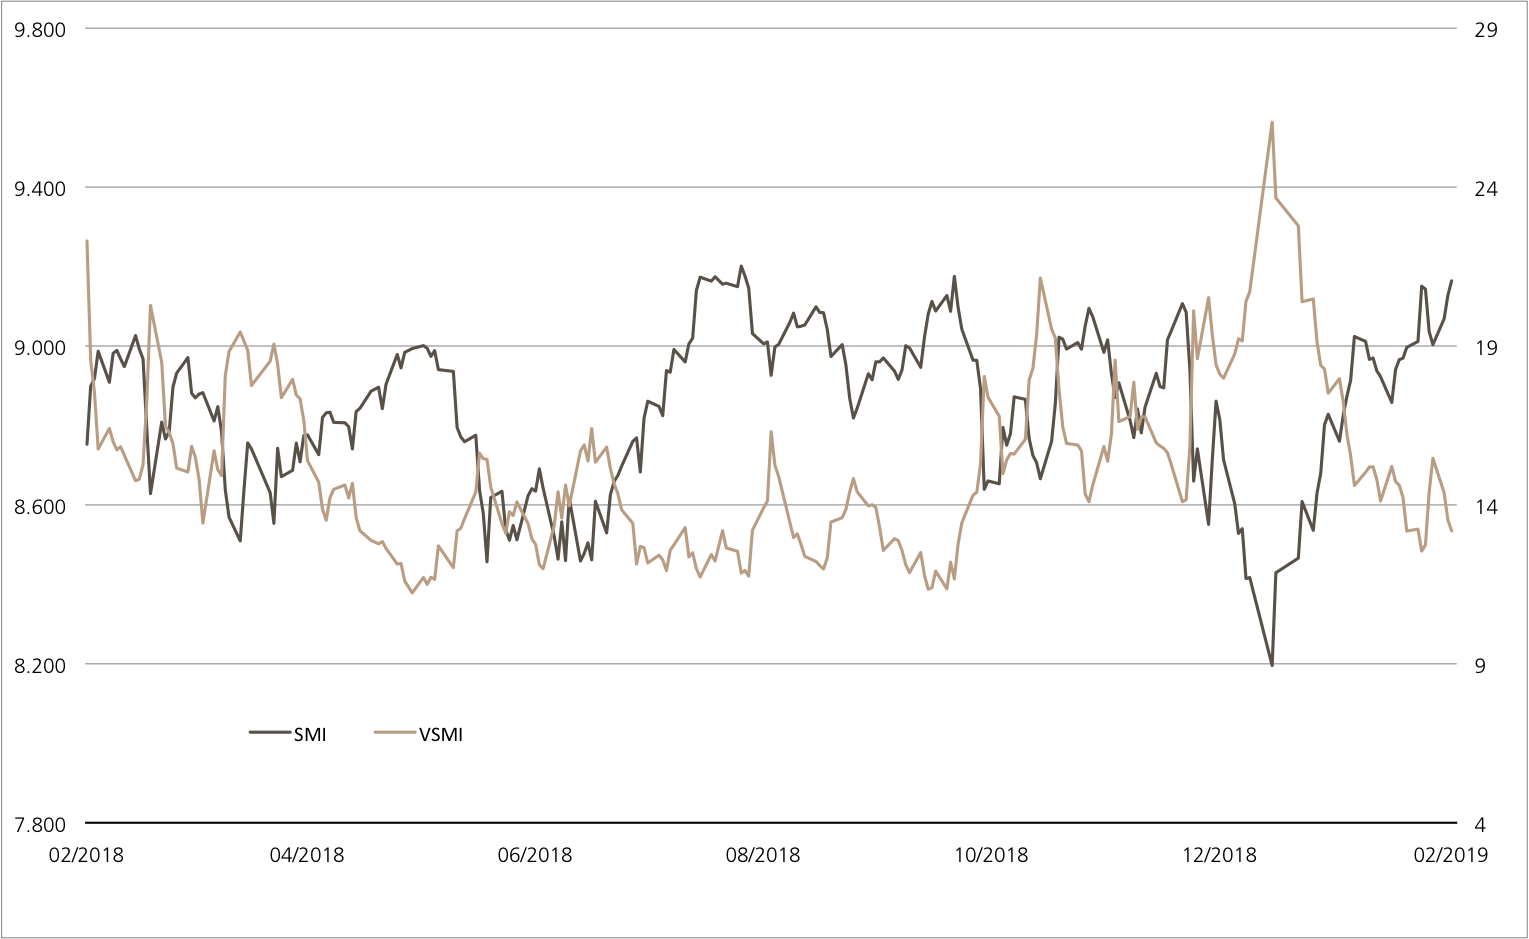
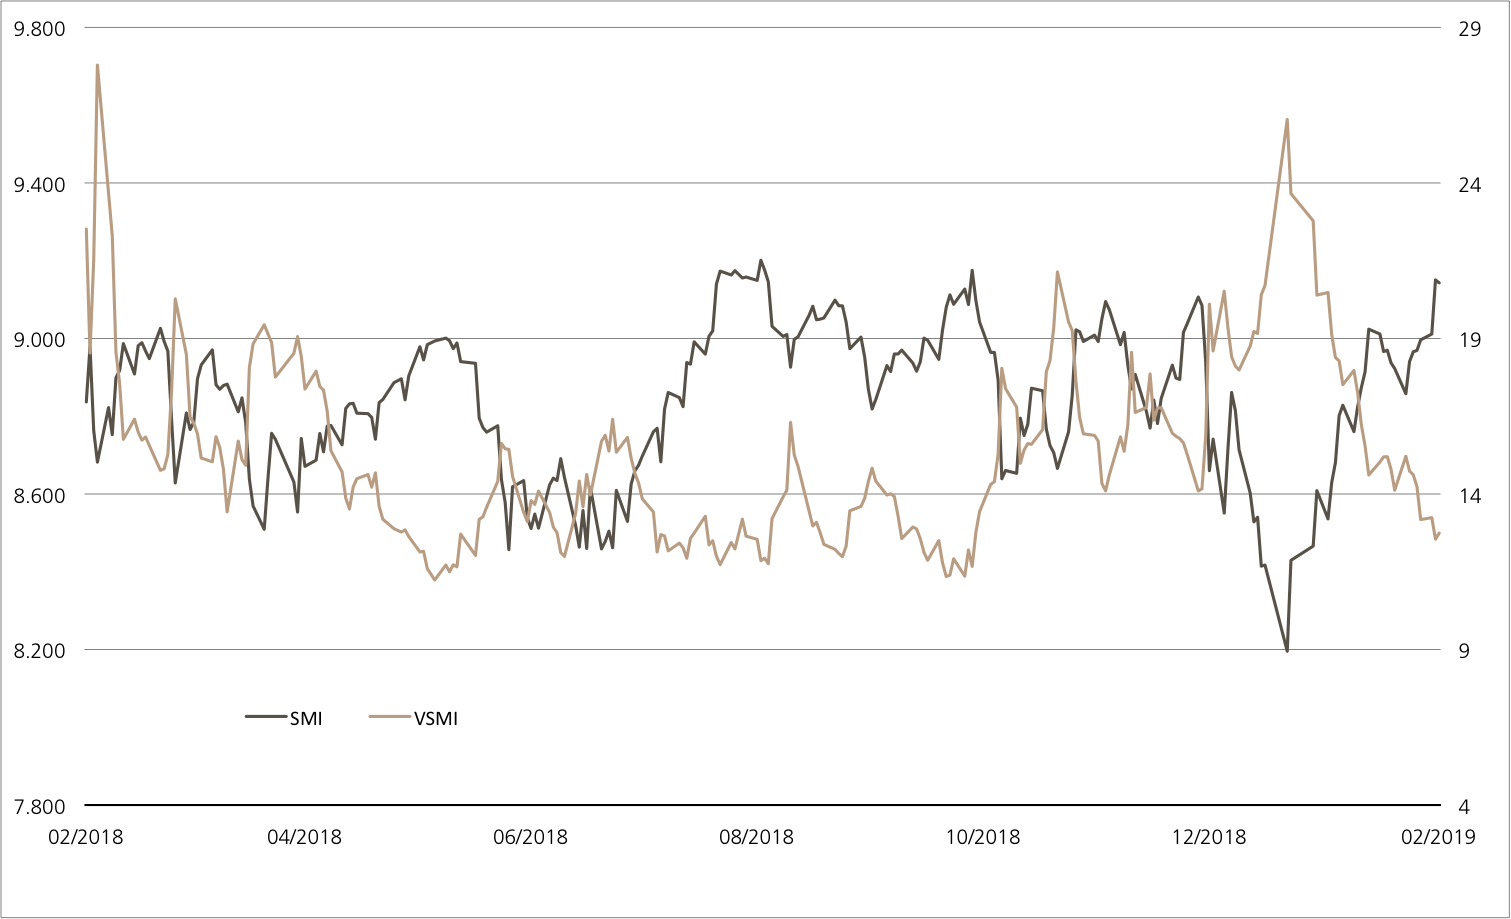
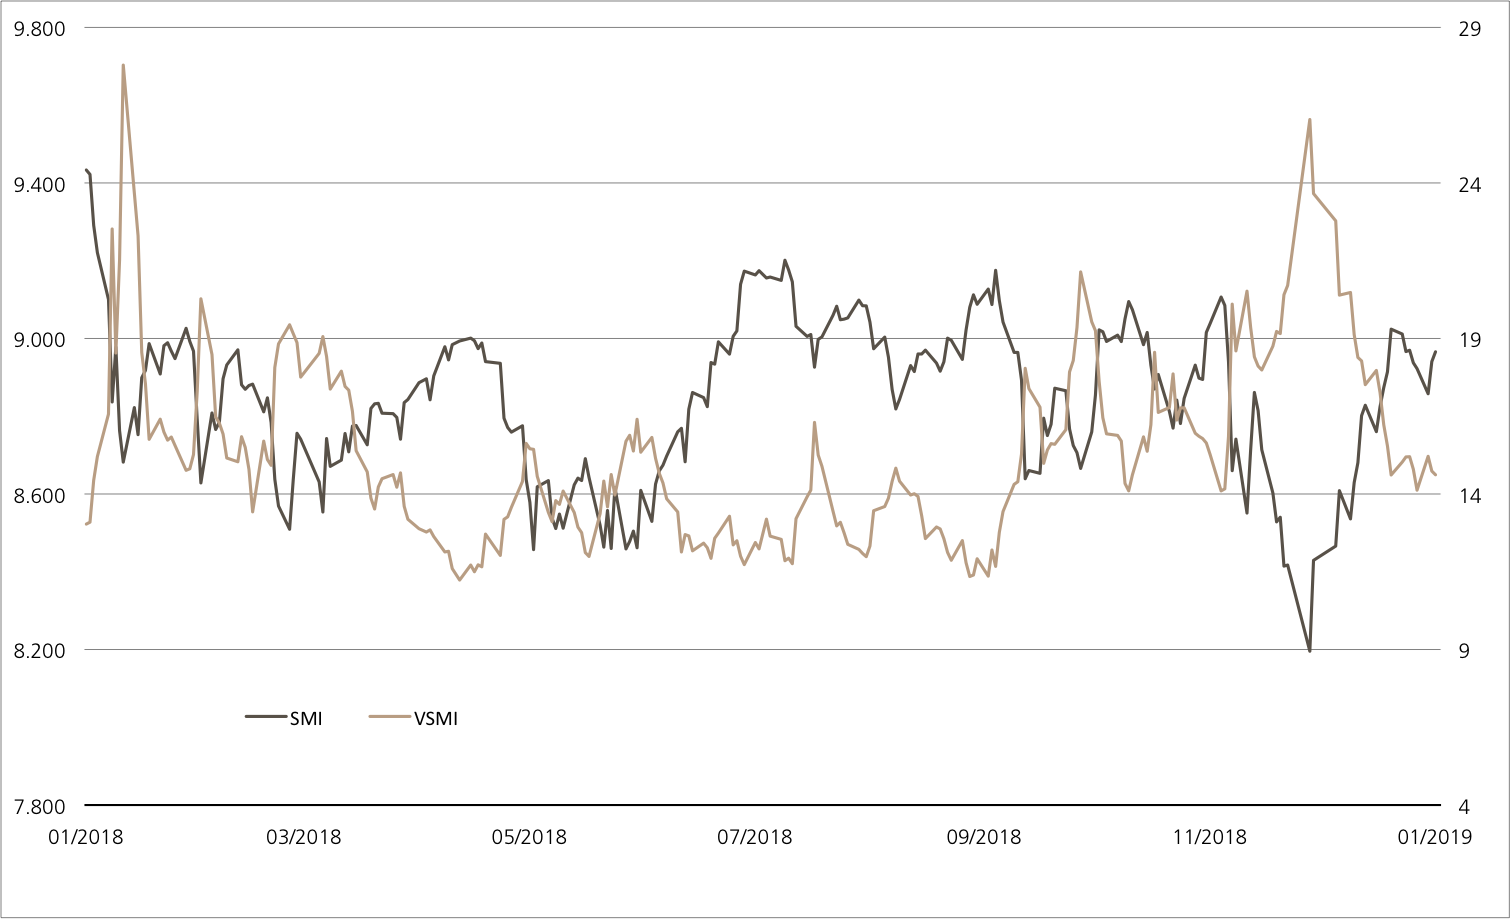
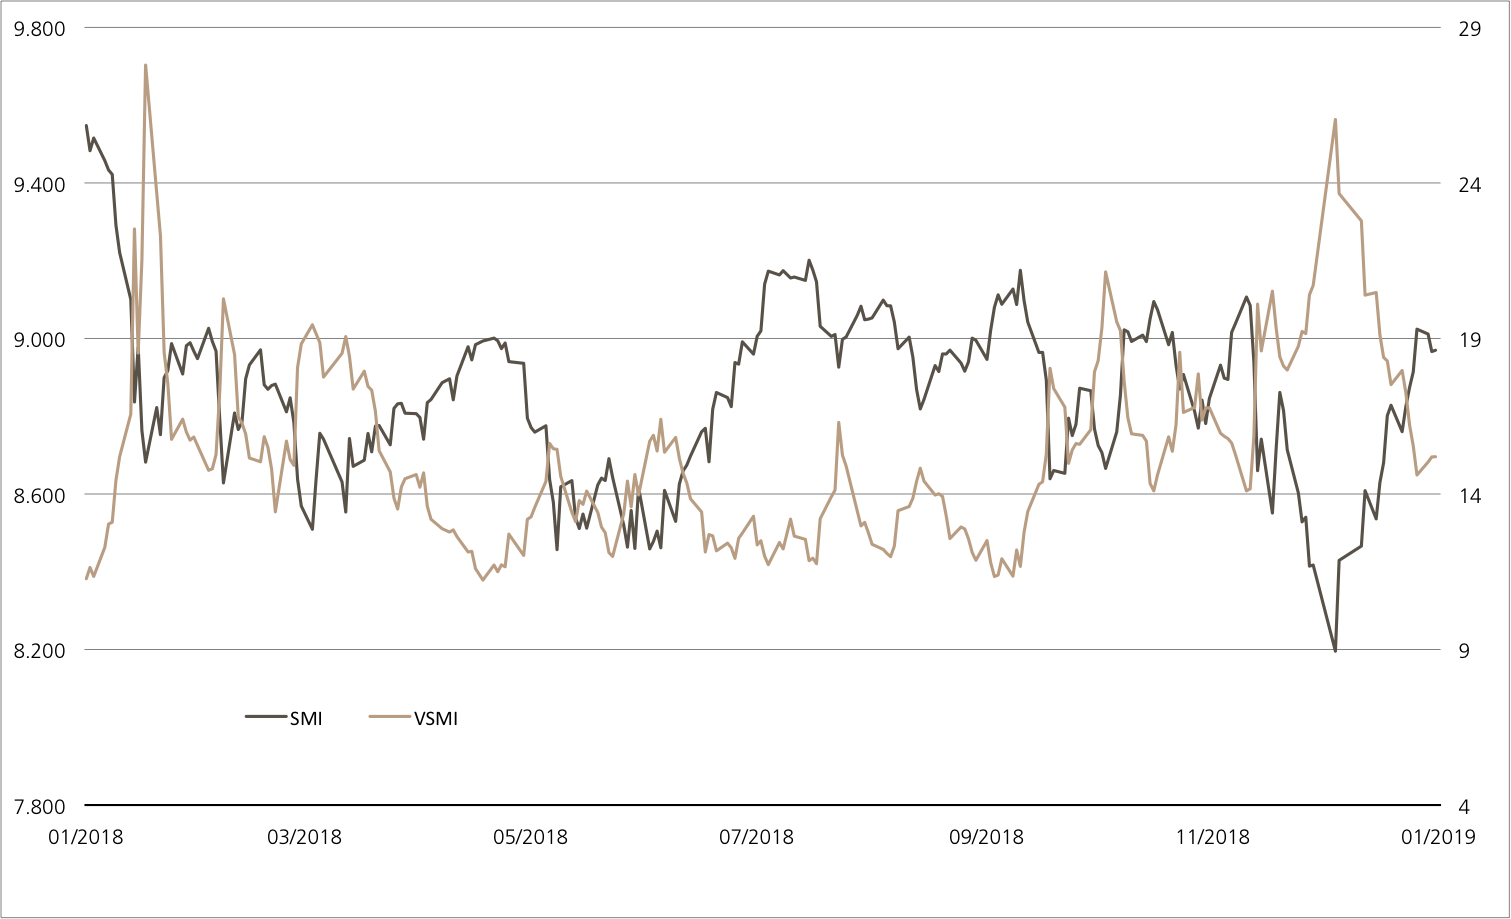
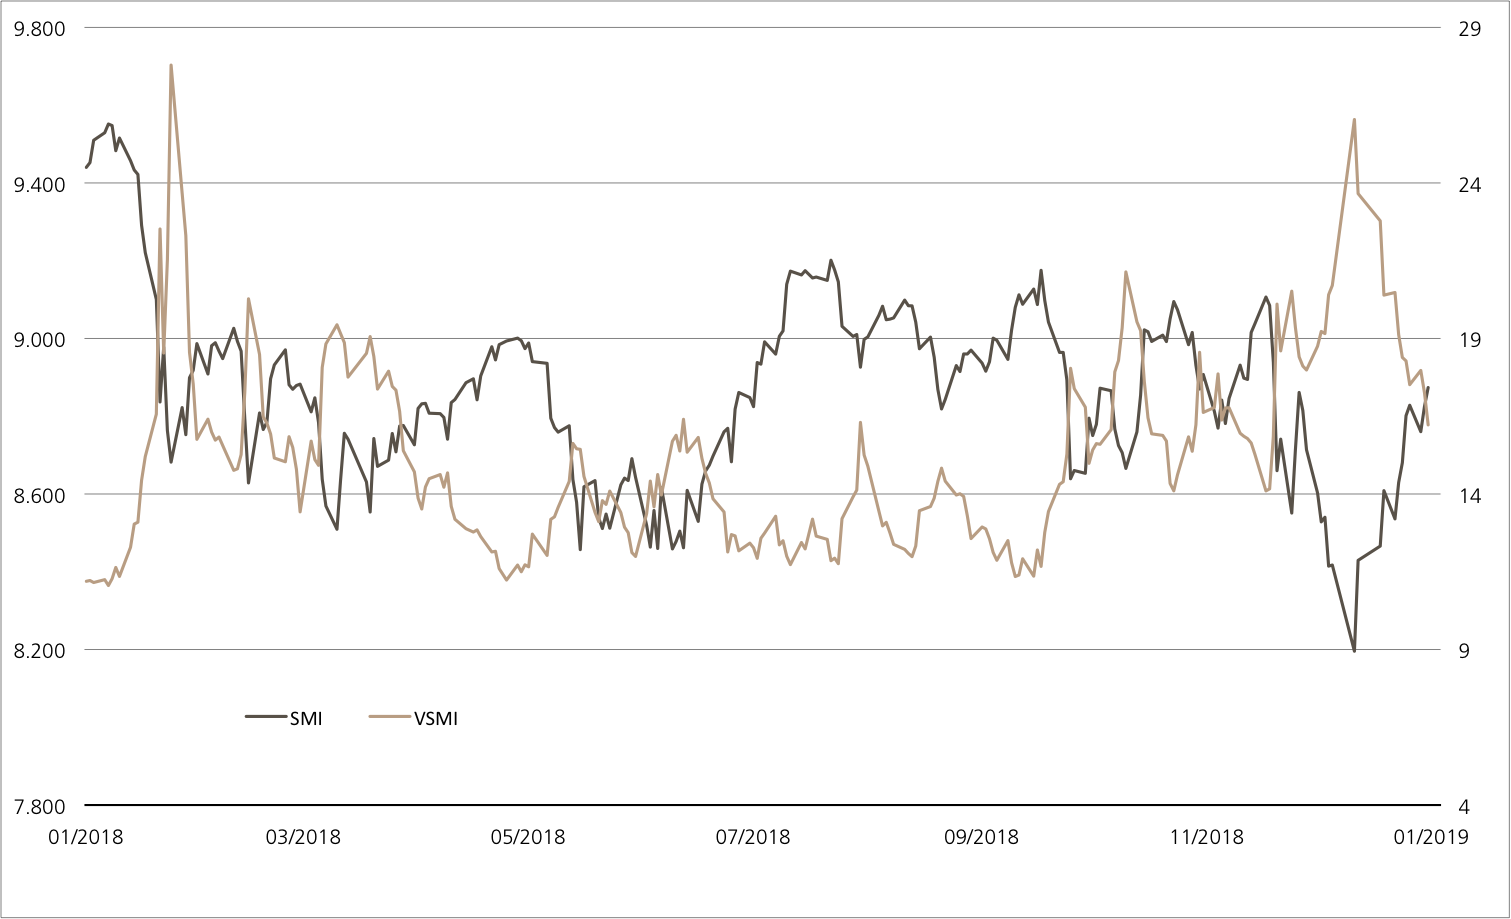
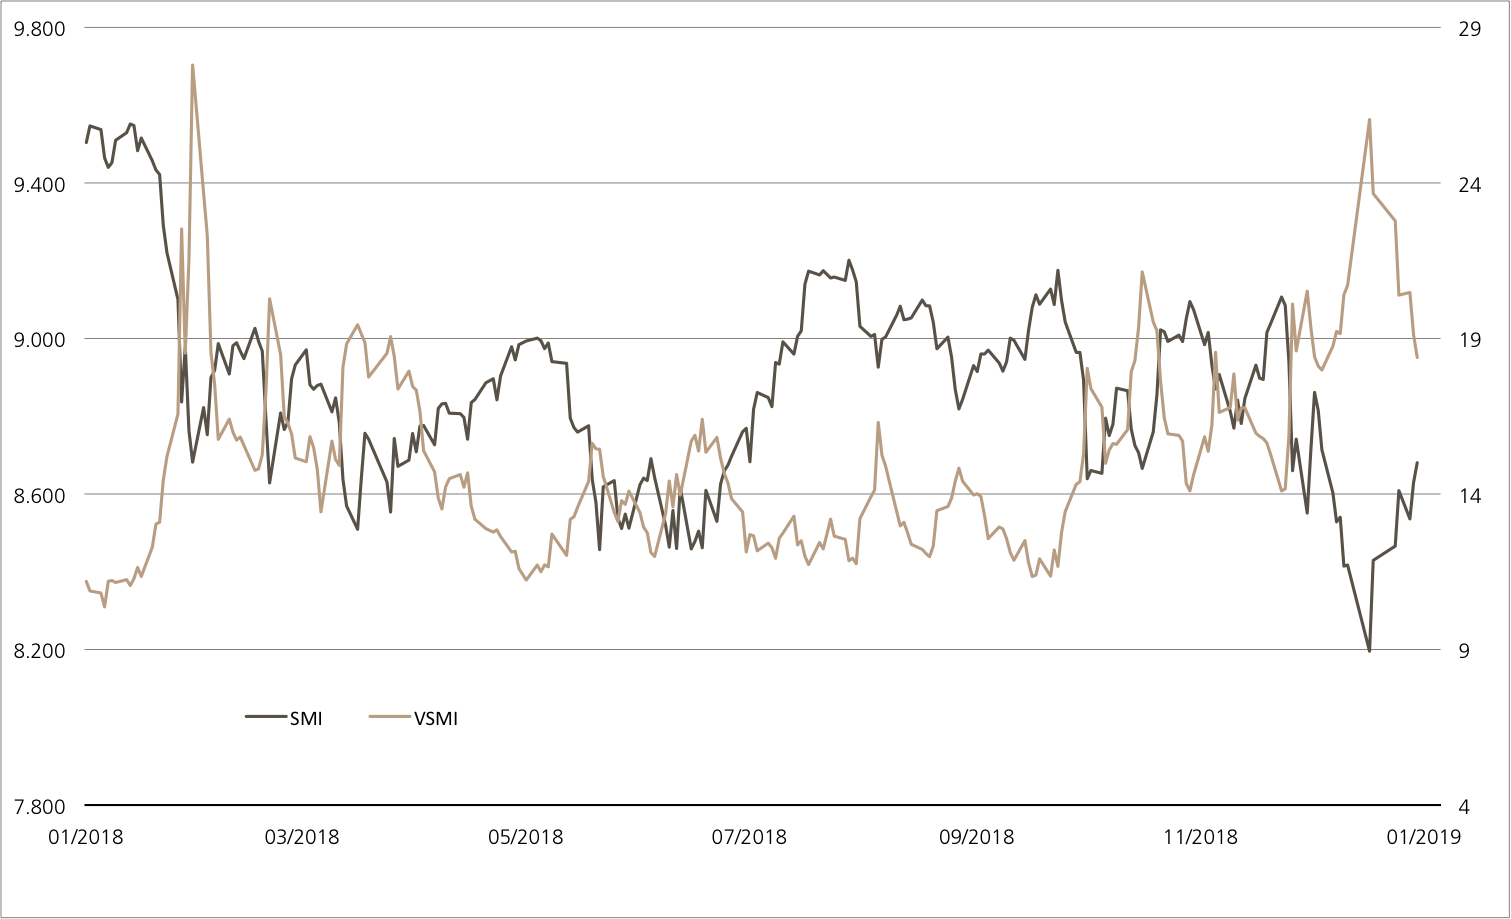
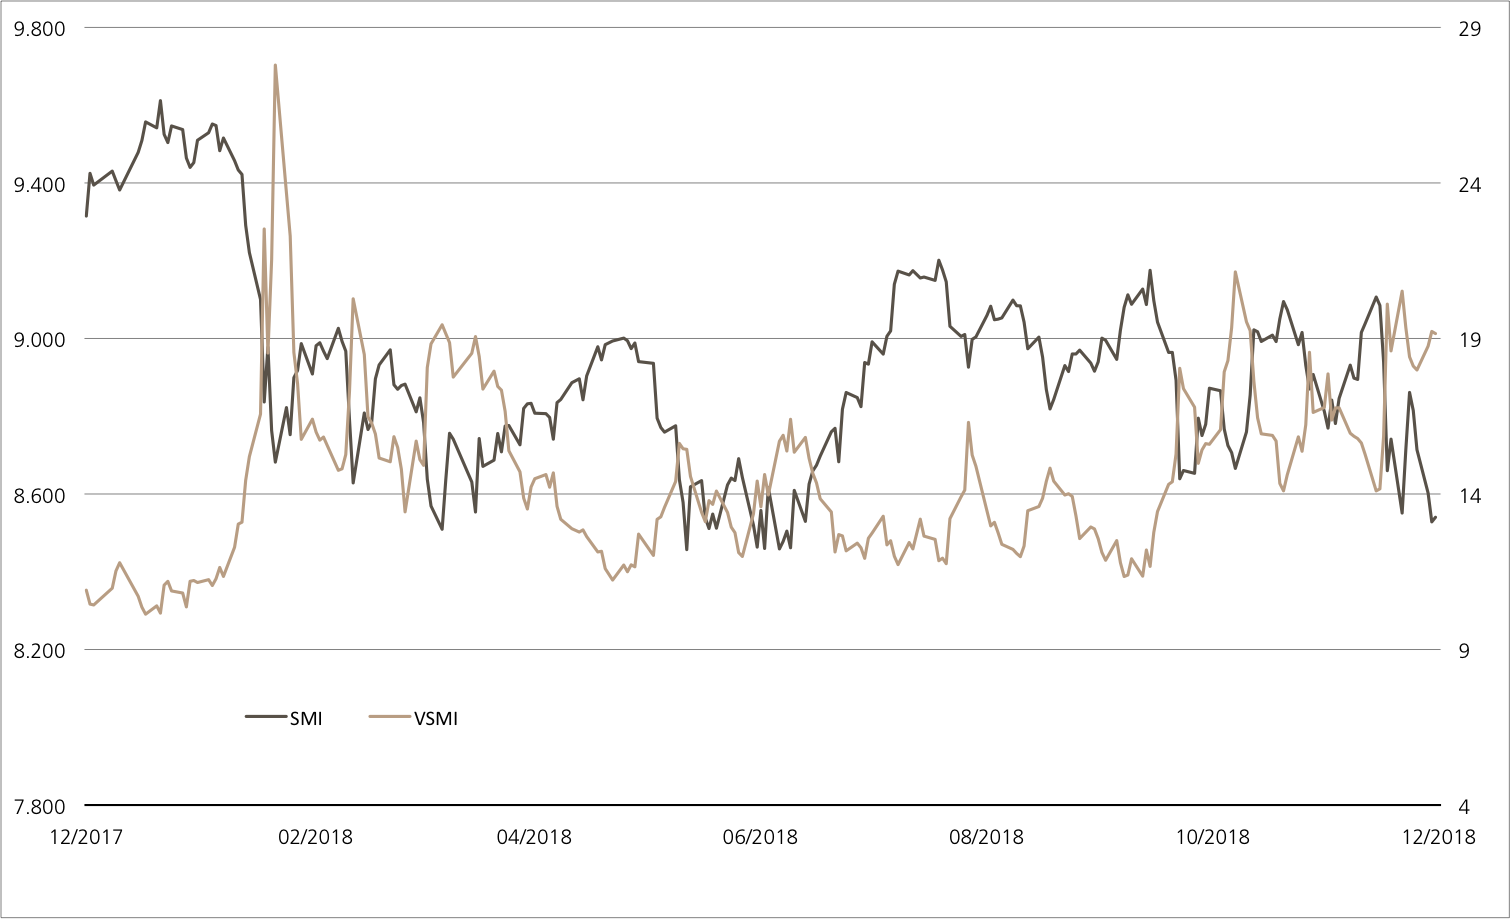
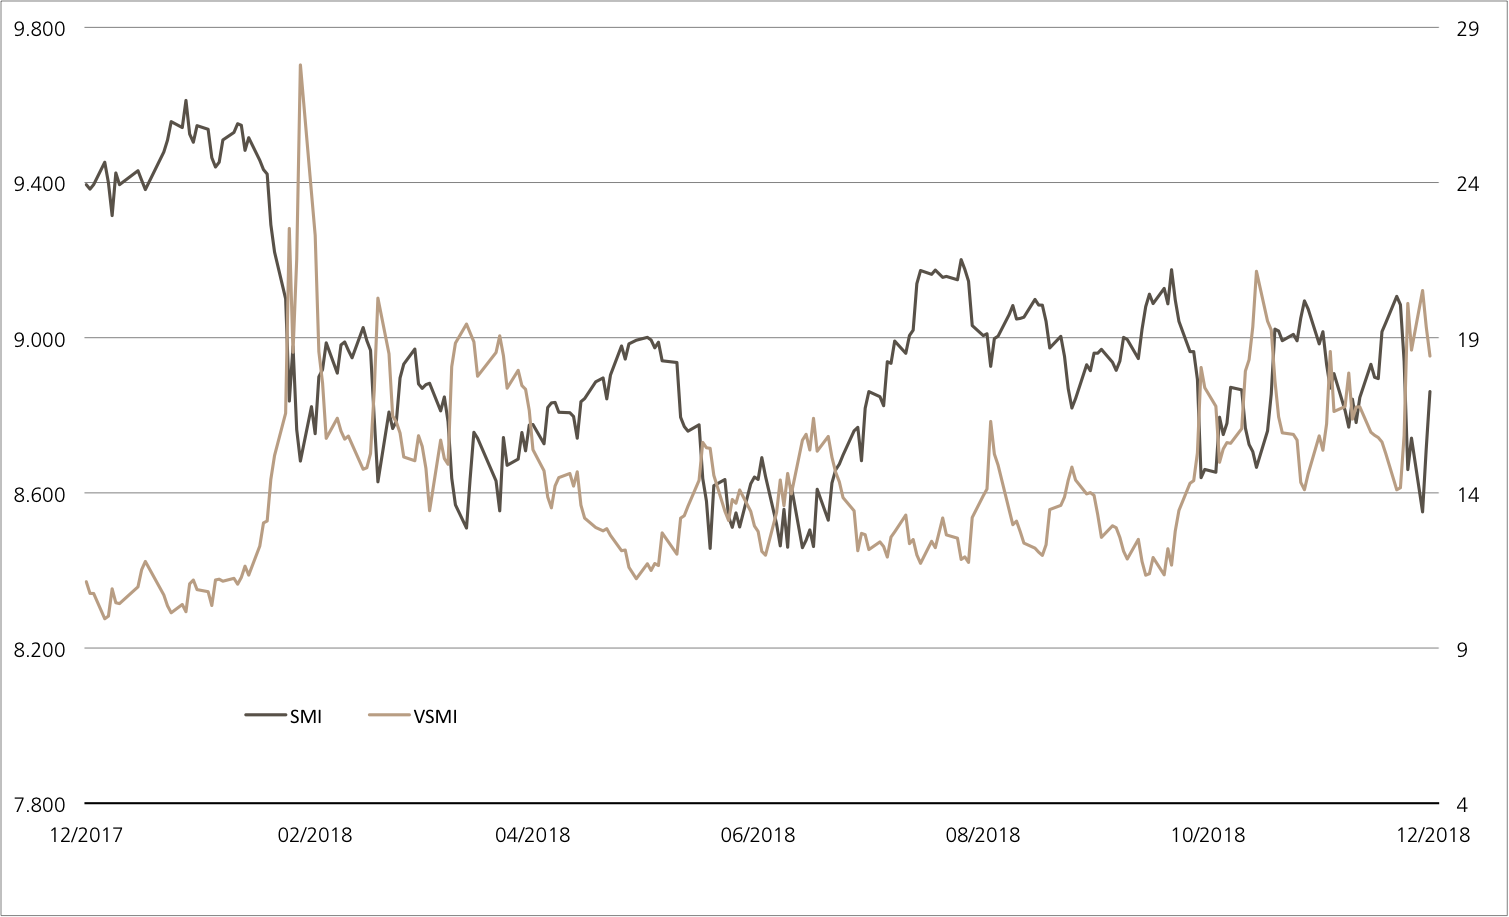
SMI™ vs. VSMI™ 1 year
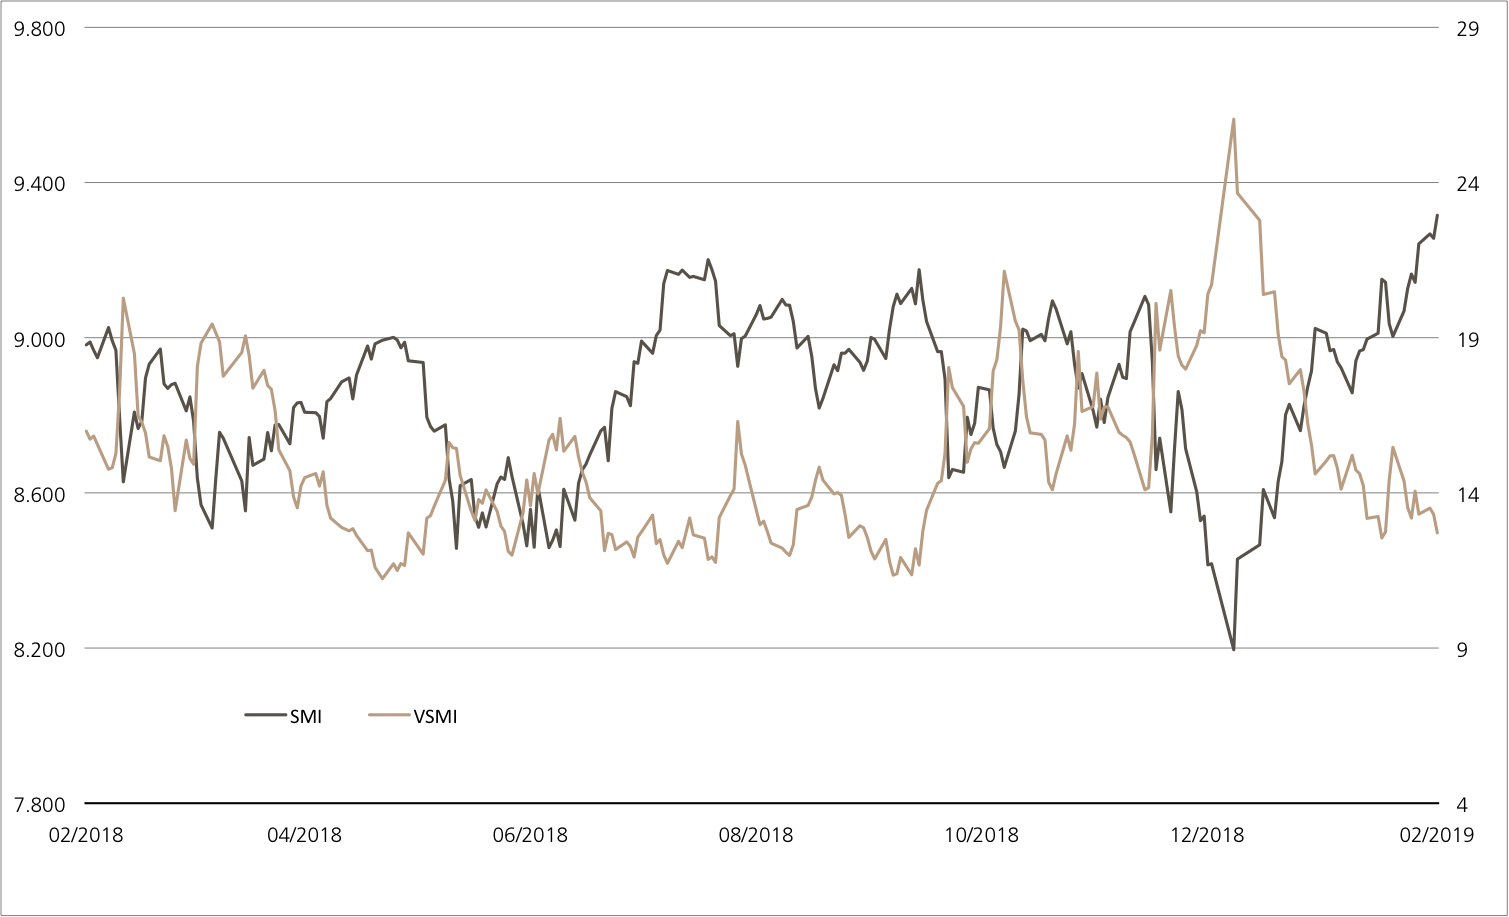
The VSMI™ Index is calculated since 2005. It shows the volatility of the stocks within the SMI™ index. A portfolio which reacts only to changes in volatility instead of volatility itself is relevant for the calculation. Thereby, the VSMI™ methodology uses the squared volatility, known as variance, of the SMI options with remaining time to expiry of 30 days traded at the Eurex.
Source: UBS AG, Bloomberg
As of: 20.02.2019
Temenos/SAP
Fast-growing software duo
When it comes to software, it has been impossible to avoid the cloud for some time now. There is an ever-increasing demand for outsourcing data and software to the Internet. As a result, SAP expanded its cloud business by 32% to EUR 4.99 billion in 2018. The fact that this growth will continue is underscored by the «new cloud bookings» figure, which rose by 25%. Temenos’s programs have also been well received. The company launched a core banking system in the cloud for the first time in 2011. The banking software specialist increased its software license revenues by 21% last year. In order to maintain the momentum, the company, based in French-speaking Switzerland,launched two new cloud products at the beginning of the year: Temenos Infinity and Temenos T24 Transact. The Kick-In GOAL (symbol: KDEADU) available for subscription brings SAP and Temenos together as underlying values. With a risk buffer of 40%, the duo offers a return opportunity of 6.00% p.a.
Not only are the software companies excelling on the sales side, they are also both generating high profits. SAP’s operating margin was 29% in 2018 and profitability is expected to increase even further. At Capital Markets Day in New York, Chief Financial Officer Luka Mucic held out the prospect of an improvement in margins year over year. An improved revenue mix in particular should lead to greater profitability. For example, Mucic wants to improve the gross margin in the cloud business from the current 63% to 71% by 2020. (Source: Finanzen.net, media report, February 7, 2018)
Temenos is also expected to continue its upward trend. The former COO and CFO Max Chuard, who will take over the leadership at the banking software manufacturer on March 1, wants to continue the successful strategy of his predecessor David Arnott. In the medium term, the company anticipates an annual increase in business volume of 10-15%. Profitability is also expected to improve by 100 to 150 basis points p.a. In 2018, the EBIT margin increased by one percentage point to 31.5%. (Source: Temenos, media release, February 12, 2019)Opportunities: Since the beginning of the year, SAP and Temenos shares have significantly outperformed the market as a whole. For example, the Swiss mid cap has gained 21% since December 31.¹ Further price premiums are not necessary for the Kick-In GOAL (symbol: KDEADU) in subscription. The product offers a maximum return of 6.00% p.a. This is subject to the condition that none of the underlyings touches or falls below the barrier fixed at 60% of the starting values within the 18-month term.
Risks: Kick-In GOALs do not have capital protection. If the underlyings equal or fall below the respective kick-in level (barrier), the amount repaid on the date of maturity may be in cash, reflecting the worst performance of the two shares (but not more than nominal value plus coupon). In this case, it is likely that losses will be incurred. Investors in structured products are also exposed to issuer risk, which means that the capital invested may be lost if UBS AG becomes insolvent, regardless of the performance of the underlying.
More UBS products and further information on the risks and opportunities are available at ubs.com/keyinvest.
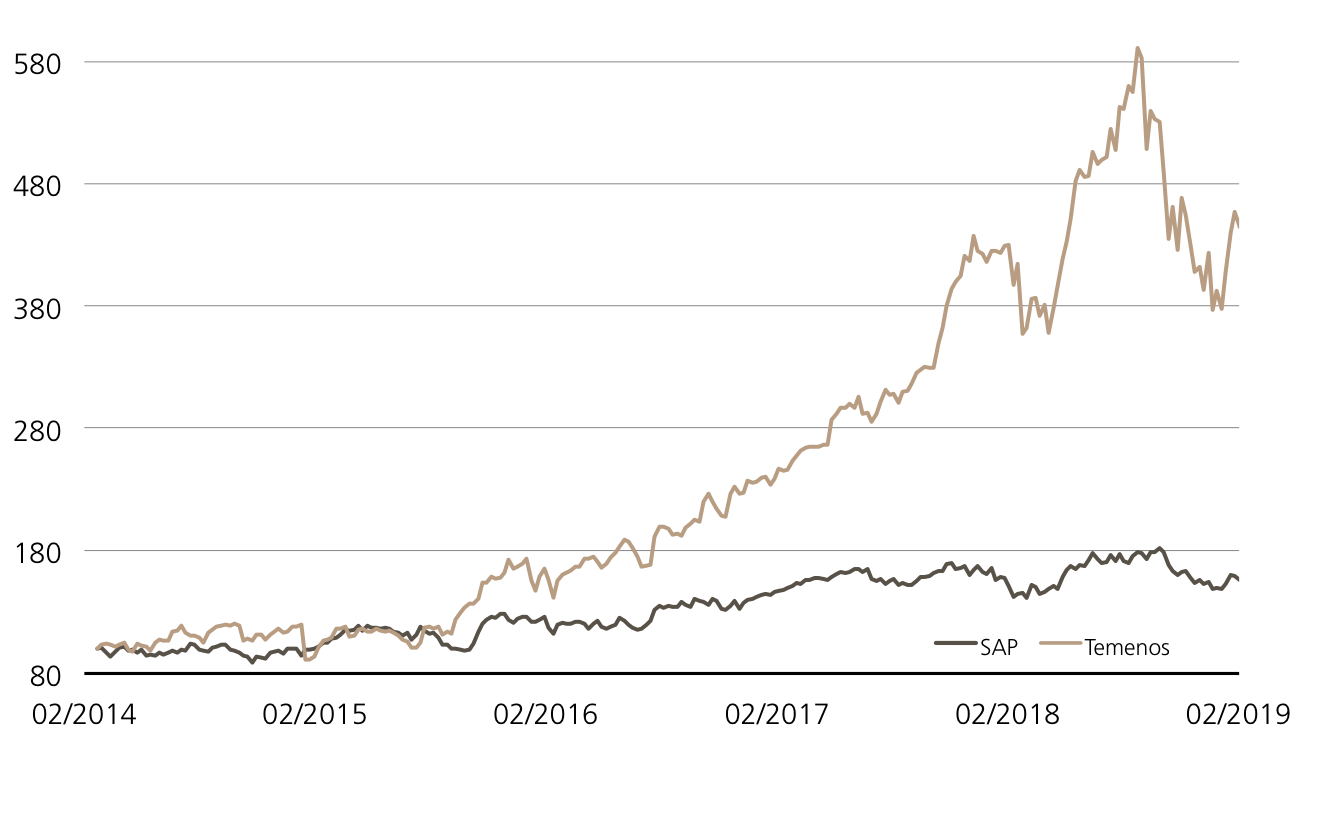
Temenos vs. SAP
(five years, for illustrative purposes only, figures in %)¹
Source: UBS AG, Bloomberg
As of: 20.02.2019
6.00% p.a. Worst of Kick-In GOAL on Temenos / SAP
| Symbol | KDEADU |
| SVSP Name | Barrier Reverse Convertibles |
| SPVSP Code | 1230 |
| Underlyings | Temenos / SAP |
| Currency | CHF (Quanto) |
| Coupon | 6.00% p.a. |
| Strike Level | 100% |
| Kick-In Level (barrier) | 60% |
| Expiry | 31.08.2020 |
| Issuer | UBS AG, London |
| Subscription until | 27.02.2019, 15:00 h |
More UBS products and further information on the risks and opportunities are available at ubs.com/keyinvest.
Source: UBS AG, Bloomberg
As of: 20.02.2019
¹) Please be aware that past performance does not indicate future results.
²) The conditions of ETTs are reviewed on a yearly basis and can be adjusted with a deadline of 13 months after the announcement.

