Weekly Hits: European Insurers, Spotify & Twitter
Friday, 15.02.2019

- Topic 1: European Insurers - A good start into the reporting season
- Topic 2: Spotify and Twitter - Two platforms with tremendous reach
European Insurers
A good start into the reporting season
The insurance industry has now entered the latest financial reporting season too. Zurich Insurance was the first Swiss insurance company to release its figures for the last fiscal year, while in Germany Munich Re was the frontrunner. Both companies presented squeaky clean balance sheets and exceeded analysts‘ expectations, and their strong operating profits are reflected in the share prices. The pair is ahead of the market average for the year, and Munich Re shares have just reached an all-time high, while Zurich shares are within sight of the mark.¹ The ETT tracker certificate (symbol: ETINS) for the STOXX™ Europe 600 Insurance Index allows full participation in the growth of the industry with broad diversification.² The Kick-In GOAL (Symbol: KCNGDU) on Zurich Insurance gives conservative investors an opportunity to take a position in the market. A 9.4 percent return is possible with this structured product even if prices move sideways.
Zurich Insurance recorded impressive full-year results with a net profit of USD 3.72 billion that exceeded the highest analyst estimate of USD 3.56 billion. The reported operating profit of 4.57 billion US dollars was also significantly above the consensus estimate. «We have further increased profitability and lowered costs,» said Zurich Chief Executive Mario Greco, commenting on the company’s good numbers. (Source: Zurich Insurance press release of February 2, 2019) Zurich’s goals remain unchanged, as the Group is striving for an after-tax operating profit for the years 2017 – 2019 representing more than twelve percent return on capital. For last year, this figure was 12.1 percent. And shareholders should profit from this success, as for 2018 the Executive Board has proposed a dividend of 19 Swiss francs per share, which is one franc higher than last year.
Munich Re is increasing its dividend as well after announcing good results: For 2018 the world’s largest reinsurer recorded a net profit of approximately 2.3 billion euros, coming after a mere 0.4 billion euros for the previous year. Shareholders can look forward to a 7.5 percent dividend increase, up to 9.25 euros per share. Over the next few weeks we will find out how many other European insurers will be able to keep pace with Zurich Insurance and Munich Re. Swiss Re and AXA, for example, will be releasing their books on February 21, followed by Swiss Life on February 26 and Baloise on March 7. The greatest anticipation swirls around Allianz: Europe’s largest insurance group will be releasing its figures on February 15. According to Thomson Reuters, analysts are expecting a 15.9 percent rise in earnings per share to 17.65 euros. The German insurance industry can expect 2019 to be a good year overall, the German Insurance Association GDV is projecting premiums to further increase by roughly two percent.Opportunities: The ETT tracker certificate on the STOXX™ Europe 600 Insurance Index (symbol: ETINS) affords investors a diversified investment opportunity in the industry. This product has no annual management fee, thus tracking the performance of the underlying index exactly.² The index is comprised of 35 stocks; the dividend yield is 4.3 percent. Distributions are accounted on a net basis. The Callable Worst of Kick-In GOAL (symbol: KCNGDU) on Zurich Insurance is a partially protected vehicle for investment in the insurance industry. The product features a risk buffer of 27.4 percent and a sideways yield of 9.4 percent.
Risks: The products are not capital-protected investments. Negative performance of the underlying stock results in corresponding loss in value for the ETT. In contrast, Worst of Kick-In GOALs do offer contingent capital protection. If the underlying is quoted at or below the kick-in level (barrier) once during the product term and the callable function is not triggered, the underlying has to at least trade back at the strike level by the expiration date. If not, payout takes place in the form of delivery of a fixed number of shares. In addition, the investor bears issuer risk with structured products, which means capital invested may be lost if UBS AG should go bankrupt, regardless of the performance of the underlying.
More UBS products and further information on the risks and opportunities are available at ubs.com/keyinvest.
STOXX™ Europe 600 Insurance Index (5 years)
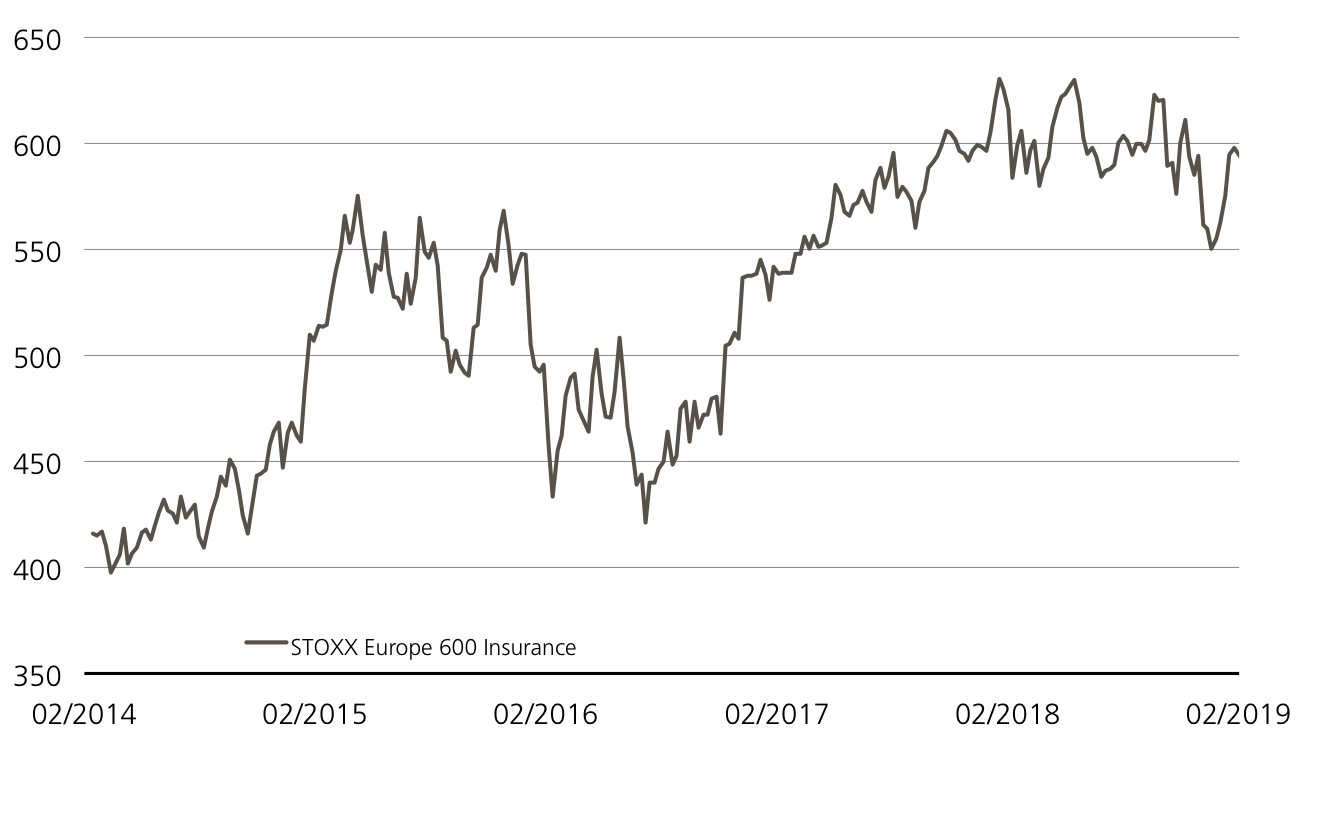
The uptrend that lasted from 2016 to 2018 gave way to sideway trading in the 600 point range. The sector index’s bottom-line performance has been good over a five-year period.
Source: UBS AG, Bloomberg
As of 13.02.2019
Zurich Insurance vs. SMI™
(five years, for illustrative purposes only, figures in %)¹
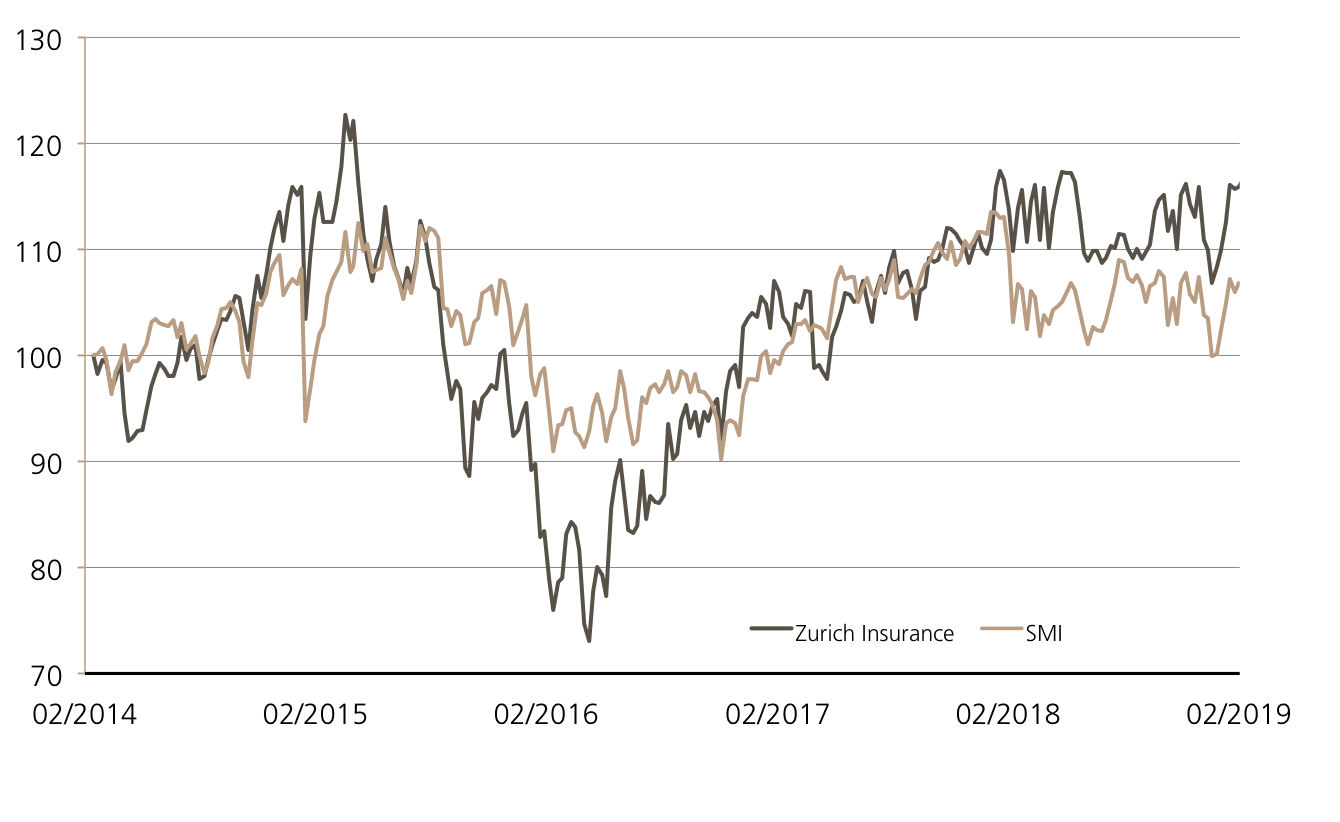
Zurich Insurance shares have traded up and down in recent years. The stock has been slightly more volatile than the overall market, but has ultimately performed the SMI™.
Source: UBS AG, Bloomberg
As of: 13.02.2019
¹) Please be aware that past performance does not indicate future results.
²) The conditions of ETTs are reviewed on a yearly basis and can be adjusted with a deadline of 13 months after the announcement.
ETT on STOXX™ Europe 600 Insurance Index
| Symbol | ETINS |
| SVSP Name | Tracker Certificates |
| SPVSP Code | 1300 |
| Underlying | STOXX™ Europe 600 Insurance Net Return Index |
| Currency | EUR |
| Ratio | 1:1 |
| Administration fee | 0.00% p.a.² |
| Expiry | Open End |
| Participation | 100% |
| Issuer | UBS AG, London |
| Bid/Ask | EUR 600.50 / 604.00 |
5.00% p.a. Callable Kick-In GOAL on Zurich Insurance
| Symbol | KCNGDU |
| SVSP Name | Barrier Reverse Convertible |
| SPVSP Code | 1230 (Callable) |
| Underlying | Zurich Insurance |
| Currency | CHF |
| Coupon | 5.00% p.a. |
| Sideways return | 9.38% / 5.55% p.a. |
| Kick-In Level (Distance) | CHF 231.825 (27.55%) |
| Sideways return | 9.38% / 5.55% p.a. |
| Expiry | 05.10.2020 |
| Issuer | UBS AG, London |
| Bid/Ask | 97.95% / 98.95% |
More UBS products and further information on the risks and opportunities are available at ubs.com/keyinvest.
Source: UBS AG, Bloomberg
As of: 13.02.2019
Market overview
| Index | Quotation | Week¹ |
| SMI™ | 9’164.06 | 0.2% |
| SLI™ | 1’417.38 | 0.1% |
| S&P 500™ | 2’753.03 | 0.8% |
| Euro STOXX 50™ | 3’202.37 | -0.3% |
| S&P™ BRIC 40 | 4’178.84 | 0.0% |
| CMCI™ Compos. | 905.13 | -0.9% |
| Gold (troy ounce) | 1’315.10 USD | 0.1% |
¹ Change based on the closing price of the previous day compared to the closing price a week ago.
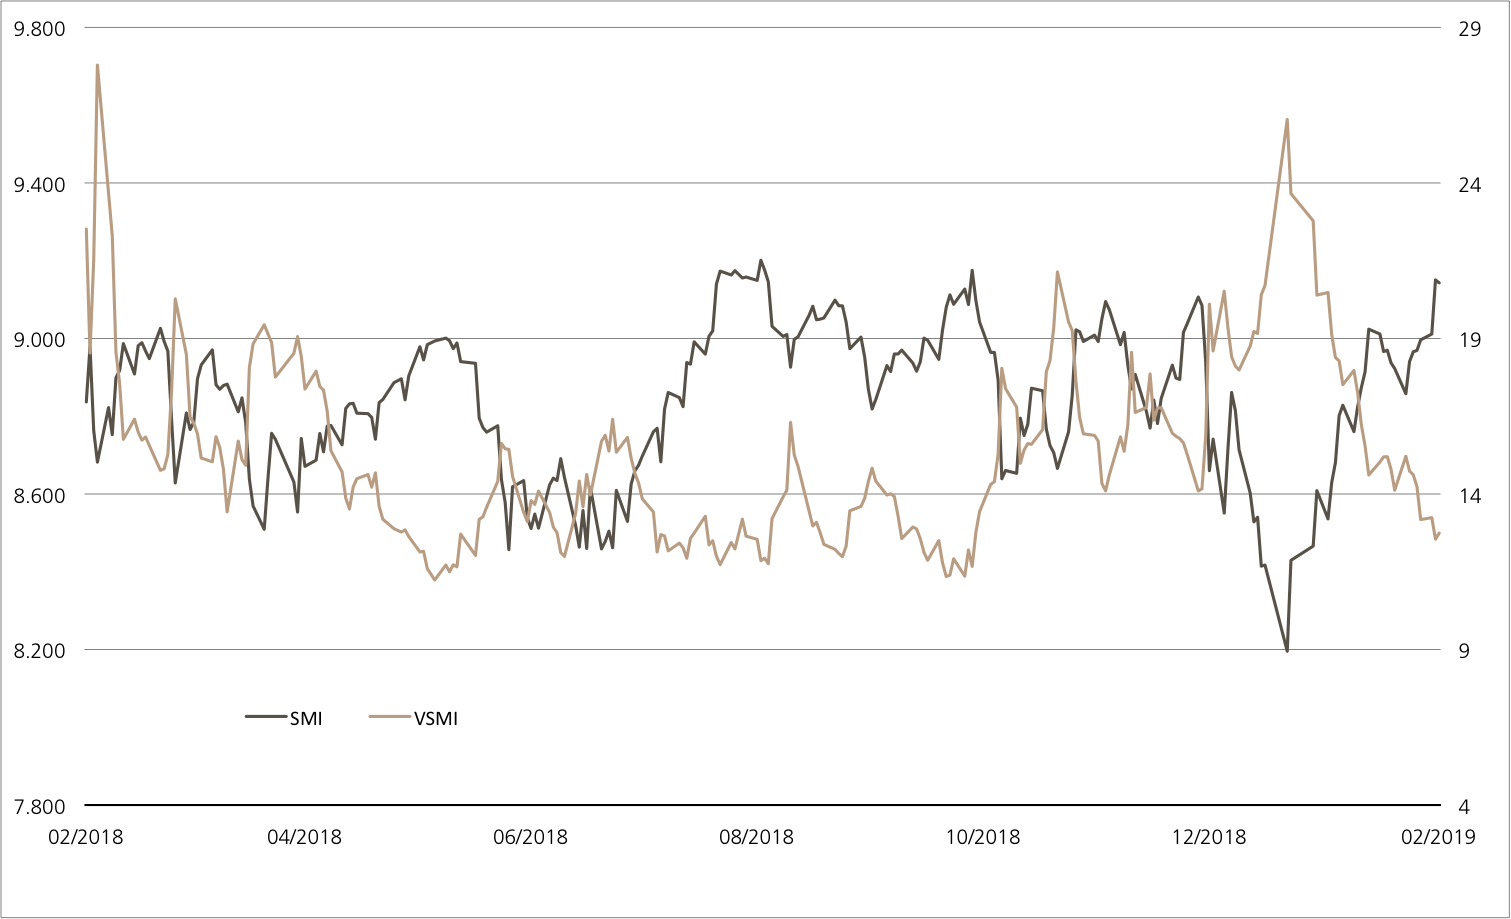
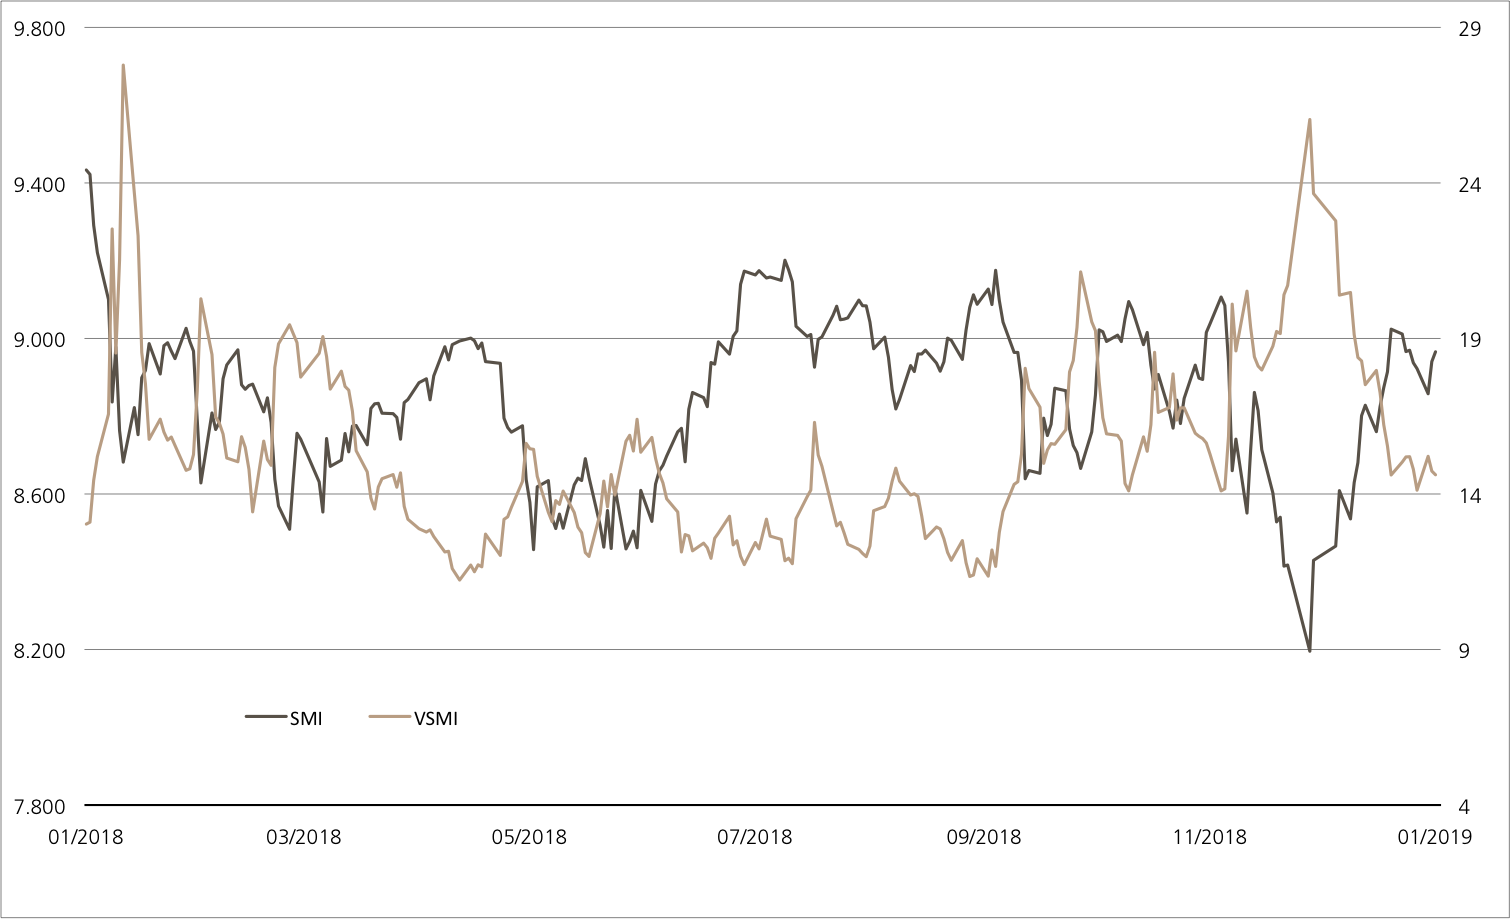
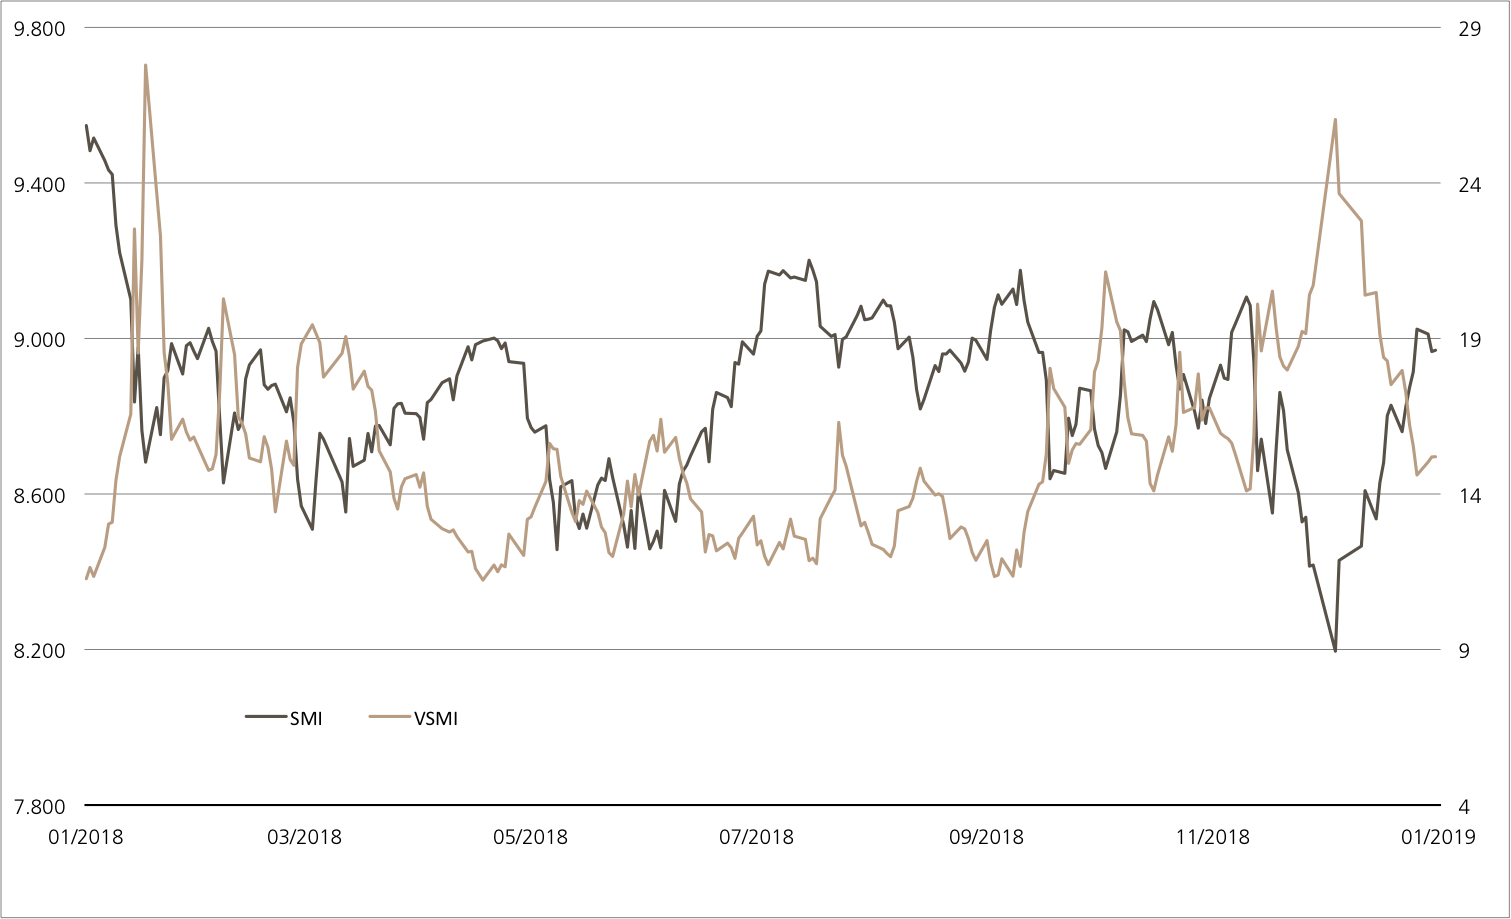
SMI™ vs. VSMI™ 1 year
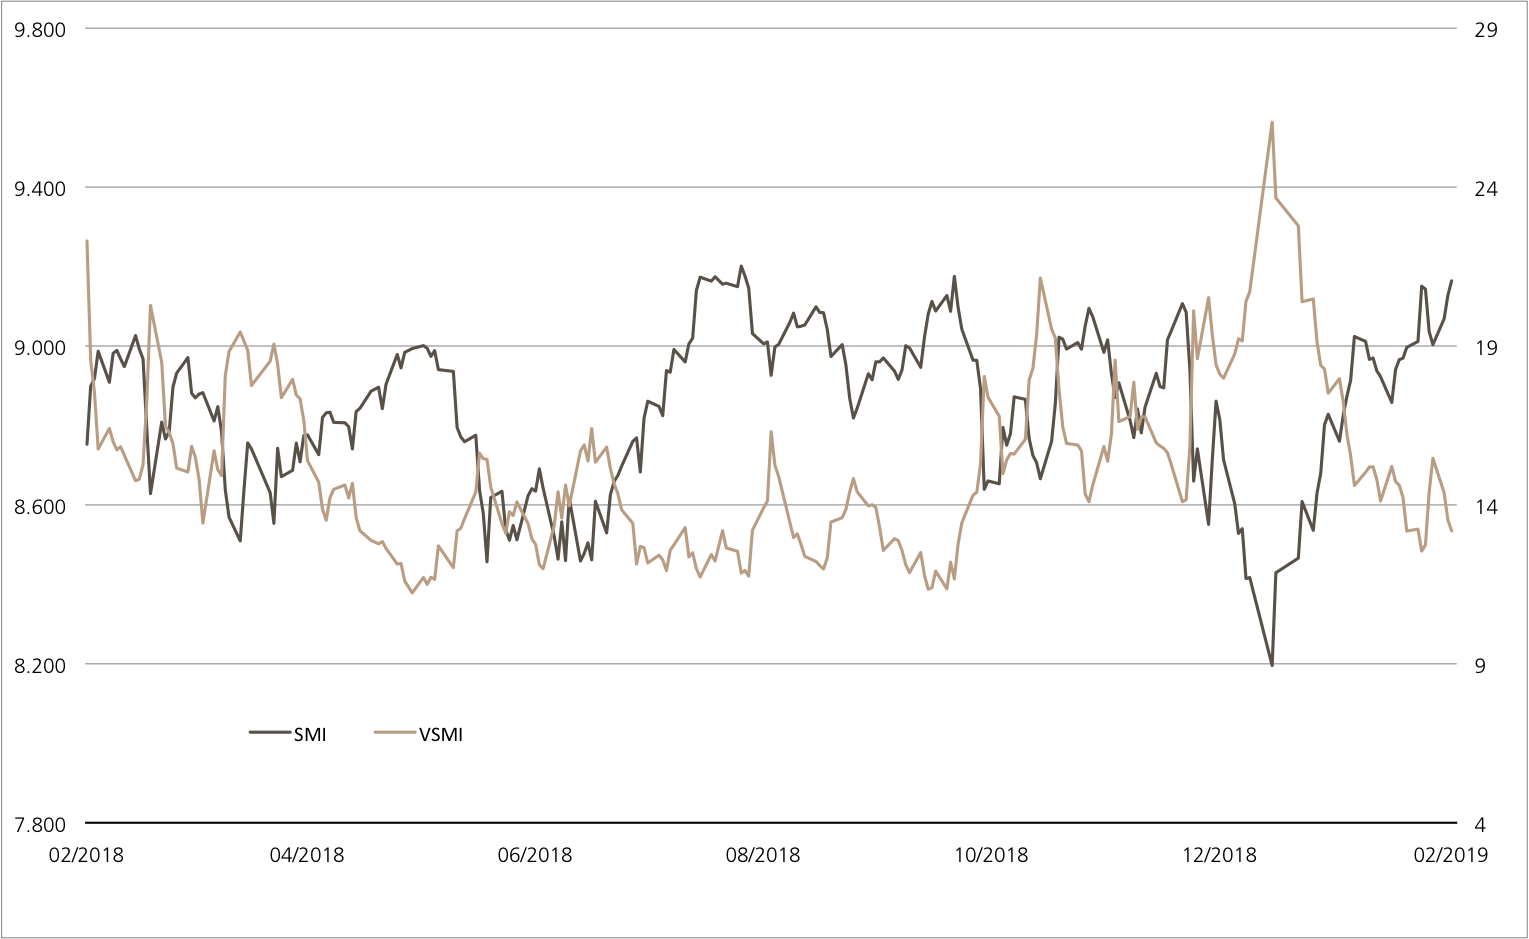
The VSMI™ Index is calculated since 2005. It shows the volatility of the stocks within the SMI™ index. A portfolio which reacts only to changes in volatility instead of volatility itself is relevant for the calculation. Thereby, the VSMI™ methodology uses the squared volatility, known as variance, of the SMI options with remaining time to expiry of 30 days traded at the Eurex.
Source: UBS AG, Bloomberg
As of: 13.02.2019
Spotify and Twitter
Two platforms with tremendous reach
Whether listening to music on the way to work or popping off a quick tweet in the evening – for many people, Spotify and Twitter are an integral part of everyday life. Together the streaming provider and short message service had more than half a billion active users at the end of 2018. The two make for an interesting Early Redemption (ER) Kick-In GOAL product too (symbol: KCTLDU). This product offers a potential sideways annualized yield of 14.5 percent p.a. Both stocks have declined since their IPOs in November 2018, the current worst-performer of the two, Twitter, still has a safety buffer of more than 40 percent.
Spotify, Twitter and many other internet stocks got off to a strong start to the year¹, but the two lost momentum after releasing their financials. Spotify announced recording an operating profit for the first quarter ever despite analysts expecting the company to remain in the red. Growing at a rate of 30 percent, the music platform managed to roughly meet sales expectations for the period October to December 2018. Investors were apparently concerned about the outlook for this Swedish company, as Spotify is forecasting declining gross margin for 2019 among other things. (Source: Thomson Reuters Media Report, February 6, 2019)
The US short message service Twitter has recently found itself in a similar situation, reporting strong figures for the fourth quarter of 2019, partly on rising video advertising income, which contributed to a 24 percent increase in sales. The social media company reported better-than-expected earnings as well, yet investors were still disappointed about the outlook for Twitter. For the first quarter of 2019 management estimates sales will range between 715 and 775 million US dollars, the mid-point of which is below the average sales previously projected by analysts. (Source: Thomson Reuters Media Report, 2/7/2019)
Opportunities: The ER Kick-In GOAL is an alternative option to directly investing in Spotify and Twitter (symbol: KCTLDU). As long as neither of the stocks falls to or below their respective barrier, the structured product can afford an annualized yield of up to 14.5 percent at maturity. The underlying stocks are currently trading more than 40 percent above the kick-in level. The first possible early redemption is on November 7, 2019. If Spotify and Twitter trade at or above the starting level on this day or any other quarterly observation day, the Kick-in GOAL expires early. In such case, investors will receive the full nominal amount plus pro rata coupon transferred to their account a few days later.
Risks: Kick-In GOALs are not capital-protected investments. If one of the underlyings trades at or below the applicable kick-in level (barrier) during the product term and the early redemption feature cannot apply, the product may be redeemed on the expiry date in cash based on the price of the weaker performing of the two (relative to the strike, not to exceed nominal value plus coupon). Losses are likely in such case. In addition, investors in structured products bear issuer risk, which means capital invested may be lost if UBS AG should go bankrupt, regardless of the performance of the underlying.
More UBS products and further information on the risks and opportunities are available at ubs.com/keyinvest.
Spotify Technology vs. Twitter
(since Spotify IPO, for illustrative purposes only; figures in %)¹

Source: UBS AG, Bloomberg
As of: 13.02.2019
12.00% p.a. Early Redemption Kick-In GOAL on Spotify Technology / Twitter
| Symbol | KCTLDU |
| SVSP Name | Barrier Reverse Convertibles |
| SPVSP Code | 1230 (Auto-Callable) |
| Underlyings | Spotify Technology / Twitter |
| Currency | USD |
| Coupon | 12.00% p.a. |
| Sideways return | 16.29% (12.84% p.a.) |
| Kick-In Level (Distance) |
Spotify: USD 72.885 (49.22%) Twitter: USD 17.495 (43.78%) |
| Expiry | 08.05.2020 |
| Issuer | UBS AG, London |
| Bid/Ask | 97.50% / 98.50% |
More UBS products and further information on the risks and opportunities are available at ubs.com/keyinvest.
Source: UBS AG, Bloomberg
As of: 13.02.2019
¹) Please be aware that past performance does not indicate future results.
²) The conditions of ETTs are reviewed on a yearly basis and can be adjusted with a deadline of 13 months after the announcement.

