Weekly Hits: G20 summit & Interesting trio

KeyInvest Weekly Hits

Friday, 30.11.2018

G20
  • Topic 1: G20 summit - Tango of the superpowers
  • Topic 2: Logitech/Oerlikon/Straumann - An interesting mid-cap trio

G20 summit
Tango of the superpowers

On November 30th and December 1st, the heads of states and governments of the leading economies will meet for the G20 summit; However, the spotlight in Buenos Aires will mainly be on Donald Trump und Xi Jinping. The US President and his Chinese counterpart may potentially discuss the current trade dispute in a private meeting. According to UBS CIO GWM, signs that tensions are easing would be met with open arms on the markets. The experts believe it possible that positive surprises will occur in two other areas with a view to the coming months. This assessment was the reasoning behind CIO GWM increasing the overweighting of global equities in the asset allocation. With an ETT (symbol: ETWRLD) on the MSCI™ World Net Total Return Index, investors can replicate this strategy. A global approach can also be taken with the Callable Kick-In GOAL (symbol: KCWDDU) on EURO STOXX 50™, S&P 500™ and SMI™. Nevertheless, this product is not reliant on rising prices to deliver the maximum annual return of 6%. Rather, the three prominent indexes start the two-year term with a safety buffer of 45%.

It’s the ultimate event – the countries that will be in attendance at the G20 summit represent 85% of the global economic output and 75% of global trade. They also are home to two-thirds of the world’s population (source: www.g20.org). One of the main topics of the summit will be the trade dispute between the US and China, which has been simmering for months. In the run-up to the event, hopes were not particularly high that a potential face-to-face meeting between US President Donald Trump and China’s ruler Xi Jinping would lead to a solution. CIO GWM is generally of the same opinion. However, the experts believe that there is a 20% chance of a market-friendly result, for example in the form of at least a temporary agreement.

Looking ahead to the coming months, CIO GWM has identified two additional areas where there could be positive surprises. For example, it states that China is attempting to compensate for the negative effects of US punitive tariffs with fiscal measures and by adjusting its monetary policy. According to CIO GWM, there are signs that this proactive attitude is beginning to take effect. In addition, growth in Europe in the first half of 2019 could produce a positive surprise. Meanwhile, CIO GWM identifies the main risks as being an escalation of the tariff dispute and US interest rate hikes exceeding expectations. Following the recent equity market correction, strategists believe that it is now a favorable time to enter the market. This is also due to the drop in the valuation level and the potential for surprises outlined above. (Source: UBS CIO GWM: “UBS House View Monthly Letter”, November 15, 2018)

Opportunities: The ETT (symbol: ETWRLD) on the MSCI™ World Net Total Return Index allows investors to take up a diversified position on the global equity market. More than 1,600 companies from 23 developed countries are contained in the underlying. The Callable Kick-In GOAL (symbol: KCWDDU) on EURO STOXX 50™, S&P 500™ and SMI™ offers an alternative to direct participation in the global benchmark. Irrespective of the performance of the underlying indexes, the product pays a coupon of 6% per year. As long as none of the underlyings equal or fall below the barrier at a low 55% of the initial prices, investors will receive their nominal repaid in full on the date of maturity. If the issuer exercises the callable function, the term can be ended after just one year. Starting with December 5, 2019, there is a right to termination every three months.

Risks: The aforementioned products do not have capital protection. The ETT will make a loss if the underlying index decreases. If the underlying assets for the Kick-In GOALs touch or fall below the respective kick-in level and the callable feature does not apply, the amount repaid on the date of maturity may be in cash, reflecting the worst performance of the three indexes (but not more than nominal value plus coupon). In this case, it is likely that losses will be incurred. Investors in structured products are also exposed to issuer risk, which means that the capital invested may be lost if UBS AG becomes insolvent, regardless of the performance of the underlying.

More UBS products and further information on the risks and opportunities are available at ubs.com/keyinvest.

MSCI™ World Net Total Return Index 5 years¹
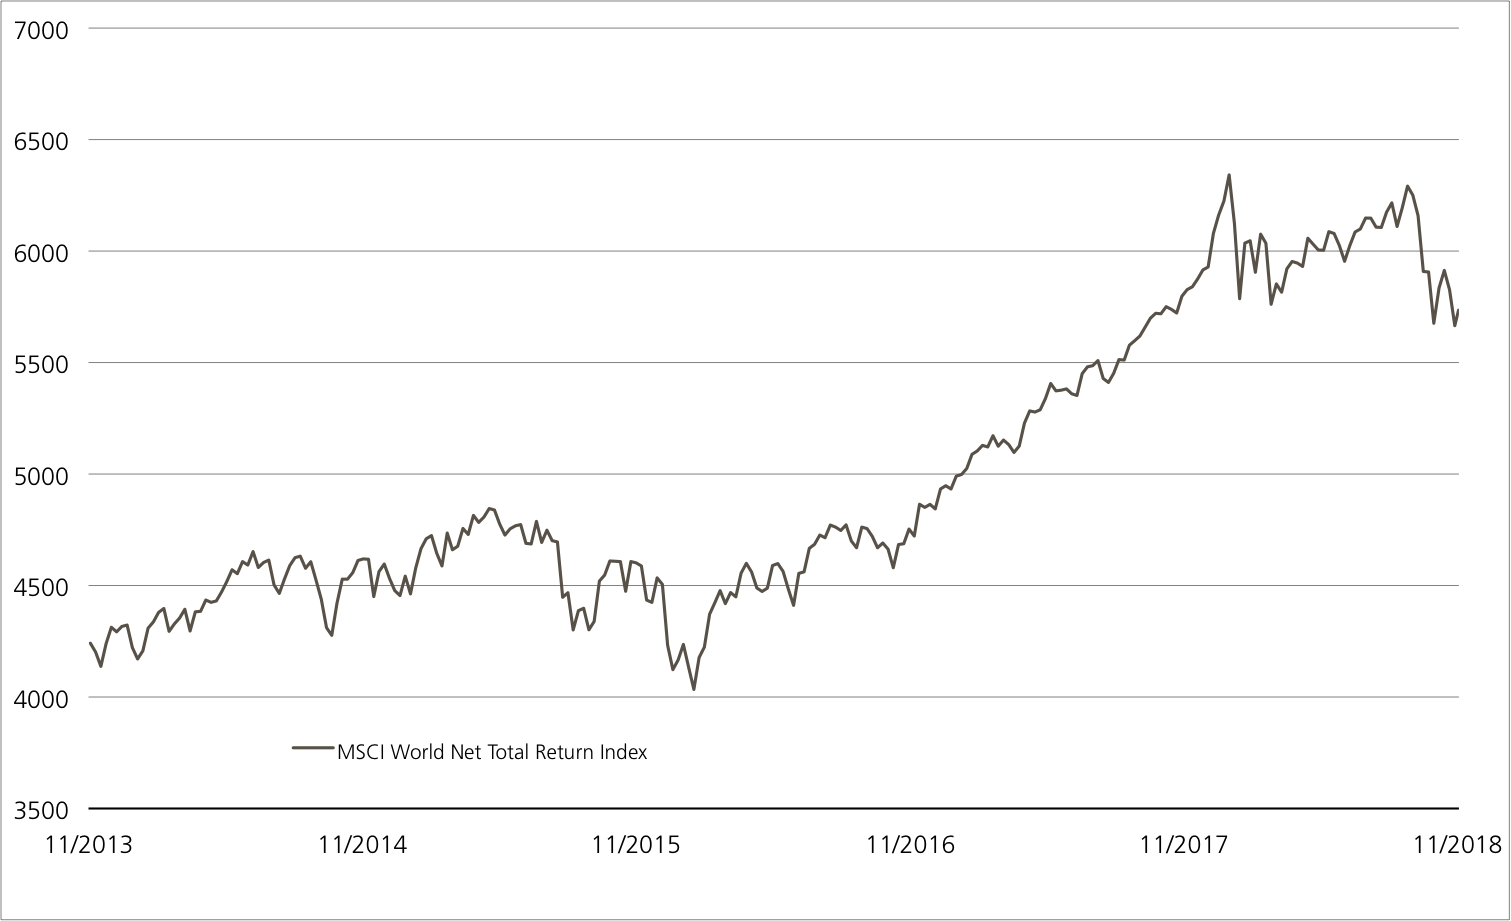
At the end of September, the “world select” came very close to equaling the all-time high reached at the beginning of 2018. Shortly before this summit, however, the MSCI™ World Net TR Index suffered a downturn.

Source: UBS AG, Bloomberg

As of 28.11.2018

EURO STOXX 50™ vs. S&P 500™ vs. SMI™
(5 years; for illustrative purposes only; figures in %)¹
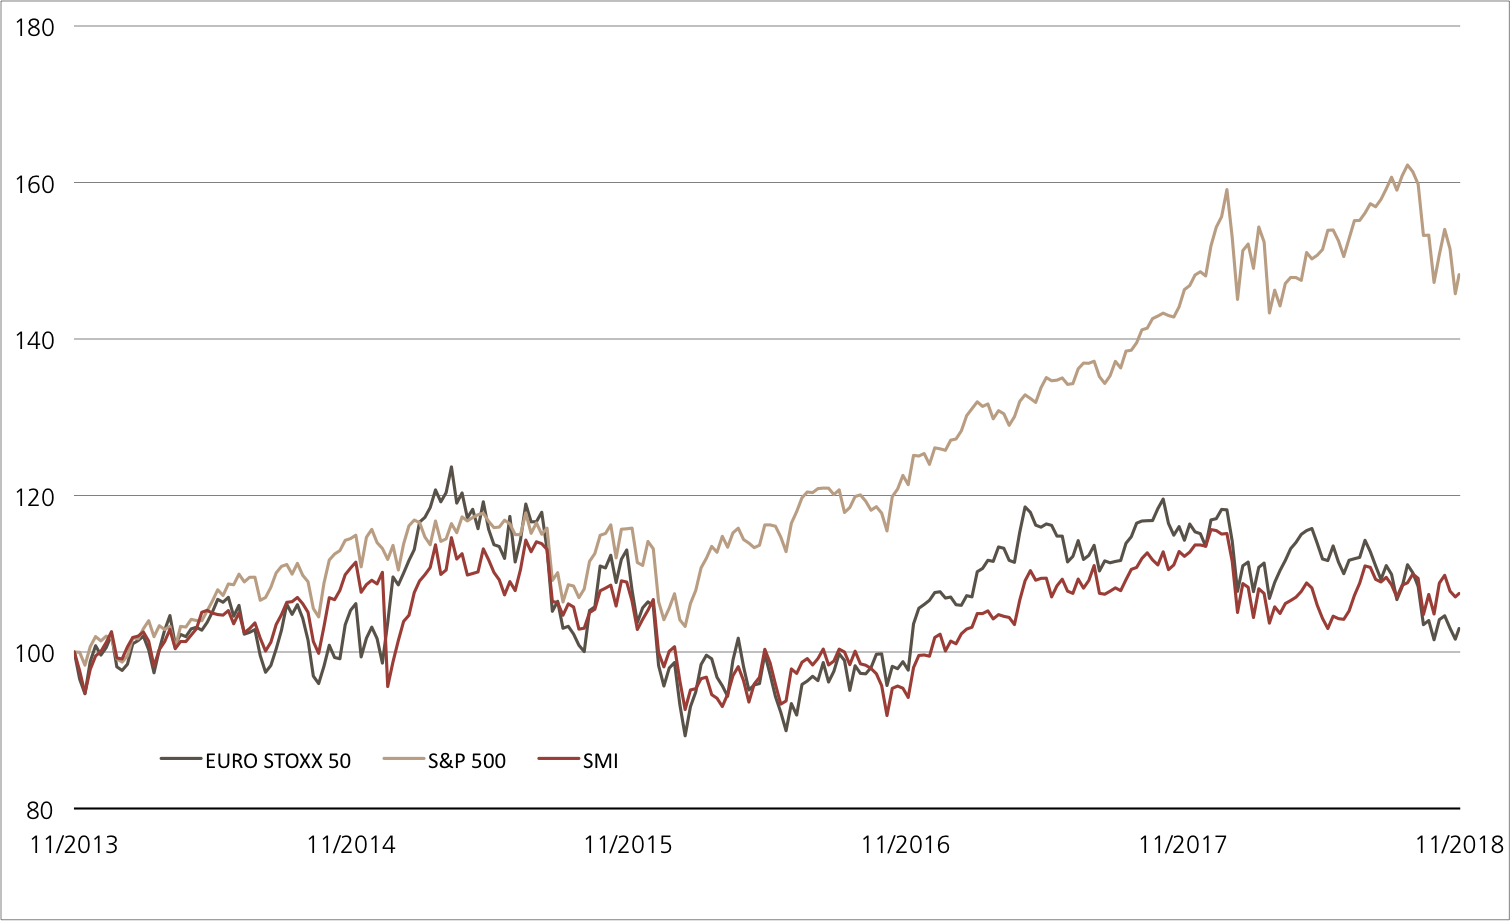
For the past five years, Wall Street has been the measure of all things related to the global equity markets. Compared to the S&P 500™, the European benchmarks are clearly lagging behind.

Source: UBS AG, Bloomberg

As of: 28.11.2018

¹) Please be aware that past performance does not indicate future results.
²) The conditions of ETTs are reviewed on a yearly basis and can be adjusted with a deadline of 13 months after the announcement.

ETT on MSCI™ World Net Total Return Index

Symbol ETWRLD
SVSP Name Tracker-Zertifikat
SPVSP Code 1300
Underlying MSCI™ World Net Total Return Index
Currency USD
Ratio 10:1
Administration fee 0.00% p.a.²
Expiry Open End
Participation 100%
Issuer UBS AG, London
Bid/Ask USD 570.00 / 576.00
 

6.00% p.a. Callable Worst of Kick-In GOAL on EURO STOXX 50™ / S&P 500™ / SMI™

Symbol KCWDDU
SVSP Name Barrier Reverse Convertible
SPVSP Code 1230 (Auto-Callable)
Underlying EURO STOXX 50™ / S&P 500™ / SMI™
Currency USD
Coupon 6.00% p.a.
Kick-In Level 55.00%
Expiry 07.12.2020
Issuer UBS AG, London
Subscription until 05.12.2018, 14:00 h
 

More UBS products and further information on the risks and opportunities are available at ubs.com/keyinvest.

Source: UBS AG, Bloomberg

As of: 28.11.2018

Market overview

Index Quotation Week¹
SMI™ 8’894.58 0.6%
SLI™ 1’377.63 0.7%
S&P 500™ 2’743.49 3.5%
Euro STOXX 50™ 3’168.29 0.5%
S&P™ BRIC 40 3’956.98 2.7%
CMCI™ Compos. 881.07 -2.0%
Gold (troy ounce) 1’229.80 USD 0.1%

¹ Change based on the closing price of the previous day compared to the closing price a week ago.

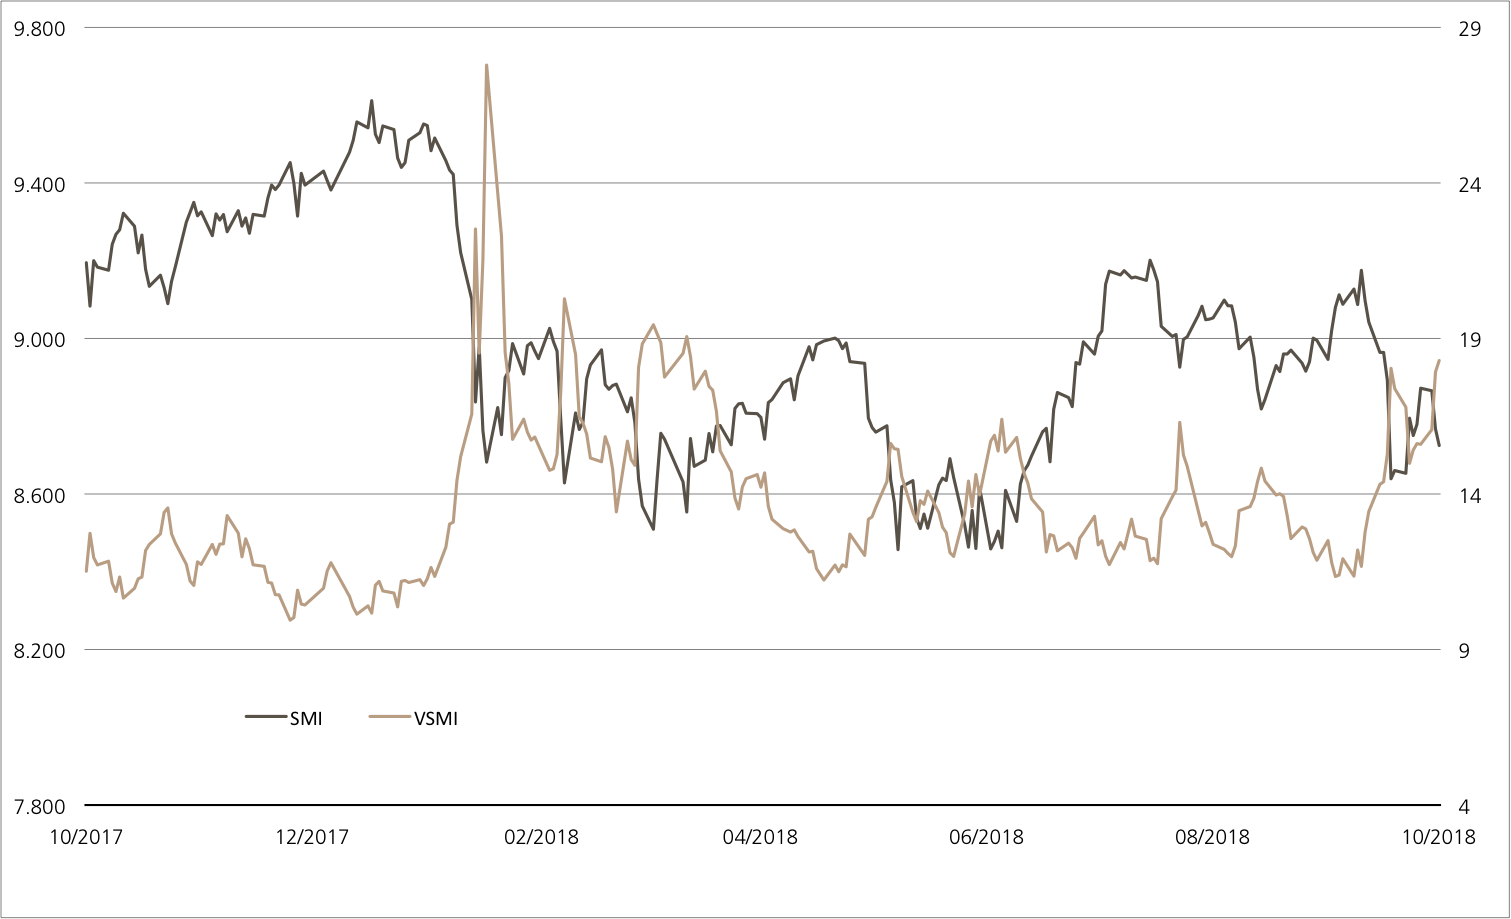
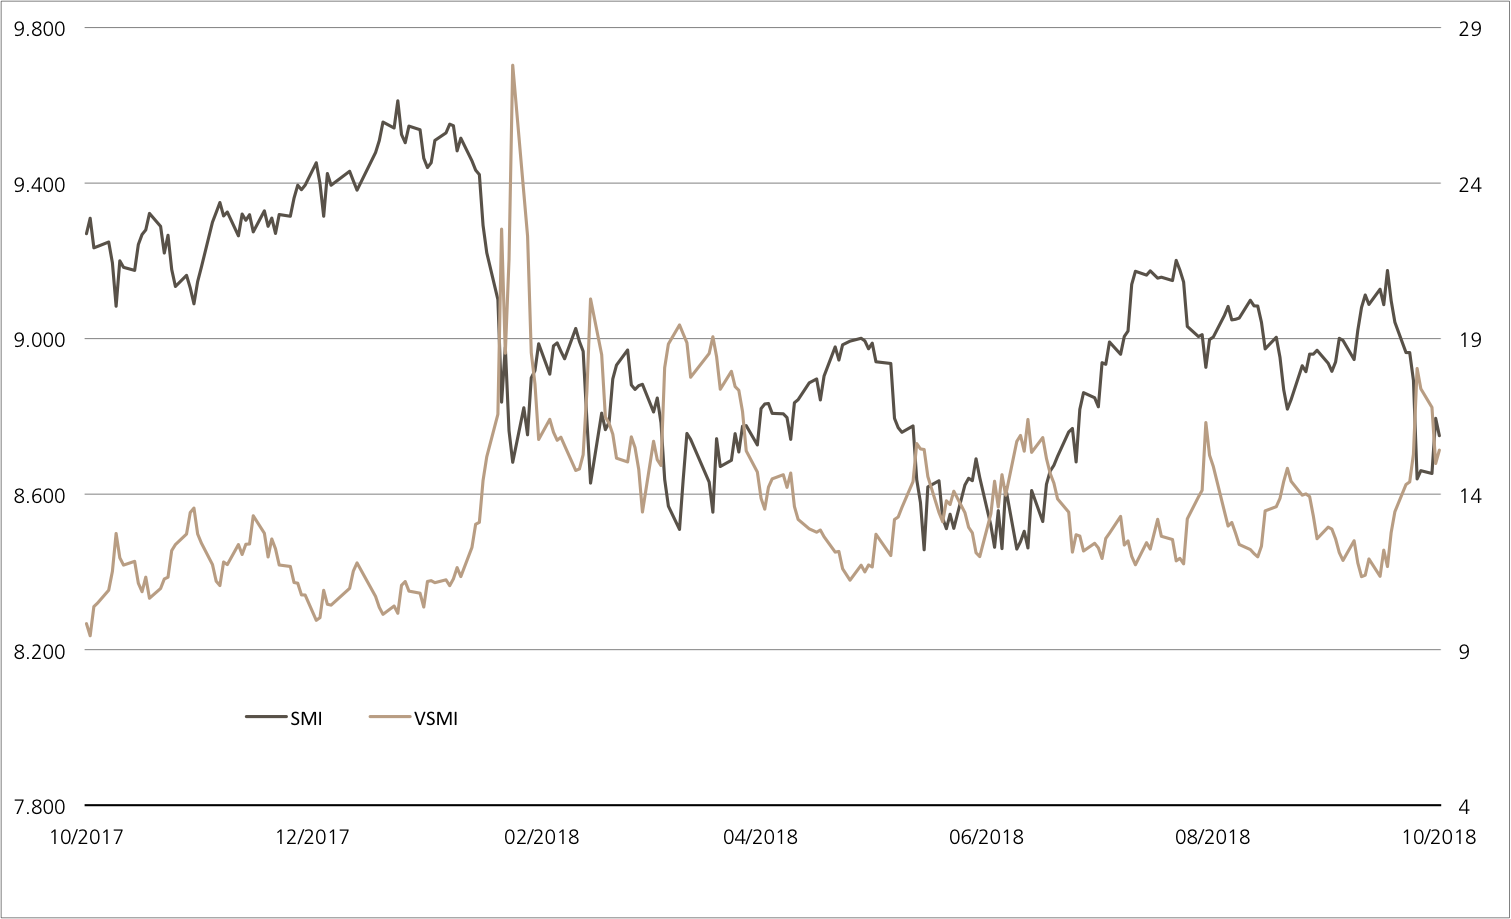
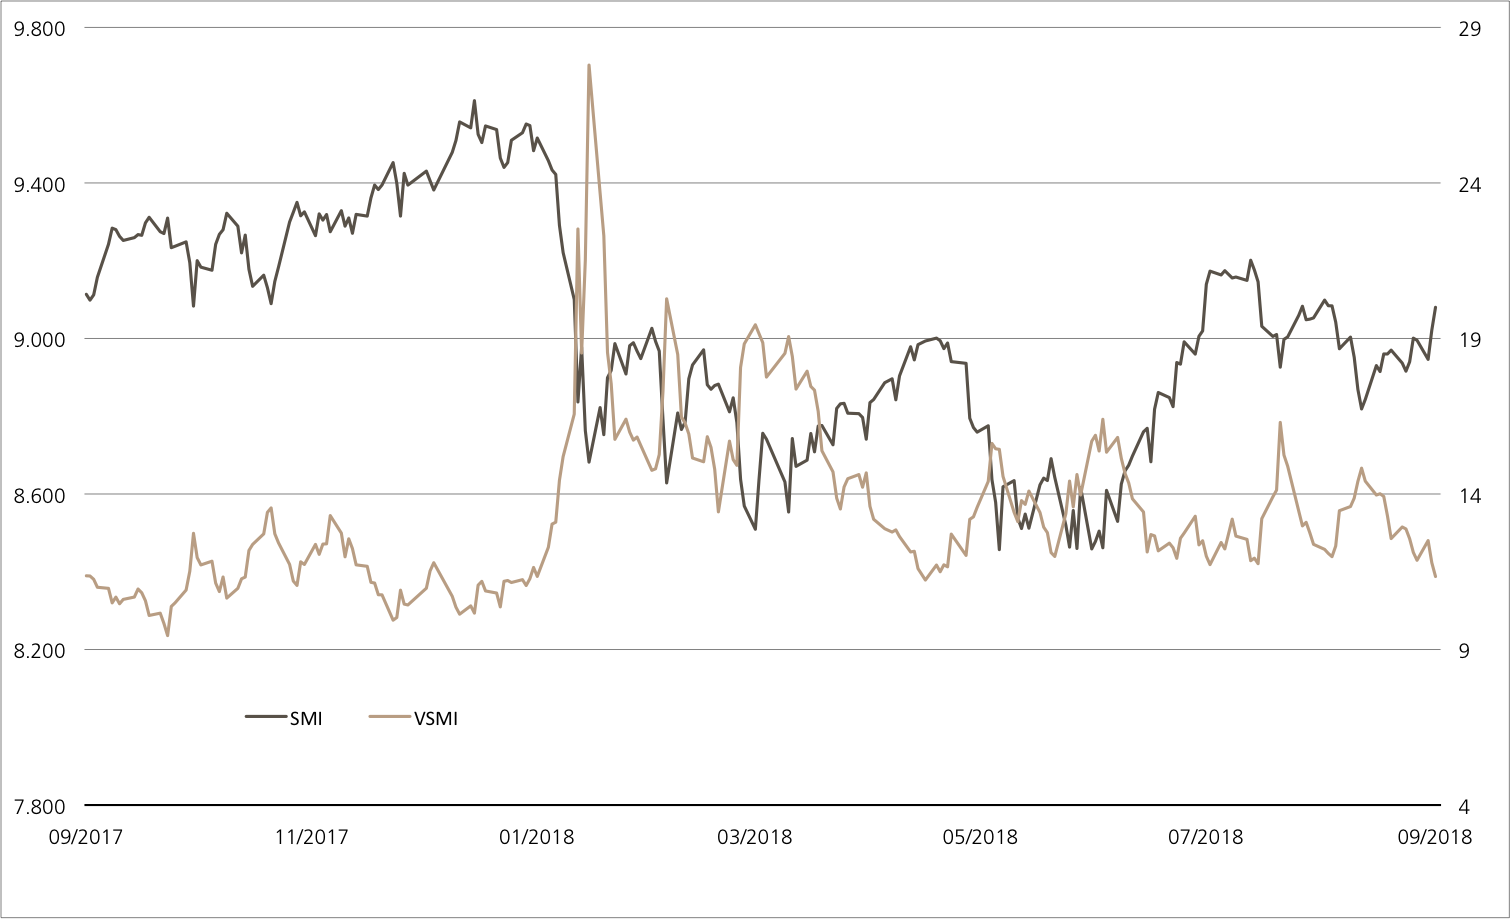
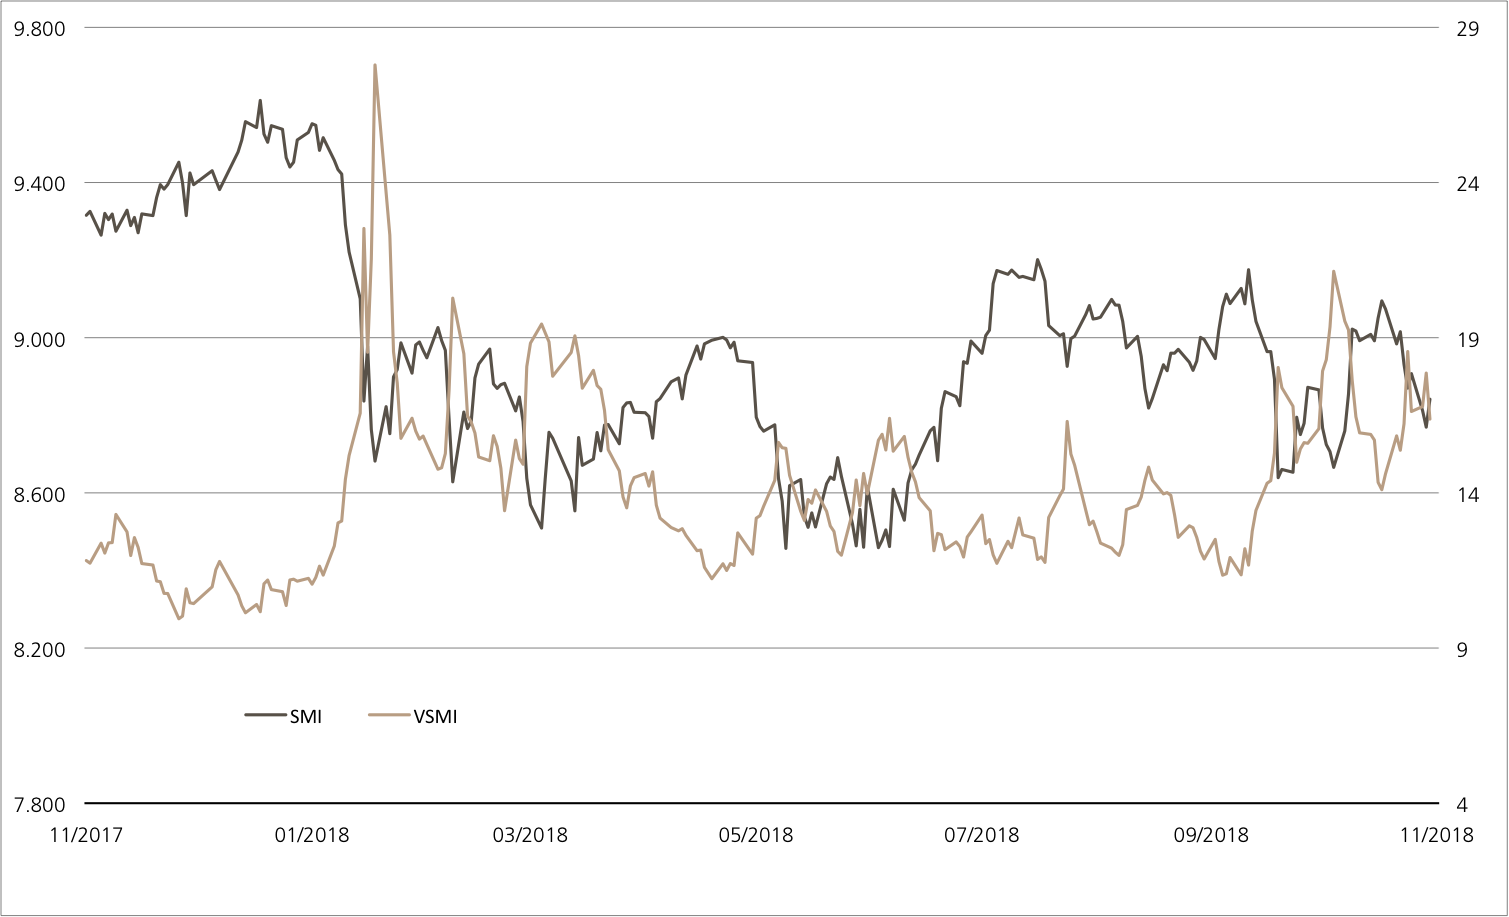
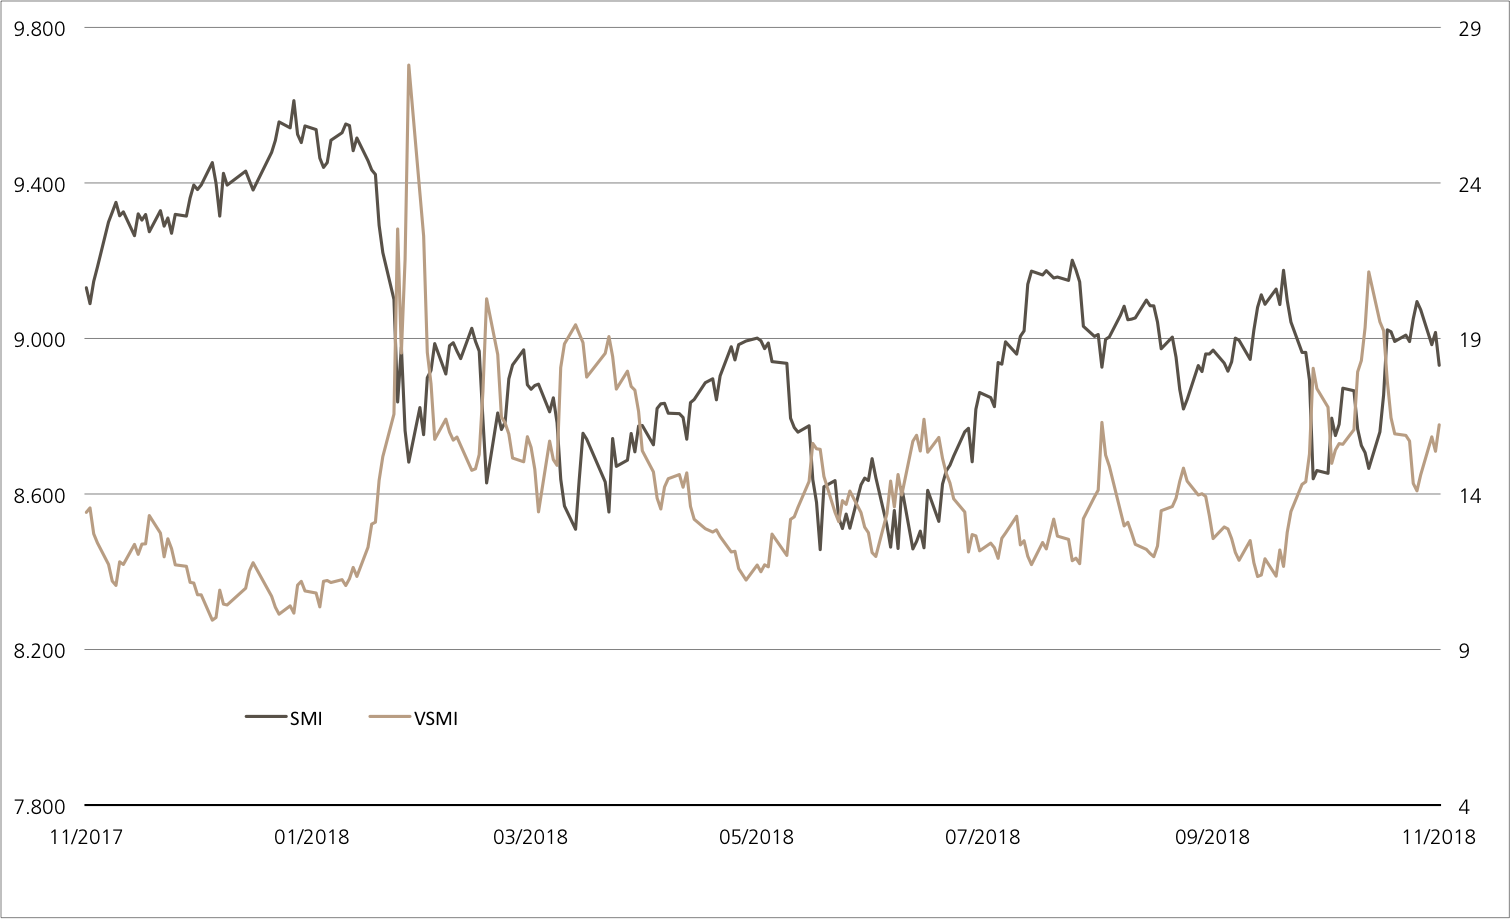
SMI™ vs. VSMI™ 1 year
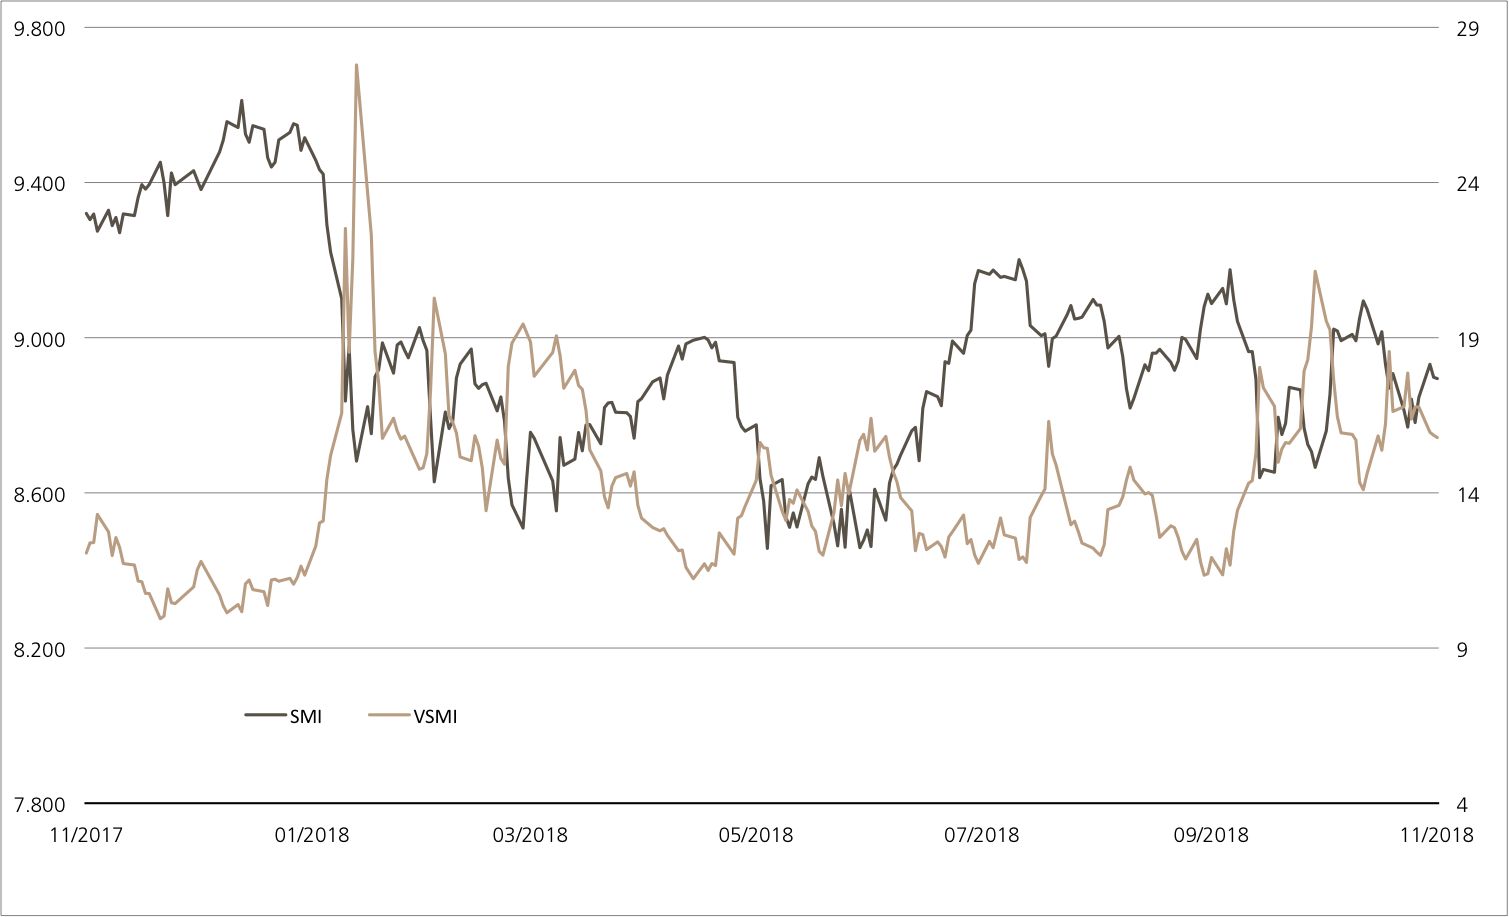
smi vs vsmi

The VSMI™ Index is calculated since 2005. It shows the volatility of the stocks within the SMI™ index. A portfolio which reacts only to changes in volatility instead of volatility itself is relevant for the calculation. Thereby, the VSMI™ methodology uses the squared volatility, known as variance, of the SMI options with remaining time to expiry of 30 days traded at the Eurex.

Source: UBS AG, Bloomberg

As of: 28.11.2018

Logitech/Oerlikon/Straumann
An interesting mid-cap trio

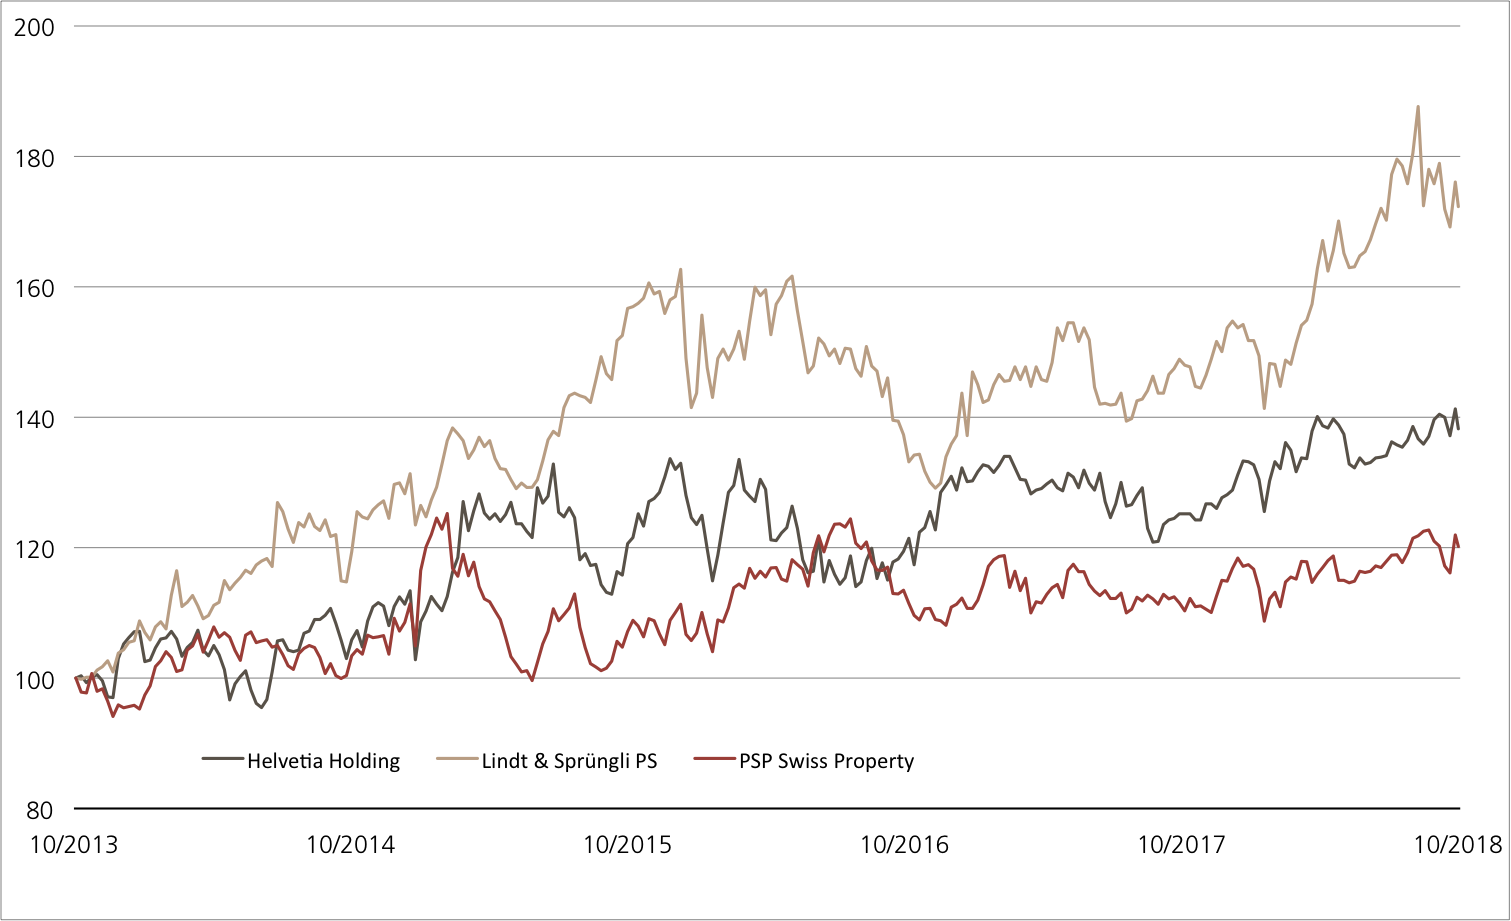
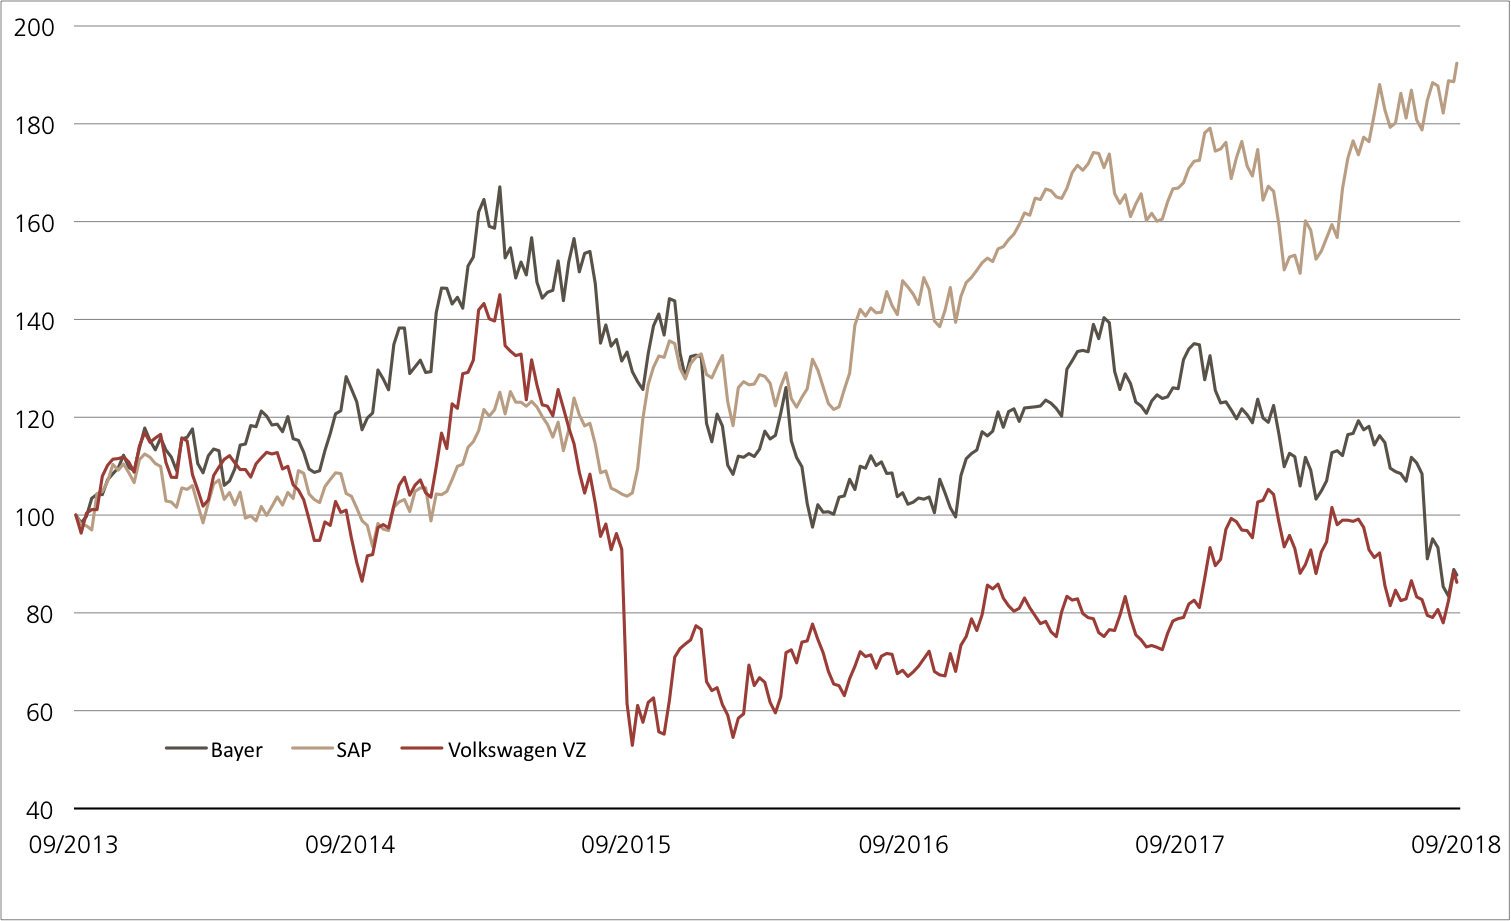
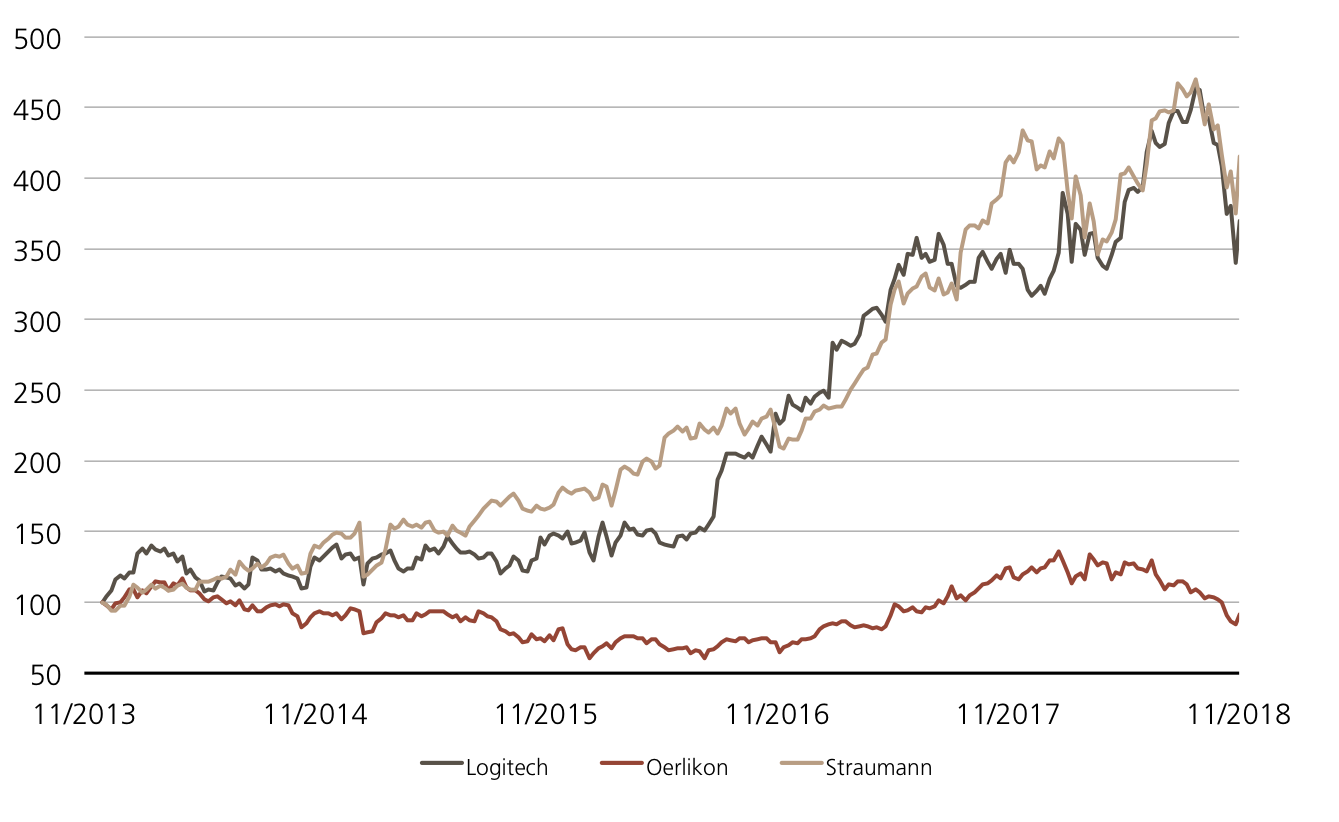
There is a distinct lack of good news on the stock market in these current tense times. And yet, there are instances here and there, for example at Straumann. The leading implant manufacturer from Basel has already increased its forecast twice this year due to its flourishing business. There is also exciting news at Logitech. Last weekend, the computer accessories manufacturer ended takeover talks with US headphone manufacturer Plantronics. Meanwhile, the OC Oerlikon industrial group announced its plans to further expand its partnership with Airbus. The new Early Redemption (ER) Worst of Kick-In GOAL (symbol: KCWPDU) offers investors the opportunity to invest in the Swiss mid-cap trio with conditional partial protection. The product pays out a double-digit percentage coupon of 10% every year and also provides a risk buffer of 40%.

Straumann is currently enjoying strong growth. In the third quarter, organic sales growth amounted to 18.1% and was thus two percentage points higher than expected. As a result, the dental specialist raised its forecast for the year once again. Organic growth in the high (previously: medium) 10% range and a further improvement in the EBITDA margin are now expected for 2018. CEO Marco Gadola is happy with the strong product range, such as the new mini implants with a diameter of just 2.4 millimeters. Logitech also wanted to bring in new products and thus focused on US headphone manufacturer Plantronics. According to Thomson Reuters, the transaction would have cost more than USD 2.2 billion, which would be by far the largest acquisition made by Logitech. However, according to insiders, the deal collapsed due to differing price expectations. (Source: Thomson Reuters media report, November 26, 2018) In the meantime, Oerlikon is enjoying continuing organic growth. The group’s Surface Solutions segment has been awarded the prized status of “Qualified Supplier” by Airbus. In addition, Oerlikon confirmed its targets for 2018 after recording pleasing nine-month figures.

Opportunities: The ER Worst of Kick-In GOAL (symbol: KCWPDU) is the perfect solution for investors wanting to include the SMIM™ shares in their portfolios. The product available for subscription pays an annual coupon of 10% regardless of the price performance of the three shares. The repayment of the nominal is linked to the underlyings. Provided that the barrier of 60% of the starting prices remains intact, investors will remain safe from losses. The maximum return can also be achieved earlier due to the early redemption function. Requirement: The underlyings all have to be at or above their starting price on one of the quarterly observation days (first date: June 4, 2019).

Risks: ER Kick-In GOALs do not have capital protection. If the underlyings equal or fall below the respective kick-in level (barrier) and the early redemption feature does not apply, the amount repaid on the date of maturity may be in cash, reflecting the worst performance of the three shares (but not more than nominal value plus coupon). In this case, it is likely that losses will be incurred. Investors in structured products are also exposed to issuer risk, which means that the invested capital may be lost if UBS AG becomes insolvent, regardless of the performance of the underlying.

More UBS products and further information on the risks and opportunities are available at ubs.com/keyinvest.

Logitech vs. OC Oerlikon vs. Straumann
(5 years; for illustrative purposes only; figures in %)¹
Source: UBS AG, Bloomberg

As of: 28.11.2018

7.00% p.a. ER Kick-In GOAL on Continental, Michelin

Symbol KCWPDU
SVSP Name Barrier Reverse Convertible
SPVSP Code 1230 (Auto-Callable)
Underlyings Logitech / OC Oerlikon / Straumannn
Currency CHF
Coupon 10.00% p.a.
Kick-In Level 60.00%
Expiry 05.06.2020
Issuer UBS AG, London
Subscription until 05.12.2018, 15:00 h
 

More UBS products and further information on the risks and opportunities are available at ubs.com/keyinvest.

Source: UBS AG, Bloomberg

As of: 28.11.2018

¹) Please be aware that past performance does not indicate future results.
²) The conditions of ETTs are reviewed on a yearly basis and can be adjusted with a deadline of 13 months after the announcement.

This material has been prepared by UBS AG or one of its affiliates («UBS»). This material is for distribution only as permitted by law. It is not prepared for the needs of any specific recipient. It is published solely for information and is not a solicitation or offer to buy or sell any securities or related financial instruments (“Instruments”). UBS makes no representation or warranty, either express or implied, on the completeness or reliability of the information contained in this document (“Information”) except that concerning UBS AG and its affiliates. The Information should not be regarded by recipients as a substitute for using their own judgment. Any opinions expressed in this material may change without notice and may be contrary to opinions expressed by other business areas of UBS as a result of using different assumptions or criteria. UBS is under no obligation to update the Information. UBS, its officers, employees or clients may have or have had an interest in the Instruments and may at any time transact in them. UBS may have or have had a relationship with entities referred to in the Information. Neither UBS nor any of its affiliates, or their officers or employees, accepts any liability for any loss arising from use of the Information. This presentation is not a basis for entering into a transaction. Any transaction between you and UBS will be subject to the detailed provisions of the term sheet, confirmation or electronic matching systems relating to that transaction. Clients wishing to effect transactions should contact their local sales representative.
This information is communicated by UBS AG and/or its affiliates («UBS»). * (see below) UBS may from time to time, as principal or agent, have positions in, or may buy or sell, or make a market in any securities, currencies, financial instruments or other assets underlying the product to which this website relates (the «Structured Product»). UBS may provide investment banking and other services to and/or have officers who serve as directors of the companies referred to in this website. UBS’s trading and/or hedging activities related to the Structured Product may have an impact on the price of the underlying asset and may affect the likelihood that any relevant barrier or relevant trigger event is crossed or triggered. UBS has policies and procedures designed to minimise the risk that officers and employees are influenced by any conflicting interest or duty and that confidential information is improperly disclosed or made available. UBS may pay or receive brokerage or retrocession fees in connection with the Structured Product described herein. In respect of any Structured Product that is a security, UBS may, in certain circumstances, sell the Structured Product to dealers and other financial institutions at a discount to the issue price or rebate to them for their own account some proportion of the issue price. Further information is available on request. Structured Products are complex and may involve a high risk of loss. Prior to purchasing the Structured Product you should consult with your own legal, regulatory, tax, financial and accounting advisors to the extent you consider it necessary, and make your own investment, hedging and trading decisions (including decisions regarding the suitability of the Structured Product) based upon your own judgement and advice from those advisers you consider necessary. Save as otherwise expressly agreed in writing, UBS is not acting as your financial adviser or fiduciary in relation to the Product. UBS generally hedges its exposure to Structured Products, although it may elect not to hedge or to partially hedge any Structured Product. UBS’s hedging activity may be conducted through transactions in the underlying asset, index or instrument or in options, futures or other derivatives related to the underlying asset, index or instrument on publicly traded markets or otherwise, and may have an impact on the price of the under-lying asset. If a transaction is cash settled, UBS will generally unwind or offset any hedge it has for such Structured Product in close proximity to the relevant valuation time or period. In some cases, this activity may affect the value of the Structured Product. Unless stated otherwise in this document, (i) this document is for information purposes only and should not be construed as an offer, personal recommendation or solicitation to purchase the Structured Product and should not be treated as giving investment advice, and (ii) the terms of any investment in the Structured Product will be exclusively subject to the detailed provisions, including risk considerations, contained in the more detailed legal documentation that relates to the Structured Product (being the confirmation, information memorandum, prospectus or other issuer documentation as relevant). UBS makes no representation or warranty relating to any information herein which is derived from independent sources. This document shall not be copied or reproduced without UBS’s prior written permission. In respect of any Structured Product that is a security, no action has been or will be taken in any jurisdiction that would permit a public offering of the Product, save where explicitly stated in the issuer documentation. The Structured Product must be sold in accordance with all applicable selling restrictions in the jurisdictions in which it is sold.
© UBS 2018. All rights reserved. UBS prohibits the forwarding of this information without the approval of UBS.
Weekly Hits: G20 summit & Interesting trio2019-02-15T12:14:12+01:00

Weekly-Hits edition of 23.11.2018

KeyInvest Weekly Hits

Friday, 23.11.2018

  • Topic 1: Consumption - The whole world is in a shopping frenzy
  • Topic 2: Continental & Michelin - More than just black tires

Consumption
The whole world is in a shopping frenzy

The largest shopping event of the year traditionally begins in the US on Thanksgiving. “Black Friday” is not the only day that consumers will be spending billions of dollars again; «Cyber Monday» takes place just three days later and is set to be a huge day for the e-commerce industry. Business could be particularly profitable for Amazon; the company officially kicked off “Cyber Week” on 19 November with new bargains appearing on its site every day. With “Singles› Day” taking place on November 11 in the Middle Kingdom, Chinese Internet companies such as Alibaba are ahead of the Americans – not only in terms of time, but also in terms of volume. Department stores such as Walmart and Target, which also offer their products online, have now also recognized the potential offered by e-commerce. With the Kick-In GOALs in subscription on Alibaba, Amazon and eBay (symbol: KCWUDU) as well as on Target, Walmart and Macy’s (symbol: KCWLDU), investors can invest in the international trading giants with partial protection. In addition to high risk buffers of up to 50%, the products also offer double-digit percentage return opportunities.

The recent discount battle in China was a complete success. The world’s largest shopping event, Singles› Day, was a huge event. Regional giant Alibaba alone sold goods worth the equivalent of USD 30.7 billion during the 24-hour shopping party – a figure which is up 27% on the previous year. The Xinhua news agency reported that Amazon’s Chinese rival generated almost USD 1.5 billion in the first two minutes alone. This could potentially be a good indicator for the upcoming shopping marathon in the US. However, we do not expect the sales figures to be as high. According to the information provided by Adobe Digital Insights, goods worth USD 5 billion were sold on Black Friday last year, with Cyber Monday generating a further USD 6.6 billion. Although these shopping events in the US are not as significant as those in China, this is still an important time for companies. For example, the sales volume recorded by Amazon on Cyber Monday 2017 was not matched on any other day in the year.

The figures provided by eMarketer show how dominant Amazon is. The market researcher has calculated that the e-commerce giant accounts for 49.1% of all online retail spending in the country and 5% of all retail sales. In second place and languishing quite far behind is eBay, with a share of 6.6%. However, bricks and mortar department stores are also among the top ten. Walmart ranks fourth with a 3.7% share of the US e-commerce cake and Macy’s is in eighth position with 1.2%. (Source: eMarketer, July 2018) The world’s largest retailer Walmart is also doing well outside of Black Friday. In the third quarter, group sales increased by 1.4% in comparison with the previous year. For the current 2018/19 financial year (January 31), the company raised its forecast for adjusted earnings per share to USD 4.75 to 4.85 (previously USD 4.65 to 4.80). The forecast for the US business’ organic growth was also raised from “around” to “at least” 3%.

Opportunities: Two new Kick-In GOALs provide investors with the opportunity to take up a promising position in the retail sector. The Kick-In GOAL on Alibaba, Amazon and eBay (symbol: KCWUDU) pays an annual coupon of 11%. The maximum return will be achieved if none of the underlyings fall below the barrier of 54% of their respective initial fixing values over the coming twelve months. The Early Redemption (ER) Worst of Kick-In GOAL (symbol: KCWLDU) on Target, Walmart and Macy’s features even more attractive conditions, with a risk buffer of an impressive 50% and an annual coupon of 12%. Due to the early redemption function, the maximum term can be reduced to twelve months.

Risks: Kick-In GOALs do not have capital protection. If the underlyings equal or fall below the respective kick-in level (barrier) and the early redemption feature does not apply, the amount repaid on the maturity date is reflecting the worst performance of the underlyings (but not more than notional value plus coupon). In this case, it is likely that losses will be incurred. Investors in structured products are also exposed to issuer risk, which means that the capital invested may be lost if UBS AG becomes insolvent, regardless of the performance of the underlying.

More UBS products and further information on the risks and opportunities are available at ubs.com/keyinvest.

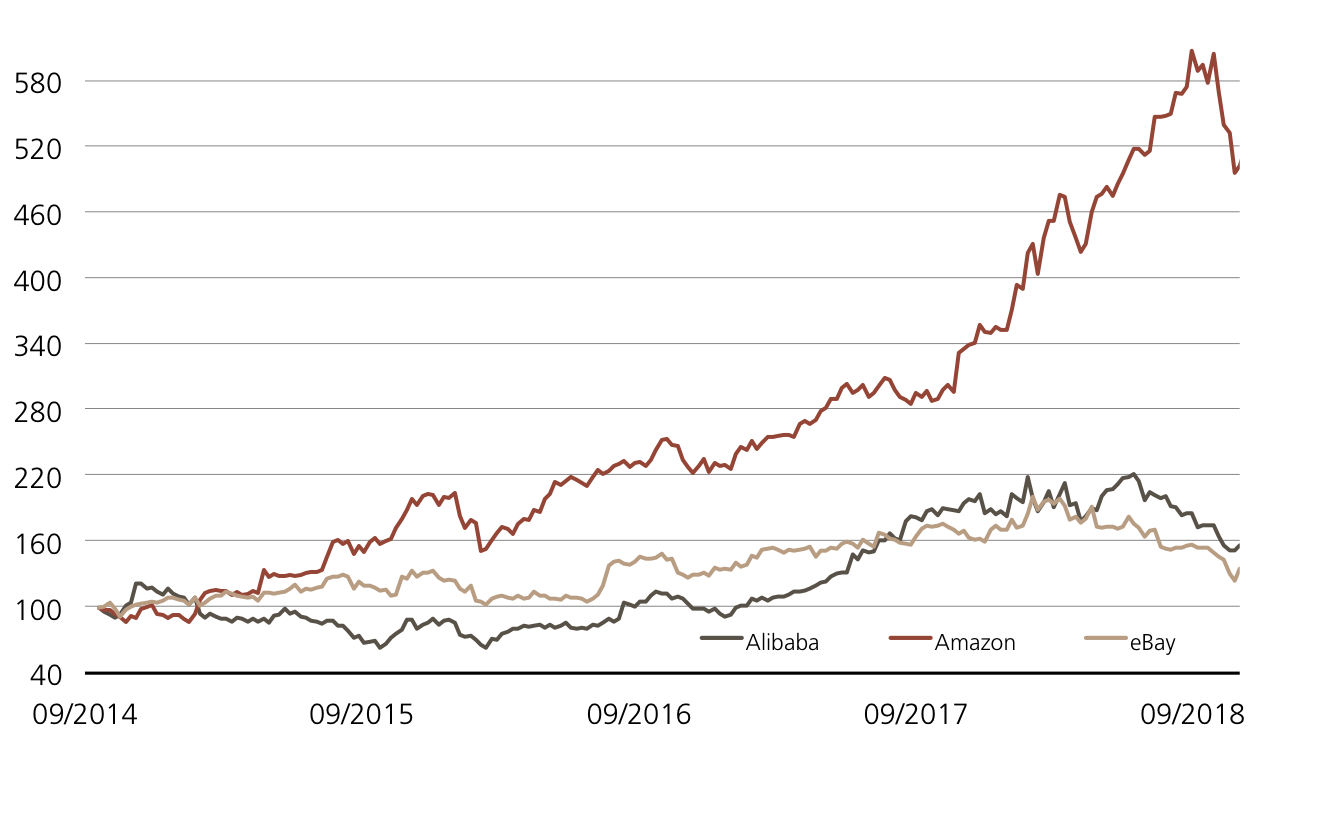
Alibaba vs. Amazon vs. eBay (since the Alibaba IPO on September 19, 2014)¹

In recent years, the Amazon share price has surpassed those of its competitors Alibaba and eBay. This year, the e-commerce giant even broke through the 1 trillion dollar mark in terms of market capitalization.

Source: UBS AG, Bloomberg

As of 21.11.2018

Target vs. Walmart vs. Macy’s (5 years)¹

While the Target and Walmart shares closed the selected five-year period positively, the Macy’s share suffered, falling by 35%.

Source: UBS AG, Bloomberg

As of: 21.11.2018

¹) Please be aware that past performance does not indicate future results.
²) The conditions of ETTs are reviewed on a yearly basis and can be adjusted with a deadline of 13 months after the announcement.

11.00% p.a. Kick-In GOAL on Alibaba, Amazon, eBay

Symbol KCWUDU
SVSP Name Barrier Reverse Convertible
SPVSP Code 1230
Underlying Alibaba, Amazon, eBay
Currency USD
Coupon 11.00% p.a.
Kick-In Level 54%
Expiry 05.12.2019
Issuer UBS AG, London
Subscription until 05.12.2018, 15:00 h
 

12.00% p.a. ER Kick-In GOAL on Target, Walmart, Macy’s

Symbol KCWLDU
SVSP Name Barrier Reverse Convertible
SPVSP Code 1230 (Auto-Callable)
Underlying Target, Walmart, Macy’s
Currency USD
Coupon 12.00% p.a.
Kick-In Level 50%
Expiry 05.06.2020
Issuer UBS AG, London
Subscription until 05.12.2018, 15:00 h
 

More UBS products and further information on the risks and opportunities are available at ubs.com/keyinvest.

Source: UBS AG, Bloomberg

As of: 21.11.2018

Market overview

Index Quotation Week¹
SMI™ 8’841.48 -1.0%
SLI™ 1’368.38 -1.8%
S&P 500™ 2’649.93 -1.9%
Euro STOXX 50™ 3’153.91 -1.6%
S&P™ BRIC 40 3’853.70 1.1%
CMCI™ Compos. 898.76 -1.0%
Gold (troy ounce) 1’228.00 USD 1.5%

¹ Change based on the closing price of the previous day compared to the closing price a week ago.

SMI™ vs. VSMI™ 1 year

smi vs vsmi

The VSMI™ Index is calculated since 2005. It shows the volatility of the stocks within the SMI™ index. A portfolio which reacts only to changes in volatility instead of volatility itself is relevant for the calculation. Thereby, the VSMI™ methodology uses the squared volatility, known as variance, of the SMI options with remaining time to expiry of 30 days traded at the Eurex.

Source: UBS AG, Bloomberg

As of: 21.11.2018

Continental & Michelin
More than just black tires

Temperatures are dropping and the rain is turning into snow – the weather forecast is highlighting that it is high time for car drivers to fit their winter tires. This is a perfect time to take a closer look at tire manufacturers. The two largest producers in Europe are Michelin and Continental, with the French company being the undisputed number one. Unlike Michelin, Continental does not just focus on tires – it is also involved in future technologies such as e-mobility and autonomous driving. Michelin, on the other hand, concentrates its efforts on designing the car tires of the future, with energy efficiency and, above all, a smooth drive being top priorities. Investors can now add the two innovative automotive suppliers to their portfolios with just one investment. The Early Redemption Worst of Kick-In GOAL (symbol: KCVYDU) in subscription on Continental and Michelin comes with appealing conditions. If the barrier remains intact at 59% of the starting prices, the product will yield a maximum return of 7% p.a. in two years at the latest.

Continental’s mix of its tire business and new automotive technology has ensured growth in recent years. Although 2018 will be a year of transition – the forecast has already been reduced twice, partly due to the switch to the new emission regulations – CEO Elmar Degenhart is optimistic nevertheless. “Our sales growth and order intake for automotive electronics are a good sign in view of the weak market environment,” he said in response to the latest figures. The most profitable segment in the first nine months was once again the tire segment, with an operating return of 16.3%. “Thanks in part to the great performance of our winter tires, we expect to exceed last year’s record sales in Europe once again in 2018,” said CFO Wolfgang Schäfer confidently. (Source: Continental press release, November 8, 2018) UBS CIO WM Research currently considers Continental to be the preferred company in the sector; However, the analysts› verdict on competitor Michelin is also to “buy”. (Source: UBS WM Research, November 13, 2018)

Opportunities: Continental and Michelin are currently searching for ground on the stock market. For the Early Redemption Worst of Kick-In GOAL (symbol: KCVYDU) to be profitable, the two underlyings don’t have to make a turnaround. The product allows the underlyings to have a downward margin of almost 41% before the brakes are put on the potential maximum return of 7% p.a. The maximum term of two years can be shortened by a year due to the early redemption function.

Risks: This product does not have capital protection. If the underlyings equal or fall below the respective kick-in level (barrier) and the early redemption feature does not apply, the amount repaid on the maturity date is reflecting the worst performance of the underlyings (but not more than notional value plus coupon). In this case, it is likely that losses will be incurred. Investors in structured products are also exposed to issuer risk, which means that the capital invested may be lost if UBS AG becomes insolvent, regardless of the performance of the underlying.

More UBS products and further information on the risks and opportunities are available at ubs.com/keyinvest.

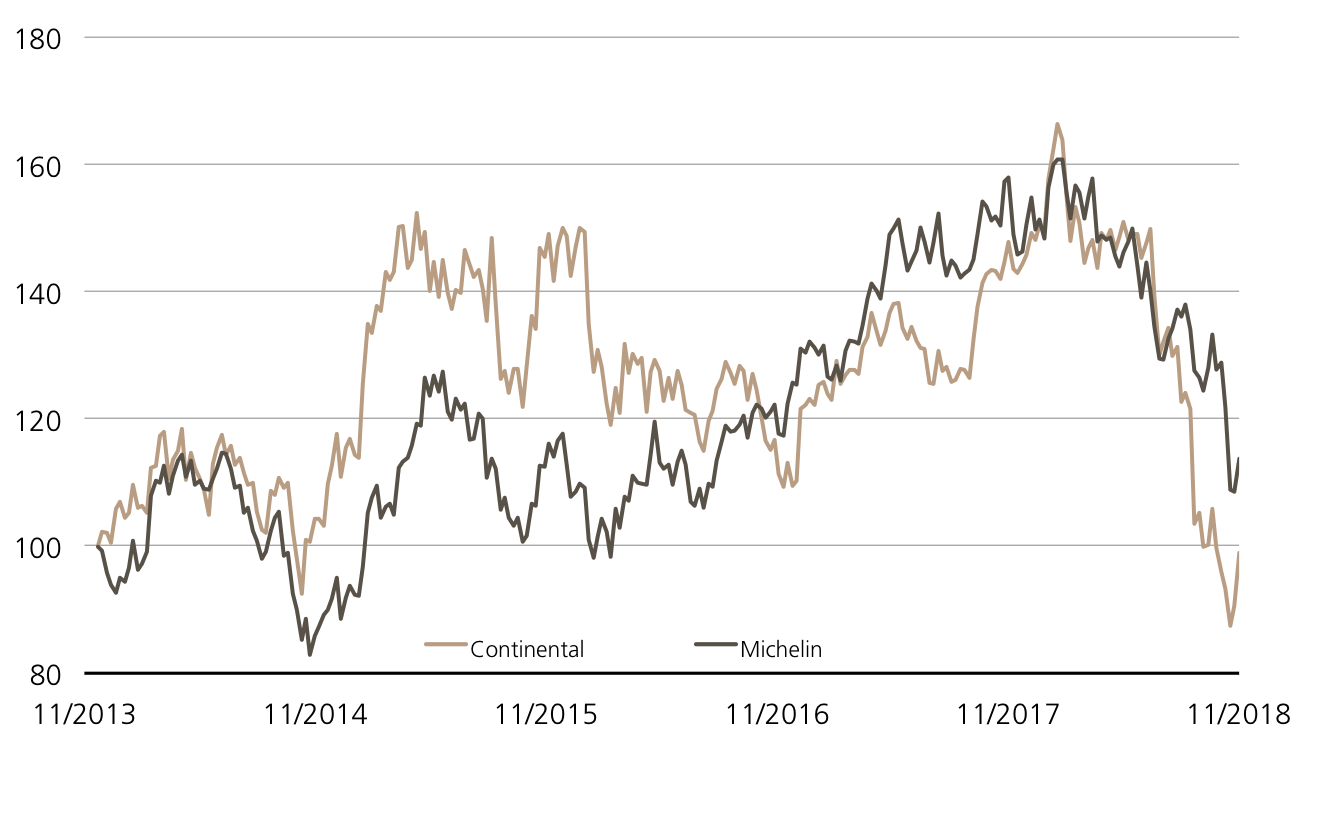
Continental vs. Michelin (5 years)¹

Source: UBS AG, Bloomberg

As of: 21.11.2018

7.00% p.a. ER Kick-In GOAL on Continental, Michelin

Symbol KCVYDU
SVSP Name Barrier Reverse Convertible
SPVSP Code 1230 (Auto-Callable)
Underlyings Continental, Michelin
Currency EUR
Coupon 7.00% p.a.
Kick-In Level 59%
Expiry 30.11.2020
Issuer UBS AG, London
Subscription until 28.11.2018, 15:00 h
 

More UBS products and further information on the risks and opportunities are available at ubs.com/keyinvest.

Source: UBS AG, Bloomberg

As of: 21.11.2018

¹) Please be aware that past performance does not indicate future results.
²) The conditions of ETTs are reviewed on a yearly basis and can be adjusted with a deadline of 13 months after the announcement.
This material has been prepared by UBS AG or one of its affiliates («UBS»). This material is for distribution only as permitted by law. It is not prepared for the needs of any specific recipient. It is published solely for information and is not a solicitation or offer to buy or sell any securities or related financial instruments (“Instruments”). UBS makes no representation or warranty, either express or implied, on the completeness or reliability of the information contained in this document (“Information”) except that concerning UBS AG and its affiliates. The Information should not be regarded by recipients as a substitute for using their own judgment. Any opinions expressed in this material may change without notice and may be contrary to opinions expressed by other business areas of UBS as a result of using different assumptions or criteria. UBS is under no obligation to update the Information. UBS, its officers, employees or clients may have or have had an interest in the Instruments and may at any time transact in them. UBS may have or have had a relationship with entities referred to in the Information. Neither UBS nor any of its affiliates, or their officers or employees, accepts any liability for any loss arising from use of the Information. This presentation is not a basis for entering into a transaction. Any transaction between you and UBS will be subject to the detailed provisions of the term sheet, confirmation or electronic matching systems relating to that transaction. Clients wishing to effect transactions should contact their local sales representative.
This information is communicated by UBS AG and/or its affiliates («UBS»). * (see below) UBS may from time to time, as principal or agent, have positions in, or may buy or sell, or make a market in any securities, currencies, financial instruments or other assets underlying the product to which this website relates (the «Structured Product»). UBS may provide investment banking and other services to and/or have officers who serve as directors of the companies referred to in this website. UBS’s trading and/or hedging activities related to the Structured Product may have an impact on the price of the underlying asset and may affect the likelihood that any relevant barrier or relevant trigger event is crossed or triggered. UBS has policies and procedures designed to minimise the risk that officers and employees are influenced by any conflicting interest or duty and that confidential information is improperly disclosed or made available. UBS may pay or receive brokerage or retrocession fees in connection with the Structured Product described herein. In respect of any Structured Product that is a security, UBS may, in certain circumstances, sell the Structured Product to dealers and other financial institutions at a discount to the issue price or rebate to them for their own account some proportion of the issue price. Further information is available on request. Structured Products are complex and may involve a high risk of loss. Prior to purchasing the Structured Product you should consult with your own legal, regulatory, tax, financial and accounting advisors to the extent you consider it necessary, and make your own investment, hedging and trading decisions (including decisions regarding the suitability of the Structured Product) based upon your own judgement and advice from those advisers you consider necessary. Save as otherwise expressly agreed in writing, UBS is not acting as your financial adviser or fiduciary in relation to the Product. UBS generally hedges its exposure to Structured Products, although it may elect not to hedge or to partially hedge any Structured Product. UBS’s hedging activity may be conducted through transactions in the underlying asset, index or instrument or in options, futures or other derivatives related to the underlying asset, index or instrument on publicly traded markets or otherwise, and may have an impact on the price of the under-lying asset. If a transaction is cash settled, UBS will generally unwind or offset any hedge it has for such Structured Product in close proximity to the relevant valuation time or period. In some cases, this activity may affect the value of the Structured Product. Unless stated otherwise in this document, (i) this document is for information purposes only and should not be construed as an offer, personal recommendation or solicitation to purchase the Structured Product and should not be treated as giving investment advice, and (ii) the terms of any investment in the Structured Product will be exclusively subject to the detailed provisions, including risk considerations, contained in the more detailed legal documentation that relates to the Structured Product (being the confirmation, information memorandum, prospectus or other issuer documentation as relevant). UBS makes no representation or warranty relating to any information herein which is derived from independent sources. This document shall not be copied or reproduced without UBS’s prior written permission. In respect of any Structured Product that is a security, no action has been or will be taken in any jurisdiction that would permit a public offering of the Product, save where explicitly stated in the issuer documentation. The Structured Product must be sold in accordance with all applicable selling restrictions in the jurisdictions in which it is sold.
© UBS 2018. All rights reserved. UBS prohibits the forwarding of this information without the approval of UBS.
Weekly-Hits edition of 23.11.20182018-11-23T12:30:29+01:00

Weekly-Hits edition of 16.11.2018

KeyInvest Weekly Hits

Friday, 16.11.2018

keyinvest Norwegen
  • Topic 1: Norway - Upswing in the far north
  • Topic 2: General Motors / Ford - Car manufacturers with strong figures

Norway
Upswing in the far north

The oil sector has been the main driving force behind the current upswing being enjoyed in Norway. At the same time, the Scandinavian country is benefitting from the flourishing business of the fishing industry. According to the current forecasts of the International Monetary Fund (IMF), Norway’s gross domestic product in 2018 could on the whole grow by more than 2% for the first time since 2012. The ETT (symbol: ETLNO) on the MSCI™ Daily TR Net Norway Index allows investors to take up a diversified position on the equity market of this small economy. With the PERLES (symbol: REUFIU) on the Norway Fish Equity Basket, investors can focus on the country’s second largest export sector.

While Norway attracts millions of tourists every year with its breathtaking fjords, huge glaciers, picturesque villages and modern cities, the country in the far north is also proving attractive for investors. Over the past year, the MSCI™ Daily TR Net Norway Index has recorded positive growth of 2.2%. This sets the Oslo Stock Exchange apart from the European stock market, which is dominated by negative performances.¹ Norway’s outperformance was driven by the oil industry, which is home to Equinor, by far the largest company in the country. The energy multinational, which has operations in more than 30 countries, has just published its figures for the first nine months of 2018. Its quarterly report illustrates how the rise in oil prices during this period had a positive impact on earnings. Standing at USD 13.4 billion, operating earnings for the period from January to September were up 56% on the previous year. Equinor’s operating cash flow after nine months totaled USD 15.5 billion, which means that it has already surpassed the figure recorded in 2017 as a whole. (Source: Equinor Financial Report Q3 2018)

The Norwegian fishing industry has also been flourishing lately. The country’s second most important export sector is benefitting from changing dietary habits among the world’s population, with farm-raised salmon in particular appealing to the taste buds of an ever-increasing number of consumers. In August alone, Norway exported 100,000 tons of the typically pink fish – a new record for the summer month. In the first eight months of the year, the Scandinavians increased total seafood exports by 11% to 1.8 million tons. (Source: Norwegian Seafood Council press release, October 18, 2018) In light of this, it is not surprising that Marine Harvest’s share is trading at record levels.¹ Especially as the world’s largest salmon farmer exceeded expectations in the third quarter in terms of both volume and earnings. (Source: Thomson Reuters media report, October 15, 2018)

Opportunities: Equinor and Marine Harvest are among the heavyweights in the MSCI Daily TR Net Norway Index. In addition to the aforementioned duo, eight other shares are included in the benchmark. According to index provider MSCI, the benchmark thus covers around 85% of the free-float-adjusted market capitalization of the Scandinavian country. The ETT (symbol: ETLNO) tracks the index at a subscription ratio of 100:1. There are usually no ongoing management fees for this product structure.² The dividend payments made by the included companies are reinvested net in the index. In June 2017, UBS launched the PERLES (symbol: REUFIU) on the Norway Fish Equity Basket. The participation product denominated in Norwegian kroner is now trading at 65% above the issue price. The basket includes the industry leader Marine Harvest together with six other shares in Norwegian fisheries.

Risks: The aforementioned products do not have capital protection. Should the underlying assets deliver a negative performance, the ETT and PERLES will incur commensurate losses. Investors in structured products are also exposed to issuer risk, which means that the capital invested may be lost if UBS AG becomes insolvent, regardless of the performance of the underlying.

More UBS products and further information on the risks and opportunities are available at ubs.com/keyinvest.

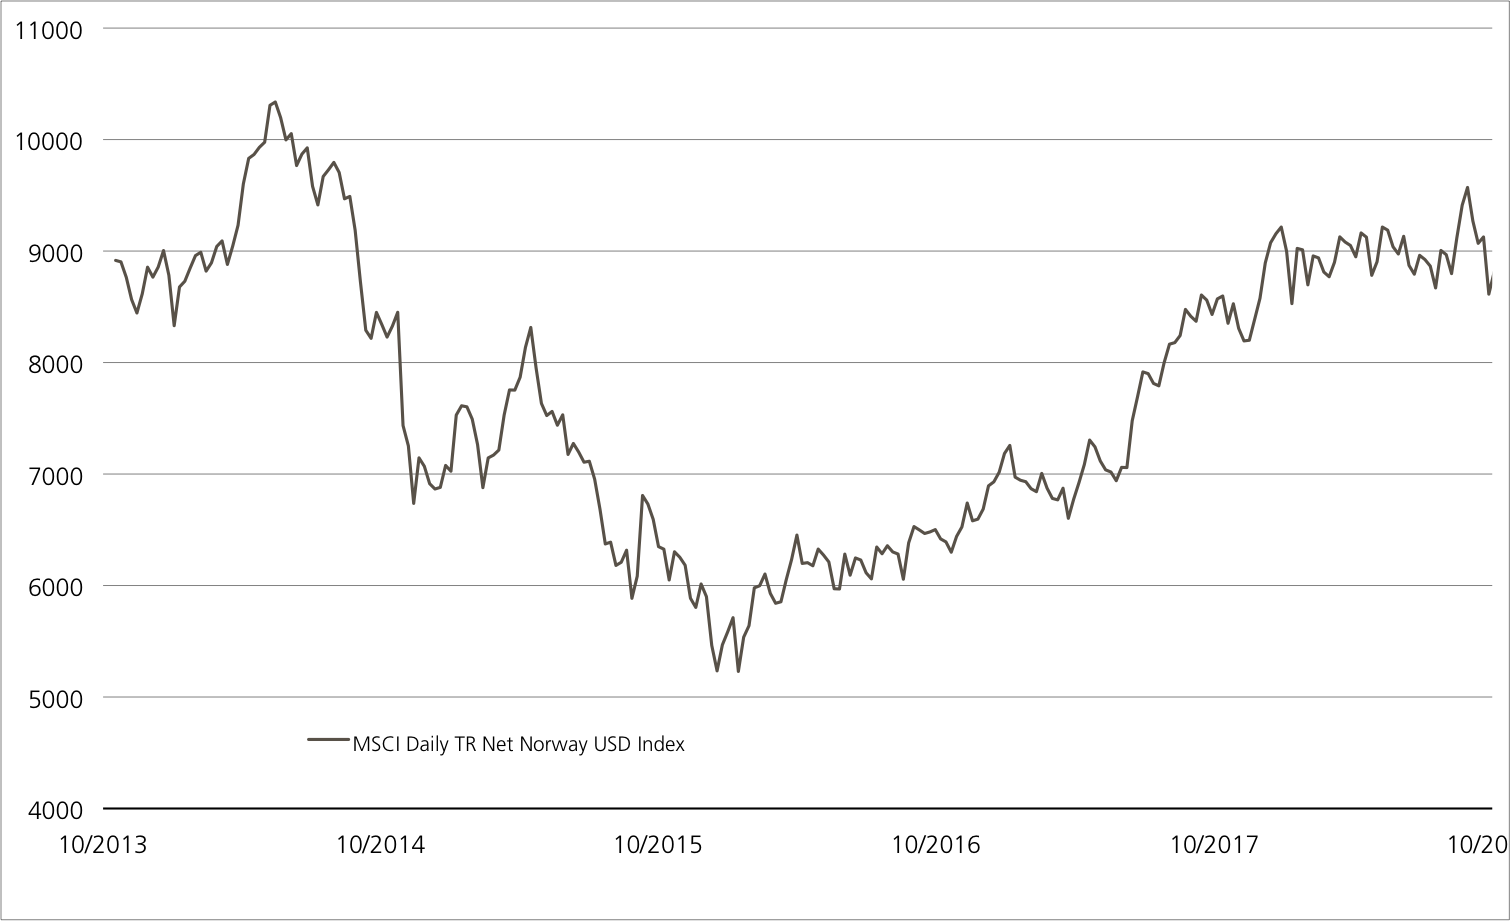
MSCI™ Daily TR Net Norway USD Index 5 years¹

The MSCI™ Daily Norway Index has been trending upwards since the beginning of 2016. At the end of September, the benchmark climbed to its highest level in around four years.

Source: UBS AG, Bloomberg

As of 14.11.2018

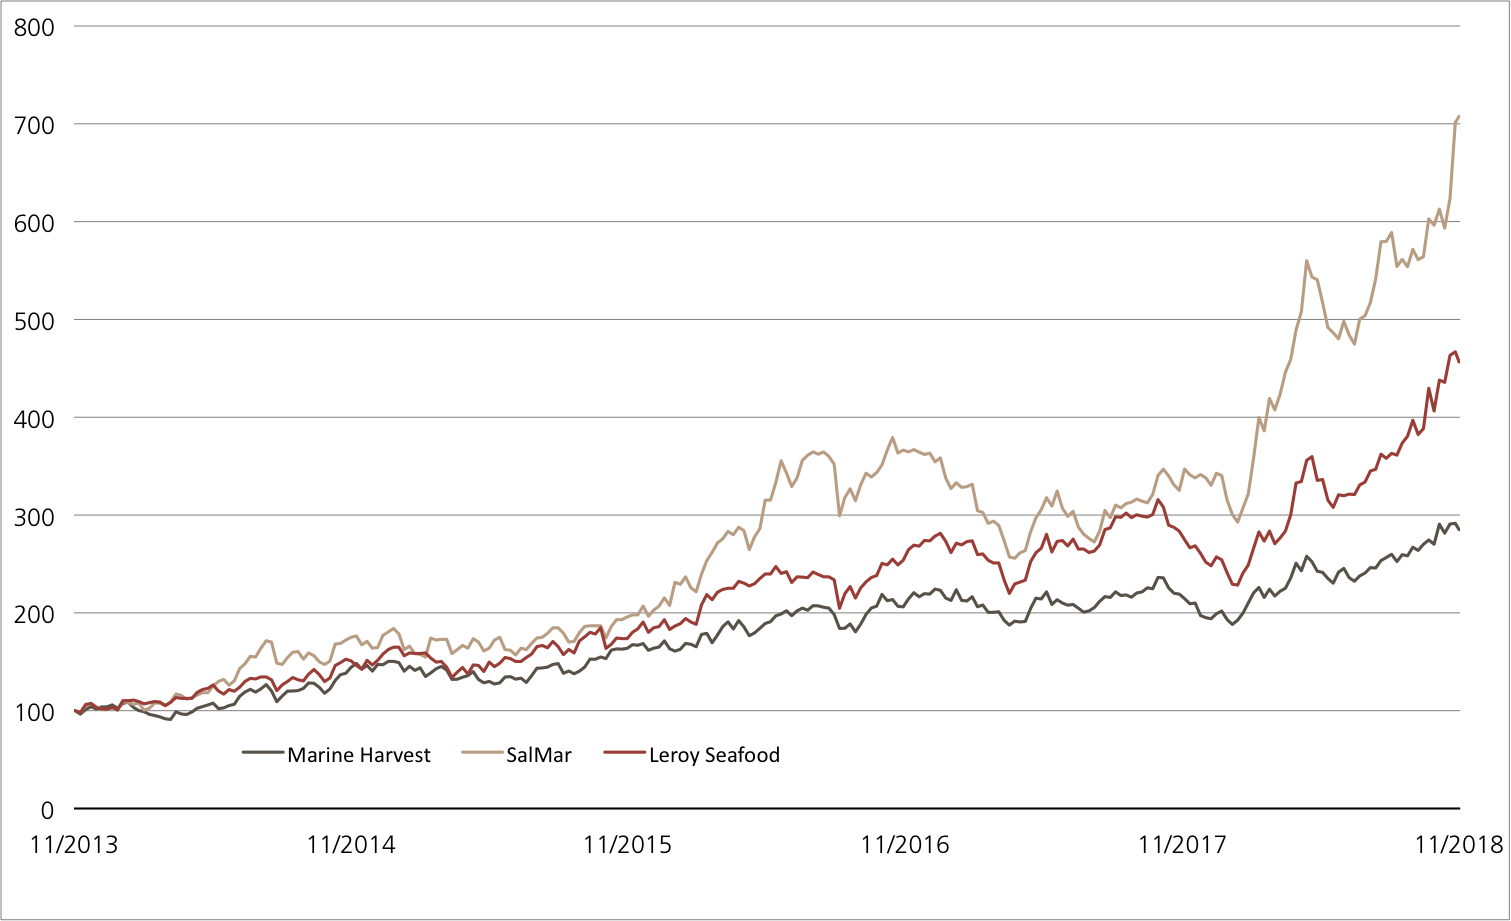
Marine Harvest vs. SalMar vs. Leroy Seafood 5 years¹

Marine Harvest, SalMar and Leroy Seafood are the three largest members of the Norway Fish Equity Basket in terms of market value. In recent years, the trio has made impressive gains.

Source: UBS AG, Bloomberg

As of: 14.11.2018

¹) Please be aware that past performance does not indicate future results.
²) The conditions of ETTs are reviewed on a yearly basis and can be adjusted with a deadline of 13 months after the announcement.
ETT on MSCI™ Daily TR Net Norway USD Index

Symbol ETLNO
SVSP Name Tracker Certifikat
SPVSP Code 1300
Underlying MSCI™ Daily TR Net Norway USD Index 
Currency USD
Ratio 100:1
Administration fee 0.00% p.a.²
Participation 100%
Expiry Open End
Issuer UBS AG, London
Bid/Ask USD 85.00 / 85.45
 

PERLES on Norway Fish Equity Basket

Symbol REUFIU
SVSP Name Tracker Certifikat
SPVSP Code 1300
Underlying Norway Fish Equity Basket
Currency NOK
Ratio 1:1
Participation 100%
Expiry 03.06.2019
Issuer UBS AG, London
Bid/Ask NOK 1’569.00 / 1’585.00 
 

More UBS products and further information on the risks and opportunities are available at ubs.com/keyinvest.

Source: UBS AG, Bloomberg

As of: 14.11.2018

Market overview

Index Quotation Week¹
SMI™ 8’931.20 -1.3%
SLI™ 1’392.78 -2.3%
S&P 500™ 2’701.58 -4.0%
Euro STOXX 50™ 3’205.36 -1.3%
S&P™ BRIC 40 3’812.92 -3.6%
CMCI™ Compos. 907.58 -2.2%
Gold (troy ounce) 1’210.10 USD -1.5%

¹ Change based on the closing price of the previous day compared to the closing price a week ago.

SMI™ vs. VSMI™ 1 year

smi vs vsmi

The VSMI™ Index is calculated since 2005. It shows the volatility of the stocks within the SMI™ index. A portfolio which reacts only to changes in volatility instead of volatility itself is relevant for the calculation. Thereby, the VSMI™ methodology uses the squared volatility, known as variance, of the SMI options with remaining time to expiry of 30 days traded at the Eurex.

Source: UBS AG, Bloomberg

As of: 14.11.2018

General Motors / Ford
Car manufacturers with strong figures

In the car world, off-road vehicles are currently all the rage. This can also be seen in the US registration figures for October. Let’s take Ford as an example – while sales of sedans seemed to be reversing out of the parking lot, SUVs recorded double-digit sales growth and over 70,000 F-Series vehicles were sold for the eighth month in a row. Business at General Motors (GM) is also flourishing thanks to SUVs. In the third quarter, the high-priced models caused operating profits to jump by 25%. Stock exchange speculators are clapping their hands with glee at the moment, as both shares have achieved double-digit percentage growth in the past four weeks.¹ The new Worst of Kick-In GOAL (symbol: KCVNDU) on the two automotive companies does not require the growth in share prices to pick up any further. The product offers an annual coupon of 10% and a risk buffer of 40% should the prices move sideways.

Not only did GM record greater earnings than expected in the third quarter, but the car manufacturer also narrowed its annual targets. The upper end of the USD 5.80 to 6.20 range for adjusted pre-tax earnings per share is now expected to be achieved in 2018. To ensure that the Group can continue making such high profits in the future, cuts are being made, with 18,000 of the 50,000 employees in North America having recently received a severance offer. As revealed in Ford’s latest quarterly report, the car manufacturer has also outperformed market forecasts. The company is still in the midst of a corporate restructuring, but this should pay off soon. Chief Financial Officer Bob Shanks confirmed the pre-tax margin target of 8% when presenting the quarterly figures. However, this will probably not be possible by 2020 as was announced. In addition, the company is investigating the opportunities presented by “the car of the future”. According to a media report, Ford is currently in discussions with VW to work together on the costly development of autonomous driving technology and electric cars. Although nothing has yet been decided, a Ford spokesman stated that the US group’s letter of intent with VW included discussions on potential collaborations in a number of areas. (Source: Thomson Reuters media report, October 31, 2018).

Opportunities: In order to generate a profit with the Worst of Kick-In GOAL (Symbol: KCVNDU), the share prices of Ford and GM only need to trend sideways. The product in subscription pays an annual coupon of 10% regardless of price performance. The repayment of the nominal is, however, linked to the underlyings. If none of the shares fall level with or below the barrier of 60% of the initial fixings, investors will remain safe from losses.

Risks: Worst-of Kick-In GOALs do not have capital protection. If the underlyings of the Kick-In GOAL touch or fall below the respective Kick-In Level (barrier), the amount repaid on the maturity date is reflecting the worst performance of the underlyings (but not more than notional value plus coupon). In this case, it is likely that losses will be incurred. Investors in structured products are also exposed to issuer risk, which means that the capital invested may be lost if UBS AG becomes insolvent, regardless of the performance of the underlying.

More UBS products and further information on the risks and opportunities are available at ubs.com/keyinvest.

General Motors vs. Ford Motor 5 years¹

Source: UBS AG, Bloomberg

As of: 14.11.2018

10.00% p.a. Worst of Kick-In GOAL on General Motors / Ford

Symbol KCVNDU
SVSP Name Barrier Reverse Convertible
SPVSP Code 1230
Underlyings General Motors / Ford
Currency USD
Coupon 10.00% p.a.
Kick-In Level 60.00%
Expiry 21.11.2019
Issuer UBS AG, London
Subscription until 21.11.2018, 15:00 h
 

More UBS products and further information on the risks and opportunities are available at ubs.com/keyinvest.

Source: UBS AG, Bloomberg

As of: 14.11.2018

¹) Please be aware that past performance does not indicate future results.
²) The conditions of ETTs are reviewed on a yearly basis and can be adjusted with a deadline of 13 months after the announcement.

This material has been prepared by UBS AG or one of its affiliates («UBS»). This material is for distribution only as permitted by law. It is not prepared for the needs of any specific recipient. It is published solely for information and is not a solicitation or offer to buy or sell any securities or related financial instruments (“Instruments”). UBS makes no representation or warranty, either express or implied, on the completeness or reliability of the information contained in this document (“Information”) except that concerning UBS AG and its affiliates. The Information should not be regarded by recipients as a substitute for using their own judgment. Any opinions expressed in this material may change without notice and may be contrary to opinions expressed by other business areas of UBS as a result of using different assumptions or criteria. UBS is under no obligation to update the Information. UBS, its officers, employees or clients may have or have had an interest in the Instruments and may at any time transact in them. UBS may have or have had a relationship with entities referred to in the Information. Neither UBS nor any of its affiliates, or their officers or employees, accepts any liability for any loss arising from use of the Information. This presentation is not a basis for entering into a transaction. Any transaction between you and UBS will be subject to the detailed provisions of the term sheet, confirmation or electronic matching systems relating to that transaction. Clients wishing to effect transactions should contact their local sales representative.
This information is communicated by UBS AG and/or its affiliates («UBS»). * (see below) UBS may from time to time, as principal or agent, have positions in, or may buy or sell, or make a market in any securities, currencies, financial instruments or other assets underlying the product to which this website relates (the «Structured Product»). UBS may provide investment banking and other services to and/or have officers who serve as directors of the companies referred to in this website. UBS’s trading and/or hedging activities related to the Structured Product may have an impact on the price of the underlying asset and may affect the likelihood that any relevant barrier or relevant trigger event is crossed or triggered. UBS has policies and procedures designed to minimise the risk that officers and employees are influenced by any conflicting interest or duty and that confidential information is improperly disclosed or made available. UBS may pay or receive brokerage or retrocession fees in connection with the Structured Product described herein. In respect of any Structured Product that is a security, UBS may, in certain circumstances, sell the Structured Product to dealers and other financial institutions at a discount to the issue price or rebate to them for their own account some proportion of the issue price. Further information is available on request. Structured Products are complex and may involve a high risk of loss. Prior to purchasing the Structured Product you should consult with your own legal, regulatory, tax, financial and accounting advisors to the extent you consider it necessary, and make your own investment, hedging and trading decisions (including decisions regarding the suitability of the Structured Product) based upon your own judgement and advice from those advisers you consider necessary. Save as otherwise expressly agreed in writing, UBS is not acting as your financial adviser or fiduciary in relation to the Product. UBS generally hedges its exposure to Structured Products, although it may elect not to hedge or to partially hedge any Structured Product. UBS’s hedging activity may be conducted through transactions in the underlying asset, index or instrument or in options, futures or other derivatives related to the underlying asset, index or instrument on publicly traded markets or otherwise, and may have an impact on the price of the under-lying asset. If a transaction is cash settled, UBS will generally unwind or offset any hedge it has for such Structured Product in close proximity to the relevant valuation time or period. In some cases, this activity may affect the value of the Structured Product. Unless stated otherwise in this document, (i) this document is for information purposes only and should not be construed as an offer, personal recommendation or solicitation to purchase the Structured Product and should not be treated as giving investment advice, and (ii) the terms of any investment in the Structured Product will be exclusively subject to the detailed provisions, including risk considerations, contained in the more detailed legal documentation that relates to the Structured Product (being the confirmation, information memorandum, prospectus or other issuer documentation as relevant). UBS makes no representation or warranty relating to any information herein which is derived from independent sources. This document shall not be copied or reproduced without UBS’s prior written permission. In respect of any Structured Product that is a security, no action has been or will be taken in any jurisdiction that would permit a public offering of the Product, save where explicitly stated in the issuer documentation. The Structured Product must be sold in accordance with all applicable selling restrictions in the jurisdictions in which it is sold.
© UBS 2018. All rights reserved. UBS prohibits the forwarding of this information without the approval of UBS.
Weekly-Hits edition of 16.11.20182018-11-16T09:00:48+01:00

Weekly-Hits edition of 09.11.2018

KeyInvest Weekly Hits

Friday, 09.11.2018

  • Topic 1: European industrials - A multifaceted sector
  • Topic 2: Henkel/Beiersdorf/L’Oréal - Staying in step with consumers

European industrials
A multifaceted sector

UBS CIO GWM identifies the geopolitical uncertainty factors mainly responsible for the current weak performance of the stock markets in the European Monetary Union (EMU). Looking to the future, experts recommend a neutral weighting within the eurozone countries. Industrial equities are overweight in terms of sector allocation. The ETT (symbol: ETIND) on the STOXX™ Europe 600 Industrial Goods & Services Index allows for a corresponding weighting, as the open end product tracks the performance of the industry benchmark. In contrast, the Early Redemption (ER) Worst of Kick-In GOAL (symbol: KCUGDU) is geared towards the Alstom, Siemens and thyssenkrupp equities delivering a relatively stable performance. Provided none of the industrials touch or fall below the barrier of 59% of their respective initial prices, investors will receive a maximum return of 7% upon maturity.

Bert Jansen, Strategist at UBS CIO GWM, notes that sector momentum has always been the main driver for eurozone equity markets in the past. He attests that it has always been more important than country-specific factors. According to Jansen, however, an exception to this rule is Italy, as the equity market in the southern European country is strongly geared to the financial sector. The country’s rather lax budgetary discipline is negatively impacting share prices accordingly. Since a large part of the negative sentiment is now likely to be priced in, Italy – like other EU members – will receive a neutral weighting in the country allocation. In terms of sectors, CIO GWM is pursuing a largely balanced mix of cyclical and non-cyclical sectors for the eurozone. An overweight is being maintained in the energy and industry sectors. (Source: UBS CIO GWM, UBS House View Weekly, Regional View Europe, October 29, 2018)

Naturally, the second sector has been particularly exposed to the trade dispute that has prevailed as one of the main factors for market uncertainty in 2018. It is therefore not surprising that the STOXX™ Europe 600 Industrial Goods & Services Index was included in the wave of sales in October. Fundamentally, however, the sector continues to grow. Despite a downward trend, the Purchasing Managers› Index for industry calculated by Markit, for example, remained above the expansionary threshold of 50 in September. In addition to the robust global economy, megatrends such as robotics and automation, energy efficiency and growing air traffic should play into the hands of the sector.

Opportunities: The Exchange Traded Tracker (ETT) (symbol: ETIND) allows investors to diversify their positions. The underlying STOXX™ Europe 600 Industrial Goods & Services Index currently comprises 100 companies. In terms of weighting, Siemens leads the way. Besides the German group, Alstom is also on CIO GWM’s current most preferred list for European industrials. Together with thyssenkrupp, the duo forms the basis for a new ER Worst of Kick-In GOAL (symbol: KCUGDU). Investors can expect a fixed coupon payment of 7% p.a. with this issue. This return opportunity comes with a 41% safety buffer. As part of the early redemption function, the underlyings will be put to the test for the first time on November 14, 2019. Should the three shares close at or above their respective initial prices on this date or one of the other quarterly observation days, investors will receive the nominal amount plus the pro rata coupon early.

Risks: The aforementioned products do not have capital protection. Should the underlying assets deliver a negative performance, the ETT will incur commensurate losses. If the underlyings of the Kick-In GOAL touch or fall below the respective Kick-In Level (barrier) and the early redemption feature does not apply, the amount repaid on the maturity date is reflecting the worst performance of the underlyings (but not more than notional value plus coupon). In this case, it is likely that losses will be incurred. Investors in structured products are also exposed to issuer risk, which means that the capital invested may be lost if UBS AG becomes insolvent, regardless of the performance of the underlying.

More UBS products and further information on the risks and opportunities are available at ubs.com/keyinvest.

STOXX™ Europe 600 Industrial Goods & Services Index vs. STOXX™ Europe 600 Index 5 years¹

After the recent setback, Europe’s industrials have been unable to break out of their current sideways trend. However, the sector is still ahead of the general market.

Source: UBS AG, Bloomberg

As of 08.11.2018

Alstom vs. Siemens vs. thyssenkrupp 5 years¹

Alstom is defying the difficult market environment. Thanks to its recent outperformance, the French industrial rocketed past the German large caps Siemens and thyssenkrupp in the five-year ranking.

Source: UBS AG, Bloomberg

As of: 08.11.2018

¹) Please be aware that past performance does not indicate future results.
²) The conditions of ETTs are reviewed on a yearly basis and can be adjusted with a deadline of 13 months after the announcement.
ETT on STOXX™ Europe 600 Industrial Goods & Services NR Index

Symbol ETIND
SVSP Name Tracker Certifikat
SPVSP Code 1300
Underlying STOXX™ Europe 600 Industrial Goods & Services Net Return Index
Currency EUR
Ratio 1:1
Administration fee 0.00% p.a.²
Participation 100%
Expiry Open End
Issuer UBS AG, London
Bid/Ask EUR 922.50 / 927.50
 

7.00% p.a. ER Worst of Kick-In GOAL on Alstom / Siemens / thyssenkrupp

Symbol KCUGDU
SVSP Name Barrier Reverse Convertible
SPVSP Code 1230 (Auto-Callable)
Underlying Alstom / Siemens / thyssenkrupp
Currency EUR
Coupon 7.00% p.a.
Kick-In Level 59.00%
Expiry 15.05.2020
Issuer UBS AG, London
Subscription until 14.11.2018, 15:00 h
 

More UBS products and further information on the risks and opportunities are available at ubs.com/keyinvest.

Source: UBS AG, Bloomberg

As of: 08.11.2018

Market overview

Index Quotation Week¹
SMI™ 9’050.53 0.3%
SLI™ 1’425.81 0.4%
S&P 500™ 2’813.89 3.8%
Euro STOXX 50™ 3’246.66 1.5%
S&P™ BRIC 40 3’954.66 4.4%
CMCI™ Compos. 928.33 0.0%
Gold (troy ounce) 1’228.70 USD 1.1%

¹ Change based on the closing price of the previous day compared to the closing price a week ago.

SMI™ vs. VSMI™ 1 year

smi vs vsmi

The VSMI™ Index is calculated since 2005. It shows the volatility of the stocks within the SMI™ index. A portfolio which reacts only to changes in volatility instead of volatility itself is relevant for the calculation. Thereby, the VSMI™ methodology uses the squared volatility, known as variance, of the SMI options with remaining time to expiry of 30 days traded at the Eurex.

Source: UBS AG, Bloomberg

As of: 08.11.2018

Henkel/Beiersdorf/L’Oréal
Staying in step with consumers

With just a few weeks to go before Christmas, consumers around the globe are in a spending mood – in the US, consumer sentiment has recently reached its highest level since the turn of the millennium. The current indicators are likely to delight Henkel, Beiersdorf and L’Oréal. UBS is using the shares of the three leading consumer goods manufacturers as the underlyings for a new issue. The Callable Worst of Kick-In GOAL (symbol: KCUDDU) has a 6% annual coupon, while the barriers are set at 60% of each of the initial share prices.

The latest figures from L’Oréal show that consumers in Asia are also really in the mood to buy. In the second quarter of 2018, the French cosmetics manufacturer recorded sales growth of 7.5% on a comparable basis, which resulted in the company exceeding the average analysts› expectations. In Asia, demand was particularly strong for skincare products such as anti-aging creams. According to CEO Jean-Paul Agon, the group is growing rapidly, especially in China where the boom in luxury products persists. In this key segment, L’Oréal is represented by Yves Saint Laurent’s make-up products, among other items.

Beiersdorf published its quarterly figures on the same day as the French company. The cosmetics group increased sales organically 6% over the first nine months of 2018. The North Germans also enjoyed flourishing growth in the luxury segment, with sales of the La Prairie brand skyrocketing by 46.7%. Beiersdorf also recorded significant growth in the adhesives segment with the Tesa brand. (Source: Thomson Reuters media reports, October 30, 2018) Adhesives and sealants are also among Henkel’s core competencies. The DAX™ company is also active in the body care segment, as well as in detergents and cleaning agents. On November 15, investors can find out how Henkel has performed recently.

Opportunities: Should the Henkel, Beiersdorf and L’Oréal share prices largely remain stable, this should prove sufficient for the investment in the Callable Worst of Kick-In GOAL (symbol: KCUDDU) to pay off. All that is required is that none of the three shares touch or fall below the low barrier of 60% of the respective initial prices. Since the annual coupon of 6% is paid out in any case, the corresponding maximum return would then be achieved upon maturity. Please note that the issuer has a call option. If it makes use of this call option on one of the dates provided for this purpose, the pro rata coupon will be repaid early in addition to the nominal value.

Risks: Worst-of Kick-In GOALs do not have capital protection. If the underlyings of the Kick-In GOAL touch or fall below the respective Kick-In Level (barrier) and the callable feature does not apply, the amount repaid on the maturity date is reflecting the worst performance of the underlyings (but not more than notional value plus coupon). In this case, it is likely that losses will be incurred. Investors in structured products are also exposed to issuer risk, which means that the capital invested may be lost if UBS AG becomes insolvent, regardless of the performance of the underlying.

More UBS products and further information on the risks and opportunities are available at ubs.com/keyinvest.

Henkel vs. Beiersdorf vs. Loréal five years¹

Source: UBS AG, Bloomberg

As of: 08.11.2018

6.00% p.a. Callable Worst of Kick-In GOAL on Henkel / Beiersdorf / L’Oréal

Symbol KCUDDU
SVSP Name Barrier Reverse Convertible
SPVSP Code 1230 (Callable)
Underlyings Henkel / Beiersdorf / L’Oréal
Currency EUR
Coupon 6.00% p.a.
Kick-In Level 60.00%
Expiry 16.11.2020
Issuer UBS AG, London
Subscription until 14.11.2018, 15:00 h
 

More UBS products and further information on the risks and opportunities are available at ubs.com/keyinvest.

Source: UBS AG, Bloomberg

As of: 08.11.2018

¹) Please be aware that past performance does not indicate future results.
²) The conditions of ETTs are reviewed on a yearly basis and can be adjusted with a deadline of 13 months after the announcement.
This material has been prepared by UBS AG or one of its affiliates («UBS»). This material is for distribution only as permitted by law. It is not prepared for the needs of any specific recipient. It is published solely for information and is not a solicitation or offer to buy or sell any securities or related financial instruments (“Instruments”). UBS makes no representation or warranty, either express or implied, on the completeness or reliability of the information contained in this document (“Information”) except that concerning UBS AG and its affiliates. The Information should not be regarded by recipients as a substitute for using their own judgment. Any opinions expressed in this material may change without notice and may be contrary to opinions expressed by other business areas of UBS as a result of using different assumptions or criteria. UBS is under no obligation to update the Information. UBS, its officers, employees or clients may have or have had an interest in the Instruments and may at any time transact in them. UBS may have or have had a relationship with entities referred to in the Information. Neither UBS nor any of its affiliates, or their officers or employees, accepts any liability for any loss arising from use of the Information. This presentation is not a basis for entering into a transaction. Any transaction between you and UBS will be subject to the detailed provisions of the term sheet, confirmation or electronic matching systems relating to that transaction. Clients wishing to effect transactions should contact their local sales representative.
This information is communicated by UBS AG and/or its affiliates («UBS»). * (see below) UBS may from time to time, as principal or agent, have positions in, or may buy or sell, or make a market in any securities, currencies, financial instruments or other assets underlying the product to which this website relates (the «Structured Product»). UBS may provide investment banking and other services to and/or have officers who serve as directors of the companies referred to in this website. UBS’s trading and/or hedging activities related to the Structured Product may have an impact on the price of the underlying asset and may affect the likelihood that any relevant barrier or relevant trigger event is crossed or triggered. UBS has policies and procedures designed to minimise the risk that officers and employees are influenced by any conflicting interest or duty and that confidential information is improperly disclosed or made available. UBS may pay or receive brokerage or retrocession fees in connection with the Structured Product described herein. In respect of any Structured Product that is a security, UBS may, in certain circumstances, sell the Structured Product to dealers and other financial institutions at a discount to the issue price or rebate to them for their own account some proportion of the issue price. Further information is available on request. Structured Products are complex and may involve a high risk of loss. Prior to purchasing the Structured Product you should consult with your own legal, regulatory, tax, financial and accounting advisors to the extent you consider it necessary, and make your own investment, hedging and trading decisions (including decisions regarding the suitability of the Structured Product) based upon your own judgement and advice from those advisers you consider necessary. Save as otherwise expressly agreed in writing, UBS is not acting as your financial adviser or fiduciary in relation to the Product. UBS generally hedges its exposure to Structured Products, although it may elect not to hedge or to partially hedge any Structured Product. UBS’s hedging activity may be conducted through transactions in the underlying asset, index or instrument or in options, futures or other derivatives related to the underlying asset, index or instrument on publicly traded markets or otherwise, and may have an impact on the price of the under-lying asset. If a transaction is cash settled, UBS will generally unwind or offset any hedge it has for such Structured Product in close proximity to the relevant valuation time or period. In some cases, this activity may affect the value of the Structured Product. Unless stated otherwise in this document, (i) this document is for information purposes only and should not be construed as an offer, personal recommendation or solicitation to purchase the Structured Product and should not be treated as giving investment advice, and (ii) the terms of any investment in the Structured Product will be exclusively subject to the detailed provisions, including risk considerations, contained in the more detailed legal documentation that relates to the Structured Product (being the confirmation, information memorandum, prospectus or other issuer documentation as relevant). UBS makes no representation or warranty relating to any information herein which is derived from independent sources. This document shall not be copied or reproduced without UBS’s prior written permission. In respect of any Structured Product that is a security, no action has been or will be taken in any jurisdiction that would permit a public offering of the Product, save where explicitly stated in the issuer documentation. The Structured Product must be sold in accordance with all applicable selling restrictions in the jurisdictions in which it is sold.
© UBS 2018. All rights reserved. UBS prohibits the forwarding of this information without the approval of UBS.
Weekly-Hits edition of 09.11.20182018-11-09T13:21:10+01:00

Weekly-Hits edition of 02.11.2018

KeyInvest Weekly Hits

Friday, 02.11.2018

  • Topic 1: US Information Technology - The Moment of Truth
  • Topic 2: Industrial metals - A steely trio

US Information Technology
The Moment of Truth

The reporting season on Wall Street is in full swing. Quarterly results from Apple out this Thursday (after the US market closes) mark the high point of the current slew of numbers. Even though the figures we have already seen from the US tech sector have mostly been ahead of expectations, prices have been under pressure recently. The S&P 500™ Information Technology Index has fallen by 10.9% from all its all-time high at the start of the month.1 Investors who see this setback as a chance to get on board can use an ETT (symbol: ETINFU). The participation product replicates the S&P 500™ Information Technology Index with no time limitation and no management fees.2 An alternative to a 1:1 investment in the US IT sector is the Early Redemption (ER) Worst of Kick-In GOAL on Alphabet, Microsoft and Apple. The subscription product has a 9.5% annual coupon. The barriers are set at a low 60% of the initial prices of the sector trio.

Soon after the closing bell on Wall Street, on Thursday evening (after editorial deadline) a release from Apple will come over the ticker. The world’s largest listed company is announcing its results for the fourth quarter of its fiscal year 2017/2018 (to 30 September). CEO Tim Cook and his management team will also be holding a conference call at 10:00pm CET to talk in detail about recent business performance and the outlook for the key Christmas quarter. The sheer size alone of the iPhone manufacturer means the quarterly numbers are hugely important for Wall Street.

According to FactSet, profit announcements from IT companies in the earnings season so far have in general been one-tenth ahead of average analyst expectations. Of all sectors in the US, information technology has shown the second-largest beats. In the trading week to 26 October, consensus forecast earnings growth for the third quarter rose from 17.0% to 21.9%. Microsoft and Intel had a major influence on the upgrade. The two groups reported earnings per share for the past quarter 18.8% and 21.7% ahead of expectations respectively. (Source: FactSet, Earnings Insight, 26 October 2018.)

Opportunities: The exchange traded tracker (ETT) (symbol: ETINFU) passively replicates the 65 stocks in the S&P 500™ Information Technology Index. Investors can use the liquid product to anticipate a rebound in the sector benchmark. A longer-term buy and hold strategy is also possible. Alphabet, along with Apple and Microsoft, is one of the underlyings for a new ER Worst of Kick-In GOAL (symbol: KCTKDU). An index reshuffle recently removed the Google parent company from the IT sector and put it in communication services. This has no impact on the opportunities for the subscription product: as long as none of the underlyings touch or fall below the 60% barrier, the investment ends with an annual return of 9.50%. The early redemption feature means early repayment with pro rata coupon is possible. This is conditional on all of Alphabet, Apple and Microsoft closing at or above the starting level on one of the quarterly observation days (first date: 7 November 2019).

Risks: The aforementioned products do not have capital protection. Should the underlying assets deliver a negative performance; the ETT will incur commensurate losses. If the underlyings on the Kick-In GOAL touch or fall below the respective Kick-In Level (barrier) and the early redemption feature does not apply, the amount repaid on the maturity date is reflecting the worst performance of the underlyings (but not more than notional value plus coupon). In this case, it is likely that losses will be incurred. Investors in structured products are also exposed to issuer risk, which means that the capital invested may be lost if UBS AG becomes insolvent, regardless of the performance of the underlying.

More UBS products and further information on the risks and opportunities are available at ubs.com/keyinvest.

S&P 500™ Information Technology Index vs. S&P 500™ Index five years¹

Over the last five year, the IT sector has outperformed the broad US equity market by a considerable distance. The most recent correction has done little to reduce this massive differential.

Source: UBS AG, Bloomberg

As of 01.11.2018

Alphabet A vs. Microsoft vs. Apple five years¹

Microsoft enjoys a run: over five years the software stock has even done slightly better than Apple. Google
parent company Alphabet can no longer keep up with those two.

Source: UBS AG, Bloomberg

As of: 01.11.2018

¹) Please be aware that past performance does not indicate future results.
²) The conditions of ETTs are reviewed on a yearly basis and can be adjusted with a deadline of 13 months after the announcement.
ETT on S&P 500™ Information Technology Index

Symbol ETINFU
SVSP Name Tracker Certifikat
SPVSP Code 1300
Underlying S&P 500™ Information Technology Index
Currency USD
Ratio 1:1
Administration fee 0.00% p.a.²
Participation 100%
Expiry Open End
Issuer UBS AG, London
Bid/Ask USD 1’213.00 / 1’215.00
 

9.50% p.a. ER Worst of Kick-In GOAL auf Alphabet / Microsoft / Apple

Symbol KCTKDU
SVSP Name Barrier Reverse Convertible
SPVSP Code 1230 (Auto-Callable)
Underlying Alphabet A / Microsoft / Apple 
Currency USD
Coupon 9.50% p.a.
Kick-In Level 60.00%
Expiry 23.10.2020
Issuer UBS AG, London
Subscription until 07.11.2018, 15:00 h
 

More UBS products and further information on the risks and opportunities are available at ubs.com/keyinvest.

Source: UBS AG, Bloomberg

As of: 01.11.2018

Market overview

Index Quotation Week¹
SMI™ 9’022.16 3.4%
SLI™ 1’420.48 4.6%
S&P 500™ 2’711.74 2.1%
Euro STOXX 50™ 3197.51 2.1%
S&P™ BRIC 40 3’787.34 1.1%
CMCI™ Compos. 928.22 -2.2%
Gold (troy ounce) 1’215.00 USD -1.3%

¹ Change based on the closing price of the previous day compared to the closing price a week ago.

SMI™ vs. VSMI™ 1 year

smi vs vsmi

The VSMI™ Index is calculated since 2005. It shows the volatility of the stocks within the SMI™ index. A portfolio which reacts only to changes in volatility instead of volatility itself is relevant for the calculation. Thereby, the VSMI™ methodology uses the squared volatility, known as variance, of the SMI options with remaining time to expiry of 30 days traded at the Eurex.

Source: UBS AG, Bloomberg

As of: 01.11.2018

Industrial metals
A steely trio

The commodity market overall has been stable year to date, but industrial metals stocks are mostly down. The segment has been hit by concerns about an economic slowdown as a result of the burgeoning trade dispute. Although actual demand for metal continues to be robust, stocks in the sector are under pressure. UBS has combined three sector representatives (US Steel, ArcelorMittal and Rio Tinto) in a Callable Worst of Kick-In GOAL (symbol: KCTUDU). The product pays an annual coupon of 11.00% regardless of price performance. This opportunity comes with a 46% safety buffer.

On 16 October, the World Steel Association published its short-term market outlook. They assume that global demand for steel will rise by 3.9% to 1,657.9 million tonnes this year. In 2019, the market will grow a further 1.4% to 1,681.2 million tonnes. Not surprisingly, the 2018 forecast sees the largest increase in demand in emerging markets. Growth in Asia-Oceania, the largest market for sales due to Chinese demand, is expected to be 5.0%. However, the association also points out that risks have risen too, mentioning rising trade tensions and volatile exchange rates. (Source: World Steel Association, press release, 16 October 2018)

These are precisely the factors holding the sector back on the stock market. Take ArcelorMittal: the world’s largest steel producer lost 20% of its capitalization in a month. According to Thomson Reuters, analysts expect the group to boost profit by 22% this year. Whether and to what extent this is realistic will become clearer on 1 November (after our publication deadline). That is when the company releases its third quarter figures. On Friday 2 November US Steel, another major sector player, announces its quarterly earnings.

Opportunities: The two steel producers and Rio Tinto have been selected as the underlyings for a new Callable Worst of Kick-In GOAL (symbol: KCTUDU). One of the miner’s products is iron ore, a key input for making steel. Provided none of the three stocks touch or fall below the barrier at a low 54% of the initial prices, the structured product pays a maximal return in line with the 11.00% annual coupon on maturity. Important: The issuer has a call option. If it exercises the callable function on one of two possible dates, holders receive nominal plus the pro rata coupon.

Risks: Kick-In GOALs do not have capital protection. If the underlyings touch or fall below the respective Kick-In Level (barrier) and the callable feature does not apply, the amount repaid on the maturity date is reflecting the worst performance of the underlyings (but not more than notional value plus coupon). In this case, it is likely that losses will be incurred. Investors in structured products are also exposed to issuer risk, which means that the capital invested may be lost if UBS AG becomes insolvent, regardless of the performance of the underlying.

More UBS products and further information on the risks and opportunities are available at ubs.com/keyinvest.

US Steel vs. ArcelorMittal vs. Rio Tinto 5 years¹

Source: UBS AG, Bloomberg

As of: 01.11.2018

11.00% p.a. Callable Worst of Kick-In GOAL on US Steel / ArcelorMittal / Rio Tinto

Symbol KCTUDU
SVSP Name Barrier Reverse Convertible
SPVSP Code 1230 (Callable)
Underlyings US Steel / ArcelorMittal / Rio Tinto
Currency EUR (Quanto)
Coupon 11.00% p.a.
Kick-In Level 54.00%
Expiry 31.10.2019
Issuer UBS AG, London
Subscription until 07.11.2018, 15:00 h
 

More UBS products and further information on the risks and opportunities are available at ubs.com/keyinvest.

Source: UBS AG, Bloomberg

As of: 01.11.2018

¹) Please be aware that past performance does not indicate future results.
²) The conditions of ETTs are reviewed on a yearly basis and can be adjusted with a deadline of 13 months after the announcement.
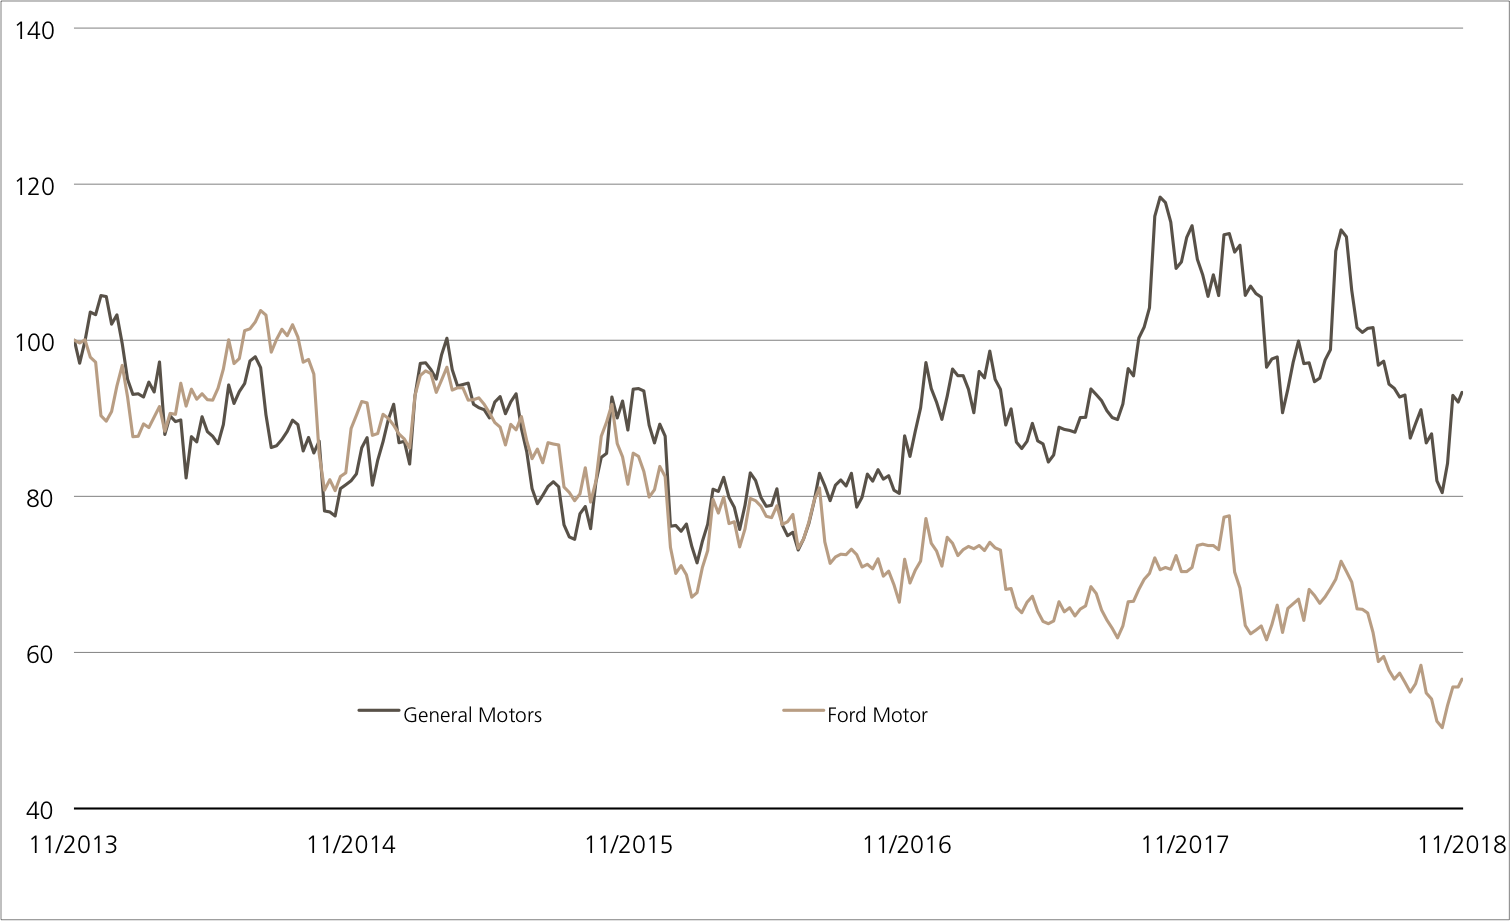
This material has been prepared by UBS AG or one of its affiliates («UBS»). This material is for distribution only as permitted by law. It is not prepared for the needs of any specific recipient. It is published solely for information and is not a solicitation or offer to buy or sell any securities or related financial instruments (“Instruments”). UBS makes no representation or warranty, either express or implied, on the completeness or reliability of the information contained in this document (“Information”) except that concerning UBS AG and its affiliates. The Information should not be regarded by recipients as a substitute for using their own judgment. Any opinions expressed in this material may change without notice and may be contrary to opinions expressed by other business areas of UBS as a result of using different assumptions or criteria. UBS is under no obligation to update the Information. UBS, its officers, employees or clients may have or have had an interest in the Instruments and may at any time transact in them. UBS may have or have had a relationship with entities referred to in the Information. Neither UBS nor any of its affiliates, or their officers or employees, accepts any liability for any loss arising from use of the Information. This presentation is not a basis for entering into a transaction. Any transaction between you and UBS will be subject to the detailed provisions of the term sheet, confirmation or electronic matching systems relating to that transaction. Clients wishing to effect transactions should contact their local sales representative.
This information is communicated by UBS AG and/or its affiliates («UBS»). * (see below) UBS may from time to time, as principal or agent, have positions in, or may buy or sell, or make a market in any securities, currencies, financial instruments or other assets underlying the product to which this website relates (the «Structured Product»). UBS may provide investment banking and other services to and/or have officers who serve as directors of the companies referred to in this website. UBS’s trading and/or hedging activities related to the Structured Product may have an impact on the price of the underlying asset and may affect the likelihood that any relevant barrier or relevant trigger event is crossed or triggered. UBS has policies and procedures designed to minimise the risk that officers and employees are influenced by any conflicting interest or duty and that confidential information is improperly disclosed or made available. UBS may pay or receive brokerage or retrocession fees in connection with the Structured Product described herein. In respect of any Structured Product that is a security, UBS may, in certain circumstances, sell the Structured Product to dealers and other financial institutions at a discount to the issue price or rebate to them for their own account some proportion of the issue price. Further information is available on request. Structured Products are complex and may involve a high risk of loss. Prior to purchasing the Structured Product you should consult with your own legal, regulatory, tax, financial and accounting advisors to the extent you consider it necessary, and make your own investment, hedging and trading decisions (including decisions regarding the suitability of the Structured Product) based upon your own judgement and advice from those advisers you consider necessary. Save as otherwise expressly agreed in writing, UBS is not acting as your financial adviser or fiduciary in relation to the Product. UBS generally hedges its exposure to Structured Products, although it may elect not to hedge or to partially hedge any Structured Product. UBS’s hedging activity may be conducted through transactions in the underlying asset, index or instrument or in options, futures or other derivatives related to the underlying asset, index or instrument on publicly traded markets or otherwise, and may have an impact on the price of the under-lying asset. If a transaction is cash settled, UBS will generally unwind or offset any hedge it has for such Structured Product in close proximity to the relevant valuation time or period. In some cases, this activity may affect the value of the Structured Product. Unless stated otherwise in this document, (i) this document is for information purposes only and should not be construed as an offer, personal recommendation or solicitation to purchase the Structured Product and should not be treated as giving investment advice, and (ii) the terms of any investment in the Structured Product will be exclusively subject to the detailed provisions, including risk considerations, contained in the more detailed legal documentation that relates to the Structured Product (being the confirmation, information memorandum, prospectus or other issuer documentation as relevant). UBS makes no representation or warranty relating to any information herein which is derived from independent sources. This document shall not be copied or reproduced without UBS’s prior written permission. In respect of any Structured Product that is a security, no action has been or will be taken in any jurisdiction that would permit a public offering of the Product, save where explicitly stated in the issuer documentation. The Structured Product must be sold in accordance with all applicable selling restrictions in the jurisdictions in which it is sold.
© UBS 2018. All rights reserved. UBS prohibits the forwarding of this information without the approval of UBS.
Weekly-Hits edition of 02.11.20182018-11-02T09:49:19+01:00

Weekly-Hits edition of 26.10.2018

KeyInvest Weekly Hits

Friday, 26.10.2018

  • Topic 1: Low-volatility strategy - Get off the roller coaster
  • Topic 2: Gold - The crisis currency moves up

Low-volatility strategy
Get off the roller coaster

Trade disputes, Brexit chaos and a controversial Italian budget proposal – these three factors have been making life uncomfortable for investors recently. They have also caused the turbulence on the global equity markets to rise sharply. Collective sentiment is reflected in implied volatilities. The range of fluctuation priced into options shot up at the start of the fourth quarter (see chart). In an environment like this, investment strategies targeting stocks with relatively low volatility could come into their own once again. The same goes for the K Switzerland Low Volatility NTR Index. Year to date this underlying has extended its long-term outperformance of the SMITM.1 A PERLES (symbol: SOLVZU) can give investors exposure to this benchmark in their portfolio.

Performance on the Swiss equity market is something of a roller coaster at the moment. The SMITM gained 5.6% between July and September 2018. This was the strongest performance the domestic blue chip index had posted since the first three months of 2013. But it was not enough for a breakout to the upside. Instead, recent weeks have seen the SMITM move down smartly. Shortly before the end of October the performance for the month was down 3.5%.1 Over extended periods these ups and downs in prices reduce returns. Academic studies have demonstrated that portfolios of relatively low-volatility stocks beat the broader market in the long term. This puts them at odds with traditional capital market theory, which assumes that the more risk an investor takes, the higher the return on a diversified portfolio. Robert Haugen and James Heins documented the “low volatility anomaly” as long ago as 1972. Twenty years after that, US researchers Eugene Fama and Kenneth French published a three-factor model. One of the characteristics this featured as driving returns was low volatility.

This is the starting point for the K Switzerland Low Volatility Index. The benchmark is based on smart beta methodology. In other words, the composition of the index does not weight the constituent stocks by market capitalization in the traditional way. Instead, it implements a low-volatility strategy in the Swiss equity market. Candidates for inclusion come from the 300 companies with the largest capitalization. Every month a filter selects the 20 stocks with the lowest range of price fluctuations from this universe. Weightings are based on inverse volatility, so the less a stock price moves compared to the other index constituents, the higher its percentage. The weighting of a single component is capped at 10% to avoid cluster risk.
The current composition of the K Switzerland Low Volatility Index reflects the full range of the domestic equity market: there are nine stocks in the SMITM and 11 second and third-liners. These include several shares which have been little affected by the recent market turbulence. Helvetia Holding, PSP Swiss Property and Lindt & Sprüngli, for example, have risen year to date¹.

Opportunities: The PERLES is listed on SIX (symbol: SOLVZU) and is a way of taking a diversified position in the 20 lowest-volatility stocks on the Swiss equity market. The product replicates the K Switzerland Low Volatility Index for an annual management fee of 1.00%. Any dividends on the constituents are reinvested net in the underlying. The term is limited to a total of seven years, but this can be extended by the same period.

Risks: This product does not have capital protection. With a PERLES, losses are incurred if the underlying index falls. Investors in structured products are also exposed to issuer risk, which means that the capital invested may be lost if UBS AG becomes insolvent, regardless of the performance of the underlying.

More UBS products and further information on the risks and opportunities are available at ubs.com/keyinvest.

K Switzerland Low Volatility NTR Index vs. SMI™ TR Index
(5 years; for illustrative purposes only; figures in %)¹

The K Switzerland Low Volatility Index has risen in the past. Over a five-year period the smart beta benchmark has outperformed the SMITM considerably.

Source: UBS AG, Bloomberg

As of 25.10.2018

Helvetia Holding vs. Lindt & Sprüngli vs. PSP Swiss Property
(5 years; for illustrative purposes only; figures in %)¹

Insurance, chocolate and real estate are the industries Helvetia, Lindt & Sprüngli and PSP operate in, all of which have contributed to the recent outperformance of the K Switzerland Low Volatility Index.

Source: UBS AG, Bloomberg

As of: 25.10.2018

¹) Please be aware that past performance does not indicate future results.
²) The conditions of ETTs are reviewed on a yearly basis and can be adjusted with a deadline of 13 months after the announcement.

PERLES on the K Switzerland Low Volatility Index

Symbol SOLVZU
SVSP Name Tracker-Certifikat
SPVSP Code 1300
Underlying K Switzerland Low Volatility Index
Ratio 1:1
Currency CHF
Administration fee 1.00% p.a.
Participation 100%
Expiry 17.04.20123
Issuer UBS AG, London
Bid/Ask CHF 251.25 / 252.75
 

K Switzerland Low Volatility Index – Composition as of 31.08.2018

Helvetia PSP Swiss Property
Baloise Swiss Prime Site
Nestlé Swiss Re
Kuehne & Nagel Swiss LIfe
Swisscom SGS
Lindt & Sprüngli Schindler Holding
Geberit Roche Holding
Givaudan EMS Chemie
Partners Group Barry Callebaut
Zurich Insurance Pargesa Holding
 

More UBS products and further information on the risks and opportunities are available at ubs.com/keyinvest.

Source: UBS AG, Bloomberg

As of: 25.10.2018

Market overview

Index Quotation Week¹
SMI™ 8’724.61 -0.3%
SLI™ 1’358.59 -2.9%
S&P 500™ 2’656.10 -5.5%
Euro STOXX 50™ 3’130.33 -3.5%
S&P™ BRIC 40 3’744.33 -3.2%
CMCI™ Compos. 949.39 -1.6%
Gold (troy ounce) 1’231.10 USD 0.3%

¹ Change based on the closing price of the previous day compared to the closing price a week ago.

SMI™ vs. VSMI™ 1 year

smi vs vsmi

The VSMI™ Index is calculated since 2005. It shows the volatility of the stocks within the SMI™ index. A portfolio which reacts only to changes in volatility instead of volatility itself is relevant for the calculation. Thereby, the VSMI™ methodology uses the squared volatility, known as variance, of the SMI options with remaining time to expiry of 30 days traded at the Eurex.

Source: UBS AG, Bloomberg

As of: 25.10.2018

Gold
The crisis currency moves up

The weather may have been nice in October, but things were less agreeable on the stock market. As discussed on the preceding pages, equity market corrections pushed volatility up sharply. At the same time, gold showed signs of life. The crisis currency has risen 3.4% since the end of September.¹ Logically, the ETC (Symbol: CGCCIU) on the UBS Bloomberg CMCI Gold CHF Monthly Hedged TR Index broke out to the upside of its downward technical trend. This participation product makes it possible to take roll-optimized positions in the precious metal.

Most investor showed little interest in gold as a safe haven until the end of the third quarter. The steep increase in interest rates in the USA and the associated strength of the dollar weighed on it in particular. While the greenback itself remains in demand as a crisis currency and is holding up at a high level, the gold price has shot up in recent weeks. Clearly the rise in general uncertainty factors has driven increasing numbers of investors to switch to risk-off mode. The situation in Italy is of special concern for financial markets. The government of the right-wing Lega party and the populist Five Star movement is planning to raise far more new debt in 2019 than its predecessor had indicated. The EU Commission has rejected Rome’s draft proposal, something which has never happened before in the history of the Eurozone. “If trust is eroded, all Member States take damage, our union takes damage,” said Commission Vice-President Valdis Dombrovskis of this unprecedented step. Italy now has three weeks to react to the criticism and submit a new budget for 2019 to Brussels. (Source: Thomson Reuters media report, 23 October 2018)

Opportunities: The ETC (Symbol: CGCCIU) on the UBS Bloomberg CMCI Gold CHF Monthly Hedged TR Index allows investors to diversify their portfolios simply and cheaply. The product underlying replicates the gold price by using various futures contracts. As is typical for the CMCI index family, positions are taken across the entire forward curve and all liquid maturities. A hedging mechanism ensures that fluctuations between the US dollar (the currency gold is priced in) and the Swiss franc (the product currency) are neutralized every month.

Risks: This product does not have capital protection. With an ETC, losses are incurred if the underlying index falls. Investors in structured products are also exposed to issuer risk, which means that the capital invested may be lost if UBS AG becomes insolvent, regardless of the performance of the underlying.

More UBS products and further information on the risks and opportunities are available at ubs.com/keyinvest.

Gold (in US dollars per fine ounce) 5 years¹

Source: UBS AG, Bloomberg

As of: 25.10.2018

ETC on the UBS Bloomberg CMCI Gold CHF Monthly Hedged TR Index

Symbol CGCCIU
SVSP Name Tracker-Certifikat
SPVSP Code 1300
Underlyings UBS Bloomberg CMCI Gold Monthly Hedged TR Index
Currency CHF
Ratio 10:1
Administration fee 0.38% p.a.
Participation 100%
Expiry Open End
Issuer UBS AG, London
Bid/Ask CHF 74.75 / 75.10
 

More UBS products and further information on the risks and opportunities are available at ubs.com/keyinvest.

Source: UBS AG, Bloomberg

As of: 25.10.2018

¹) Please be aware that past performance does not indicate future results.
²) The conditions of ETTs are reviewed on a yearly basis and can be adjusted with a deadline of 13 months after the announcement.
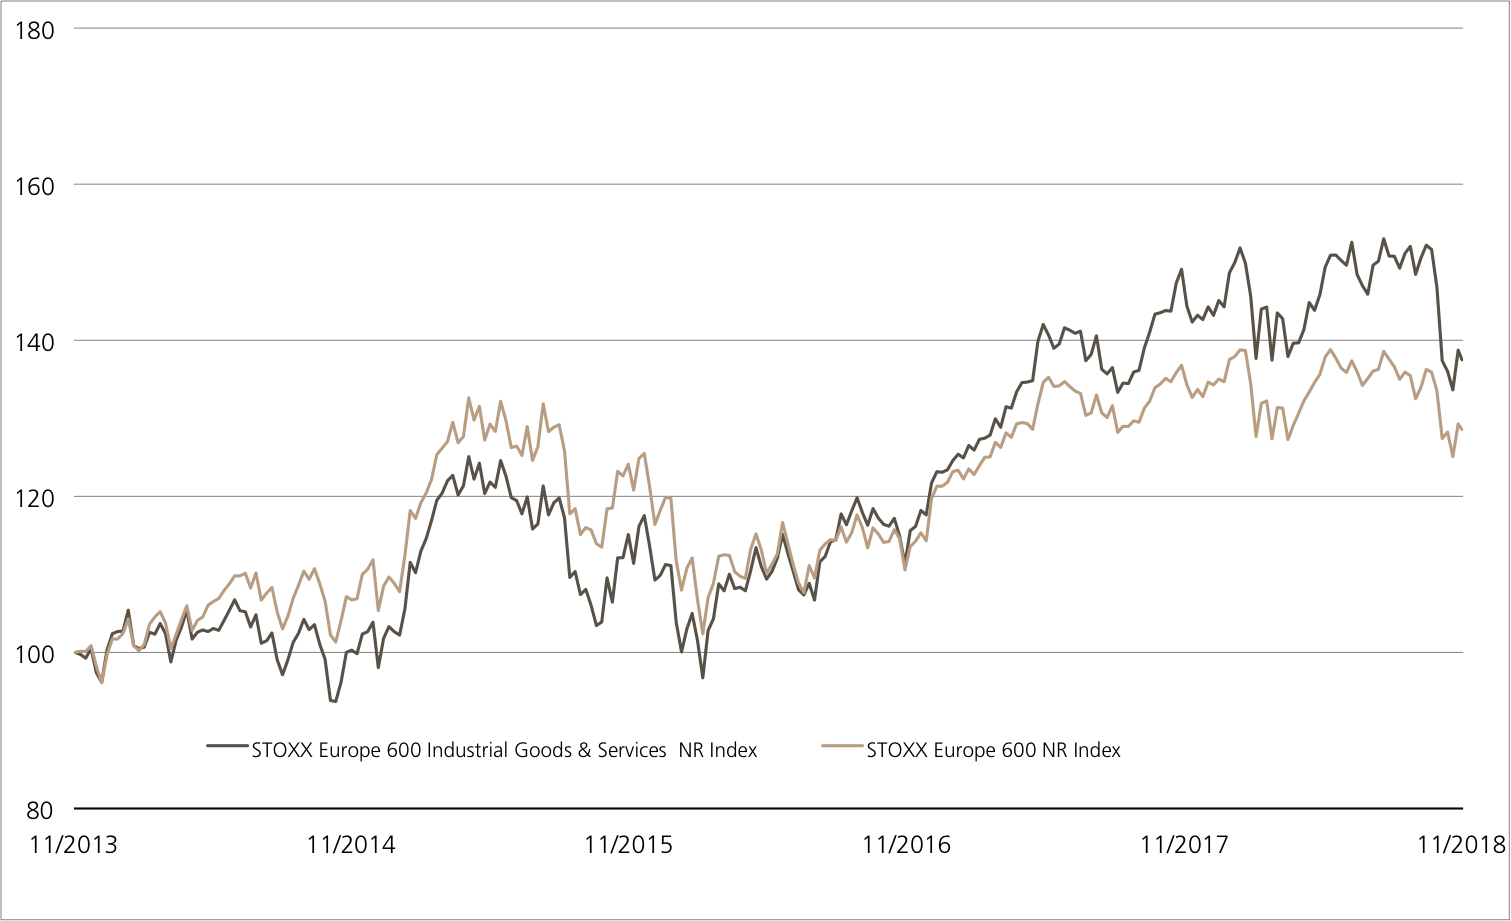
This material has been prepared by UBS AG or one of its affiliates («UBS»). This material is for distribution only as permitted by law. It is not prepared for the needs of any specific recipient. It is published solely for information and is not a solicitation or offer to buy or sell any securities or related financial instruments (“Instruments”). UBS makes no representation or warranty, either express or implied, on the completeness or reliability of the information contained in this document (“Information”) except that concerning UBS AG and its affiliates. The Information should not be regarded by recipients as a substitute for using their own judgment. Any opinions expressed in this material may change without notice and may be contrary to opinions expressed by other business areas of UBS as a result of using different assumptions or criteria. UBS is under no obligation to update the Information. UBS, its officers, employees or clients may have or have had an interest in the Instruments and may at any time transact in them. UBS may have or have had a relationship with entities referred to in the Information. Neither UBS nor any of its affiliates, or their officers or employees, accepts any liability for any loss arising from use of the Information. This presentation is not a basis for entering into a transaction. Any transaction between you and UBS will be subject to the detailed provisions of the term sheet, confirmation or electronic matching systems relating to that transaction. Clients wishing to effect transactions should contact their local sales representative.
This information is communicated by UBS AG and/or its affiliates («UBS»). * (see below) UBS may from time to time, as principal or agent, have positions in, or may buy or sell, or make a market in any securities, currencies, financial instruments or other assets underlying the product to which this website relates (the «Structured Product»). UBS may provide investment banking and other services to and/or have officers who serve as directors of the companies referred to in this website. UBS’s trading and/or hedging activities related to the Structured Product may have an impact on the price of the underlying asset and may affect the likelihood that any relevant barrier or relevant trigger event is crossed or triggered. UBS has policies and procedures designed to minimise the risk that officers and employees are influenced by any conflicting interest or duty and that confidential information is improperly disclosed or made available. UBS may pay or receive brokerage or retrocession fees in connection with the Structured Product described herein. In respect of any Structured Product that is a security, UBS may, in certain circumstances, sell the Structured Product to dealers and other financial institutions at a discount to the issue price or rebate to them for their own account some proportion of the issue price. Further information is available on request. Structured Products are complex and may involve a high risk of loss. Prior to purchasing the Structured Product you should consult with your own legal, regulatory, tax, financial and accounting advisors to the extent you consider it necessary, and make your own investment, hedging and trading decisions (including decisions regarding the suitability of the Structured Product) based upon your own judgement and advice from those advisers you consider necessary. Save as otherwise expressly agreed in writing, UBS is not acting as your financial adviser or fiduciary in relation to the Product. UBS generally hedges its exposure to Structured Products, although it may elect not to hedge or to partially hedge any Structured Product. UBS’s hedging activity may be conducted through transactions in the underlying asset, index or instrument or in options, futures or other derivatives related to the underlying asset, index or instrument on publicly traded markets or otherwise, and may have an impact on the price of the under-lying asset. If a transaction is cash settled, UBS will generally unwind or offset any hedge it has for such Structured Product in close proximity to the relevant valuation time or period. In some cases, this activity may affect the value of the Structured Product. Unless stated otherwise in this document, (i) this document is for information purposes only and should not be construed as an offer, personal recommendation or solicitation to purchase the Structured Product and should not be treated as giving investment advice, and (ii) the terms of any investment in the Structured Product will be exclusively subject to the detailed provisions, including risk considerations, contained in the more detailed legal documentation that relates to the Structured Product (being the confirmation, information memorandum, prospectus or other issuer documentation as relevant). UBS makes no representation or warranty relating to any information herein which is derived from independent sources. This document shall not be copied or reproduced without UBS’s prior written permission. In respect of any Structured Product that is a security, no action has been or will be taken in any jurisdiction that would permit a public offering of the Product, save where explicitly stated in the issuer documentation. The Structured Product must be sold in accordance with all applicable selling restrictions in the jurisdictions in which it is sold.
© UBS 2018. All rights reserved. UBS prohibits the forwarding of this information without the approval of UBS.
Weekly-Hits edition of 26.10.20182018-10-26T09:07:07+02:00

Weekly-Hits edition of 19.10.2018

KeyInvest Weekly Hits

Friday, 19.10.2018

  • Topic 1: Microchip equities - Opportunity to get involved in this sector thanks to the sell-off
  • Topic 2: BMW & Tesla - Premium manufacturers revved up

Microchip equities
Opportunity to get involved in this sector thanks to the sell-off

There was recently a wave of sales in the microchip sector. The Philadelphia Semiconductor Index fell by more than 4% within a single week. Infineon was hit even harder, with the DAX equity declining by around twice as much in the same period. AMS has also been on the “to sell” list of stock exchange speculators for some time now, and the microchip specialist has lost more than a quarter of its market capitalization in the space of a month.¹ Following the general sell-off in the sector, it might now make sense to consider entering the market at this low base. In view of the uncertain situation on the stock markets, however, conditional partial protection is a must. The Double Coupon Kick-In GOAL (symbol: KCRRDU) in subscription on AMS, Infineon and Intel has attractive conditions. In addition to a risk buffer of 40% and a coupon of 10% p.a., the product also offers the additional opportunity of being able to double the return. For those who prefer a product with only one underlying, should take a look at the Early Redemption Kick-In GOAL (symbol: KCSEDU) on AMS, with which a coupon of 10% p.a. is possible within just two years.

Although semiconductor companies are currently exposed to severe fluctuations on the stock market, the industry continues to grow. According to the experts at IC Insights, the global microchip market is expected to grow by 14% to USD 509.1 billion this year, exceeding the half trillion US dollar mark for the very first time. In light of new technology trends such as Big Data, the Internet of Things (IoT) and artificial intelligence, the demand for microchips could continue to remain high. IC Insights estimates that the percentage of electronic products being fitted with semiconductors will increase from 28.8% in 2017 to 31.5% in 2022. (Source: IC Insights, July 18, 2018)

According to analysts at CIO WM, the healthy demand for semiconductors is already being reflected in the activities of the majority of the industry’s big players. Therefore, the experts currently classify the sector as “neutral”, highlighting Intel as their preferred company. The microchip giant is also heavily involved in future trends such as data centers and IoT. In the second quarter, the two segments grew by an estimable 27% and 22%, respectively. Intel expects record sales for the current financial year, thus making it the third year in a row in which they have done so.
At Infineon, too, the signs continue to point to growth. In the wake of the recent share price fluctuation, the Germans confirmed their growth targets for 2018/19 (September 30). “We see no reason to question the outlook,” said an Infineon spokesperson (Source: Thomson Reuters media release, October 10, 2019). The Group expects sales to grow by 10%. Austria-based AMS, which is primarily known as an Apple supplier, is also growing strongly, but faces margin pressure. Even though UBS IB Research sees opportunities for AMS in 3D-sensor technology, the experts rate the equity as “Neutral” and have lowered the target price to CHF 65.

Opportunities: In order to achieve a double-digit percentage return with the Early Redemption Kick-In GOAL (symbol: KCSEDU) on AMS, the equity does not need to grow. If the risk buffer of 40% is maintained, the maximum return of 10% p.a. will be paid out in just under a year. The new Double Coupon Kick-In GOAL (symbol: KCRRDU) on AMS, Infineon and Intel offers a lofty 20% return opportunity. If the three equities are at least level with or above the initial price upon maturity, the traditional coupon of 10% p.a. will be doubled. The barrier stands at a comfortable 40% of the initial fixing price.

Risks: Kick-In GOALs do not have capital protection. If the underlyings touch or fall below the respective Kick-In Level (barrier) and the early redemption feature does not apply, the amount repaid on the maturity date is reflecting the worst performance of the underlyings (but not more than notional value plus coupon). In this case, it is likely that losses will be incurred. Investors in structured products are also exposed to issuer risk, which means that the capital invested may be lost if UBS AG becomes insolvent, regardless of the performance of the underlying.

More UBS products and further information on the risks and opportunities are available at ubs.com/keyinvest.

AMS vs. Infineon vs. Intel (5 years; for illustrative purposes only; figures in %)¹

ams infineon

The three microchip equities are ultimately showing clear upward growth over the next 5 years, with AMS faring the best. Nevertheless, the Apple supplier recently suffered significant losses.

Source: UBS AG, Bloomberg

As of 19.10.2018

AMS (5 years)¹

ams

Austrian semiconductor manufacturer AMS has enjoyed a steep upward trend, which started some two years ago. A correction phase subsequently set in when prices rose above 100 francs.

Source: UBS AG, Bloomberg

As of: 19.10.2018

¹) Please be aware that past performance does not indicate future results.
²) The conditions of ETTs are reviewed on a yearly basis and can be adjusted with a deadline of 13 months after the announcement.
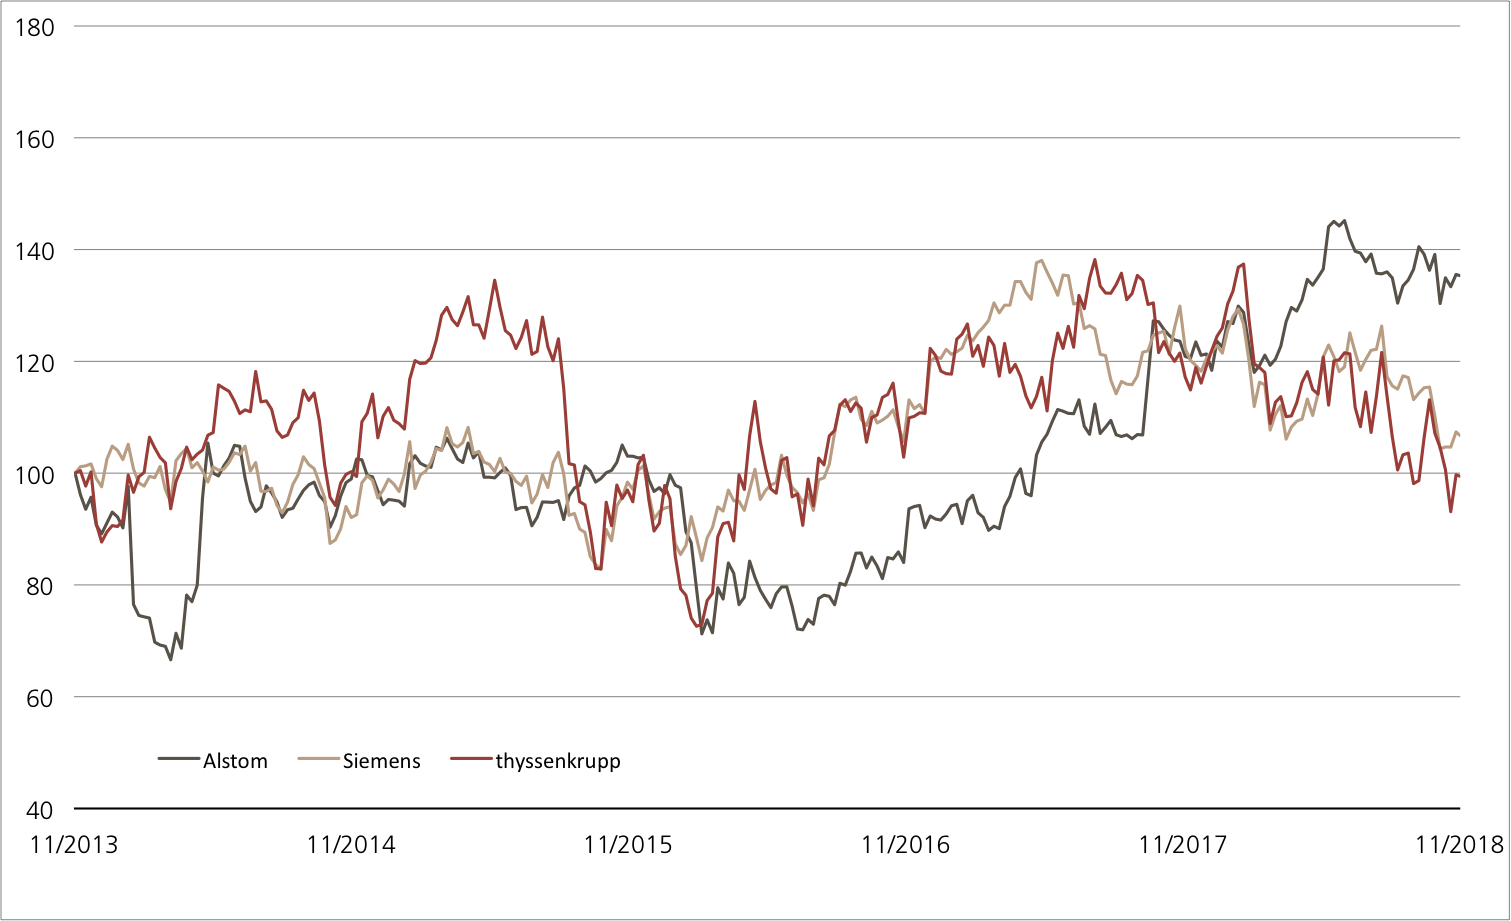
10.00% p.a. Double Coupon Worst of Kick-In GOAL on AMS, Infineon, Intel

Symbol KCRRDU
SVSP Name Barrier Reverse Convertible
SPVSP Code 1230, Variable Coupon
Underlying AMS, Infineon, Intel
Currency CHF (Quanto)
Coupon 10.00% p.a.
Double Coupon Trigger Level 100%
Kick-In Level 60%
Expiry 31.10.2019
Issuer UBS AG, London
Subscription until 31.10.2018, 15:00 h
 

10.00% p.a. ER Kick-In GOAL on AMS

Symbol KCSEDU
SVSP Name Barrier Reverse Convertible
SPVSP Code 1230, Auto-Callable
Underlying AMS
Currency CHF
Coupon 10.00% p.a.
Strike-Level 100%
Kick-In Level 60%
Expiry 02.11.2020
Issuer UBS AG, London
Subscription until 31.10.2018, 15:00 h
 

More UBS products and further information on the risks and opportunities are available at ubs.com/keyinvest.

Source: UBS AG, Bloomberg

As of: 19.10.2018

Market overview

Index Quotation Week¹
SMI™ 8’750.35 -1.6%
SLI™ 1’399.69 -1.2%
S&P 500™ 2’809.21 0.8%
Euro STOXX 50™ 3’243.08 -0.7%
S&P™ BRIC 40 3’868.91 1.0%
CMCI™ Compos. 965.12 0.1%
Gold (troy ounce) 1’227.40 2.8%

¹ Change based on the closing price of the previous day compared to the closing price a week ago.

SMI™ vs. VSMI™ 1 year

smi vs vsmi

The VSMI™ Index is calculated since 2005. It shows the volatility of the stocks within the SMI™ index. A portfolio which reacts only to changes in volatility instead of volatility itself is relevant for the calculation. Thereby, the VSMI™ methodology uses the squared volatility, known as variance, of the SMI options with remaining time to expiry of 30 days traded at the Eurex.

Source: UBS AG, Bloomberg

As of: 19.10.2018

BMW & Tesla
Premium manufacturers revved up

The automotive industry is currently being hit from all sides. In addition to international risks as a result of the customs conflict and Brexit, regulators are also exerting pressure on manufacturers with new exhaust emission tests. Although day-to-day business is consequently suffering, the companies are not losing sight of their future opportunities. BMW made a massive statement of intent recently. The German firm was the first foreign car company to succeed in acquiring a majority stake in a Chinese joint venture. In contrast, Tesla is making headlines in the US thanks to its rising production figures. From July to September, 53,239 bodies of the Model 3 cars on which the company has pinned its hopes rolled off the production line – more than twice as many as in the second quarter. UBS is now packaging the two premium manufacturers into a Callable Worst of Kick-In GOAL (symbol: KCRQDU), offering amazing conditions. The barrier stands at 50% of the initial price and the coupon totals 20% p.a.

The charismatic boss of the electric car pioneer Tesla is always good for a surprise. Elon Musk is currently trying to retrofit the on-board computer in the Tesla to include a video game console. Although this is still a long way off from bearing fruit, investors are eagerly awaiting the figures for the third quarter. After a weak first half-year, Musk had promised “sustainably profitable” work from now on. Tesla will publish its interim report on October 30. Although remaining in the black is no problem for competitor BMW, the Munich-based company did scare off investors with a profit warning. Nevertheless, the car company has decided not to stick its head in the sand, but continue to put the pedal to the metal instead. For example, BMW is increasing its stake in the joint venture with its Chinese partner Brilliance by 25% to 75%, paying EUR 3.6 billion in return. We expect to be able to fully consolidate BMW Brilliance Automotive in the balance sheet from 2022 onwards,” said BMW CEO Harald Krüger. (Source: Thomson Reuters media report, October 11, 2018)

Opportunities: BMW and Tesla don’t have to switch to the fast lane for the new Callable Worst of Kick-In GOAL (symbol: KCRQDU) to be profitable. On the contrary: The two automotive equities have a downward margin of 50% before the brakes are put on the potential maximum return of 20% p.a. The maximum term of one year can be shortened by a maximum of half a year due to the callable function.

Risks: This product does not have capital protection. If the underlyings touch or fall below the respective Kick-In Level (barrier) and the callable feature does not apply, the amount repaid on the maturity date is reflecting the worst performance of the underlyings (but not more than notional value plus coupon). In this case, it is likely that losses will be incurred. Investors in structured products are also exposed to issuer risk, which means that the capital invested may be lost if UBS AG becomes insolvent, regardless of the performance of the underlying.

More UBS products and further information on the risks and opportunities are available at ubs.com/keyinvest.

BMW vs. Tesla
(5 years; for illustrative purposes only; figures in %)¹

bmw

Source: UBS AG, Bloomberg

As of: 19.10.2018

20.00% p.a. Callable Worst of Kick-In GOAL on BMW and Tesla

Symbol KCRQDU
SVSP Name Barrier Reverse Convertible
SPVSP Code 1230, Callable
Underlyings BMW, Tesla
Currency EUR (Quanto)
Coupon 20.00% p.a.
Kick-In Level 50.00%
Expiry 24.10.2019
Issuer UBS AG, London
Subscription until 24.10.2018
 

More UBS products and further information on the risks and opportunities are available at ubs.com/keyinvest.

Source: UBS AG, Bloomberg

As of: 19.10.2018

¹) Please be aware that past performance does not indicate future results.
²) The conditions of ETTs are reviewed on a yearly basis and can be adjusted with a deadline of 13 months after the announcement.
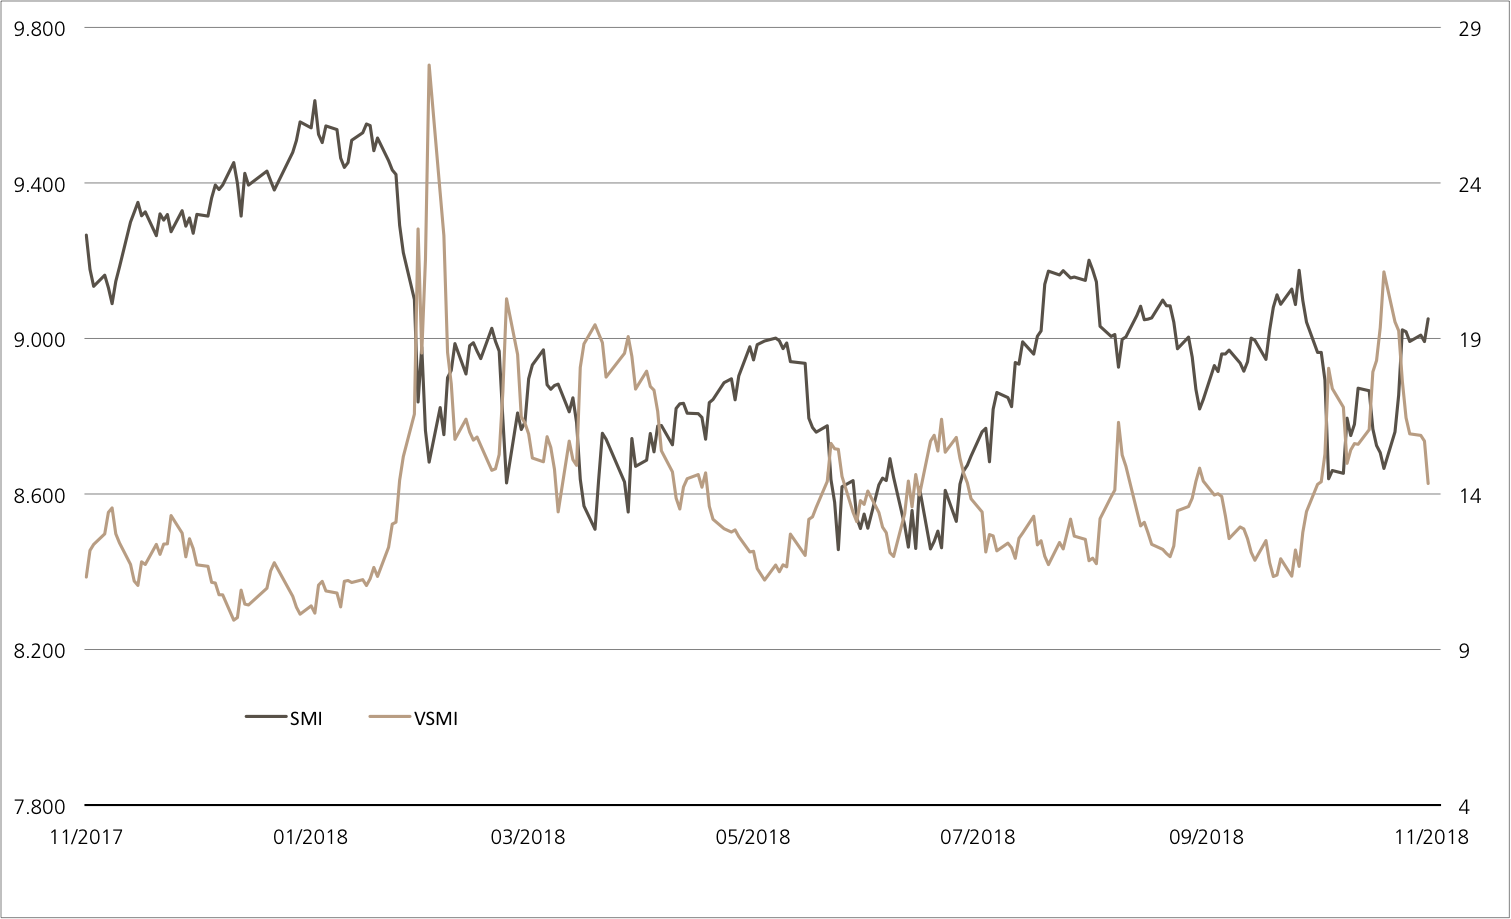
This material has been prepared by UBS AG or one of its affiliates («UBS»). This material is for distribution only as permitted by law. It is not prepared for the needs of any specific recipient. It is published solely for information and is not a solicitation or offer to buy or sell any securities or related financial instruments (“Instruments”). UBS makes no representation or warranty, either express or implied, on the completeness or reliability of the information contained in this document (“Information”) except that concerning UBS AG and its affiliates. The Information should not be regarded by recipients as a substitute for using their own judgment. Any opinions expressed in this material may change without notice and may be contrary to opinions expressed by other business areas of UBS as a result of using different assumptions or criteria. UBS is under no obligation to update the Information. UBS, its officers, employees or clients may have or have had an interest in the Instruments and may at any time transact in them. UBS may have or have had a relationship with entities referred to in the Information. Neither UBS nor any of its affiliates, or their officers or employees, accepts any liability for any loss arising from use of the Information. This presentation is not a basis for entering into a transaction. Any transaction between you and UBS will be subject to the detailed provisions of the term sheet, confirmation or electronic matching systems relating to that transaction. Clients wishing to effect transactions should contact their local sales representative.
This information is communicated by UBS AG and/or its affiliates («UBS»). * (see below) UBS may from time to time, as principal or agent, have positions in, or may buy or sell, or make a market in any securities, currencies, financial instruments or other assets underlying the product to which this website relates (the «Structured Product»). UBS may provide investment banking and other services to and/or have officers who serve as directors of the companies referred to in this website. UBS’s trading and/or hedging activities related to the Structured Product may have an impact on the price of the underlying asset and may affect the likelihood that any relevant barrier or relevant trigger event is crossed or triggered. UBS has policies and procedures designed to minimise the risk that officers and employees are influenced by any conflicting interest or duty and that confidential information is improperly disclosed or made available. UBS may pay or receive brokerage or retrocession fees in connection with the Structured Product described herein. In respect of any Structured Product that is a security, UBS may, in certain circumstances, sell the Structured Product to dealers and other financial institutions at a discount to the issue price or rebate to them for their own account some proportion of the issue price. Further information is available on request. Structured Products are complex and may involve a high risk of loss. Prior to purchasing the Structured Product you should consult with your own legal, regulatory, tax, financial and accounting advisors to the extent you consider it necessary, and make your own investment, hedging and trading decisions (including decisions regarding the suitability of the Structured Product) based upon your own judgement and advice from those advisers you consider necessary. Save as otherwise expressly agreed in writing, UBS is not acting as your financial adviser or fiduciary in relation to the Product. UBS generally hedges its exposure to Structured Products, although it may elect not to hedge or to partially hedge any Structured Product. UBS’s hedging activity may be conducted through transactions in the underlying asset, index or instrument or in options, futures or other derivatives related to the underlying asset, index or instrument on publicly traded markets or otherwise, and may have an impact on the price of the under-lying asset. If a transaction is cash settled, UBS will generally unwind or offset any hedge it has for such Structured Product in close proximity to the relevant valuation time or period. In some cases, this activity may affect the value of the Structured Product. Unless stated otherwise in this document, (i) this document is for information purposes only and should not be construed as an offer, personal recommendation or solicitation to purchase the Structured Product and should not be treated as giving investment advice, and (ii) the terms of any investment in the Structured Product will be exclusively subject to the detailed provisions, including risk considerations, contained in the more detailed legal documentation that relates to the Structured Product (being the confirmation, information memorandum, prospectus or other issuer documentation as relevant). UBS makes no representation or warranty relating to any information herein which is derived from independent sources. This document shall not be copied or reproduced without UBS’s prior written permission. In respect of any Structured Product that is a security, no action has been or will be taken in any jurisdiction that would permit a public offering of the Product, save where explicitly stated in the issuer documentation. The Structured Product must be sold in accordance with all applicable selling restrictions in the jurisdictions in which it is sold.
© UBS 2018. All rights reserved. UBS prohibits the forwarding of this information without the approval of UBS.
Weekly-Hits edition of 19.10.20182018-10-19T09:14:50+02:00

Weekly-Hits edition of 12.10.2018

KeyInvest Weekly Hits

Friday, 12.10.2018

  • Topic 1: Cybercrime - Security on the information superhighway
  • Topic 2: Medical technology - A sector in upheaval

Cybercrime
Security on the information superhighway

Hacker attacks are currently a hot topic in the media. For example, the UK is accusing Russia of being responsible for cyber attacks made against political institutions. (Source: Thomson Reuters media report, October 10, 2018) A data scandal on Facebook is also causing quite a stir. According to the US company, hackers exploited a breach in security, which enabled them to spy on approximately 50 million profiles (Source: https://newsroom.fb.com/news/2018/09/security-update/). These examples show that the protection mechanisms used need to be improved and become more effective. Consequently, the demand for IT security services – from private users and companies to entire countries – is likely to remain high in the future. This long-term trend could also be a good capital investment. The Open End PERLES on the Solactive Global Cyber Security Index make it easy and cost-effective to invest in the sector. The products, which can be traded in Swiss francs (symbol: KCFJDU) and US dollars (symbol: KCFKDU), have a management fee of 0.75% p.a.

Siemens is an impressive example of the significance of cybersecurity. A total of 1,275 employees are responsible for IT security at the industrial group. After all, Siemens records around 1,000 attacks a day. It is rapidly becoming clear that IT security is a global market worth billions. According to the «Cybersecurity Market by Solution» report, global spending in this area will reach a volume of USD 152.71 billion in the current year – and this figure is set to increase in the future. Estimates state that the market will grow to USD 248.26 billion by 2023, corresponding to an average annual growth rate of 10.2% between 2018 and 2023. The main drivers behind this are the increasing number of hacker attacks and stricter data protection guidelines. (Source: MarketsandMarktes, September 2018) Internet security is a wide-ranging field. Encryption, anti-virus protection, firewalls and data recovery are just a few of the areas that IT security companies need to address. It could therefore make sense to diversify your portfolio by investing in this growth trend. The Solactive Global Cyber Security Index includes a total of 14 international security companies, all of which are specialists in their fields. For example, Japanese company Trend Micro is best known for its antivirus software, while Israeli firm Check Point Software excels in firewall and VPN products. The current heavyweight in the index is Fortinet. The company, which last year even founded an independent subsidiary that focuses solely on cybersecurity products for government agencies, recently received a fillip from the index provider S&P Dow Jones. As of October 11, 2018, Fortinet replaced Envision Healthcare Corp. on the S&P 500™ indices. The “promotion” came as a result of a strong share price performance, as the market value of Fortinet increased by a huge 113% within the space of a year.¹

Opportunities: The price curve of the Solactive Global Cyber Security Index is likewise trending strongly upward. Although the barometer also paid the price for the recent market weakness, the index reached a new record high until mid-September. Positive growth of 21.4% has been recorded since the end of the year 2017.¹ The Open End PERLES in Swiss francs (symbol: KCFJDU) and US dollars (symbol: KCFKDU) give investors easy access to companies offering promising IT security solutions. The products track the performance of the Solactive Global Cyber Security NTR Index. Although there is an annual management fee of 0.75%, the net dividends distributed to members are reinvested.

Risks: The aforementioned products do not have capital protection. Should the underlying assets deliver a negative performance; the Open End PERLES will incur commensurate losses. The currency risk must also be taken into account, as the trading currency of the products may differ from the currencies of the index members. Investors in structured products are also exposed to issuer risk, which means that the capital invested may be lost if UBS AG becomes insolvent, regardless of the performance of the underlying.

More UBS products and further information on the risks and opportunities are available at ubs.com/keyinvest.

Solactive Global Cyber Security USD NTR Index since October 18, 2013 (launch day)¹

solactive

The IT security sector benefits from the increase in spending on security. This is impressively reflected in the Solactive Global Cyber Security Index, which has achieved an average return of 19.9% p.a. since its launch.

Source: UBS AG, Bloomberg

As of 10.10.2018

Check Point Software vs. Fortinet vs. F5 Networks (5 years) ¹
(for illustrative purposes only; figures in %)

The current heavyweights on the Solactive Global Cyber Security Index – Check Point Software, Fortinet and F5 Networks – are posting significant growth on a five-year basis. Fortinet has even recorded growth in excess of 400%.

Source: UBS AG, Bloomberg

As of: 10.10.2018

¹) Please be aware that past performance does not indicate future results.
²) The conditions of ETTs are reviewed on a yearly basis and can be adjusted with a deadline of 13 months after the announcement.
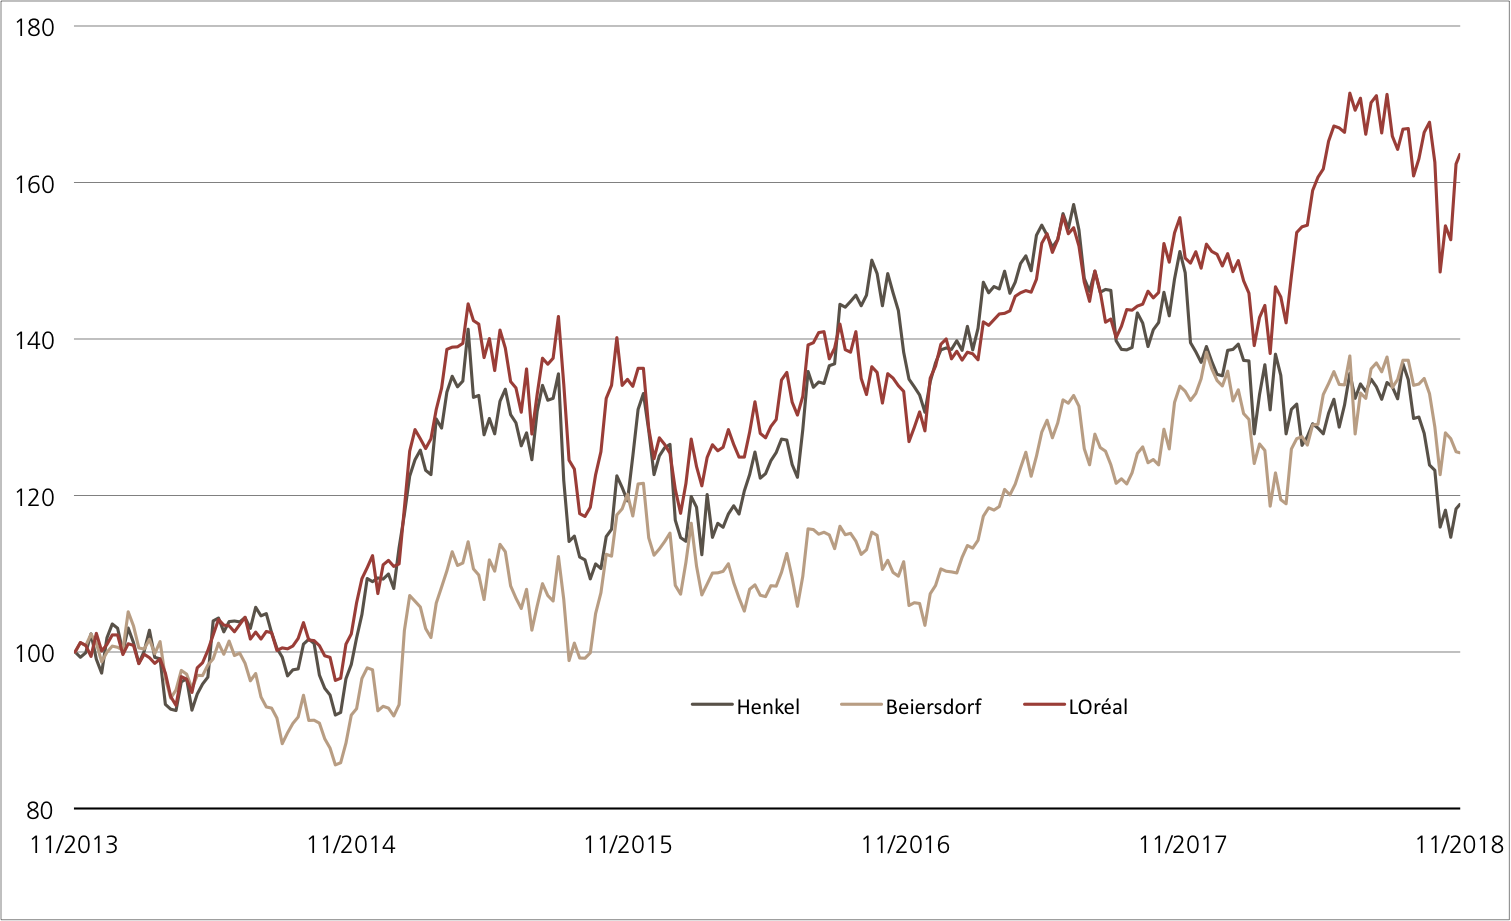
Open End PERLES on Solactive Global Cyber Security NTR Index (CHF)

Symbol KCFJDU
SVSP Name Tracker-Certificate
SPVSP Code 1300
Underlying Solactive Global Cyber Security USD NTR Index
Ratio 1:1
Currency CHF
Administration fee 0.75% p.a.
Participation 100%
Expiry Open End
Issuer UBS AG, London
Bid/Ask CHF 200.10 / 202.20
 

Open End PERLES on Solactive Global Cyber Security NTR Index (USD)

Symbol KCFKDU
SVSP Name Tracker-Certificate
SPVSP Code 1300
Underlying Solactive Global Cyber Security USD NTR Index
Ratio 1:1
Currency USD
Administration fee 0.75% p.a.
Participation 100%
Expiry Open End
Issuer UBS AG, London
Bid/Ask USD 202.00 /204.00
 

More UBS products and further information on the risks and opportunities are available at ubs.com/keyinvest.

Source: UBS AG, Bloomberg

As of: 10.10.2018

Market overview

Index Quotation Week¹
SMI™ 8’892.88 -3.1%
SLI™ 1’416.66 -4.8%
S&P 500™ 2’785.68 -4.8%
Euro STOXX 50™ 3’266.90 -4.1%
S&P™ BRIC 40 3’829.43 -4.9%
CMCI™ Compos. 963.86 -1.4%
Gold (troy ounce) 1’193.40 -1.4%

¹ Change based on the closing price of the previous day compared to the closing price a week ago.

SMI™ vs. VSMI™ 1 year

smi vs vsmi

The VSMI™ Index is calculated since 2005. It shows the volatility of the stocks within the SMI™ index. A portfolio which reacts only to changes in volatility instead of volatility itself is relevant for the calculation. Thereby, the VSMI™ methodology uses the squared volatility, known as variance, of the SMI options with remaining time to expiry of 30 days traded at the Eurex.

Source: UBS AG, Bloomberg

As of: 10.10.2018

Medical technology
A sector in upheaval

Commotion on the hearing aid market: The US company Bose, known for its speaker systems, has received FDA approval for a hearing aid. People with mild to moderate hearing loss can adjust the settings of this device to meet their needs. The increase in the competition on the market has placed the shares of Sonova under pressure, with the Swiss company’s equities losing about a tenth of their value following the announcement. Medical technology company Straumann also experienced a similar situation.¹ Weak tidings from the industry, among other things, has had a negative impact here. For example, Stratec Biomedical provided a huge surprise by issuing a profit warning. In view of the now reduced share prices of Sonova and Straumann, a partial protection product on the duo might make sense. The Early Redemption (ER) Worst of Kick-In GOAL (symbol: KCQVDU) in subscription offers attractive conditions in this regard. If the barrier remains intact at 69% of the starting prices, the product will yield a maximum amount of 5% p.a. in 18 months at the latest.

Two factors should not be overlooked in the current weakness of Sonova’s share price: Firstly, the group started its extensive share buy-back program on October 10. The hearing aid manufacturer would like to spend up to 1.5 billion Swiss francs on this program. Secondly, an important investors’ day will be held on October 16. Market participants hope that Sonova will use the meeting to announce a new hearing aid that will outperform competing products. At Straumann, on the other hand, things will only start getting exciting at the end of October, as this is when the implant specialist will publish its results for the third quarter. The company’s half-year figures delivered a positive surprise, as management increased its forecast for organic growth in 2018 by some 15%.

Opportunities: The two aforementioned medical technology equities do not need to post price gains for the new ER Worst of Kick-In GOAL (symbol: KCQVDU) to yield the maximum return of 5% p.a. All that is required is that both equites remain above the barrier of 69% of the initial fixing levels during the 18-month term. However, due to the early redemption function, the maximum return can also be achieved earlier. For this to happen, Sonova and Straumann both have to be at or above the initial fixed price on one of the quarterly observation days (first date: October 24, 2019).

Risks: This product does not have capital protection. If the underlyings touch or fall below the respective Kick-In Level (barrier) and the early redemption feature does not apply, the amount repaid on the maturity date is reflecting the worst performance of the underlyings (but not more than notional value plus coupon). In this case, it is likely that losses will be incurred. Investors in structured products are also exposed to issuer risk, which means that the capital invested may be lost if UBS AG becomes insolvent, regardless of the performance of the underlying.

More UBS products and further information on the risks and opportunities are available at ubs.com/keyinvest.

Sonova vs. Straumann (5 years) ¹
(for illustrative purposes only; figures in %)

Source: UBS AG, Bloomberg

As of: 10.10.2018

5.00% p.a. ER Worst of Kick-In GOAL on Sonova / Straumann

Symbol KCQVDU
SVSP Name Barrier Reverse Convertible
SPVSP Code 1230 (Auto-Callable)
Underlyings Sonova, Straumann
Currency CHF
Coupon 5.00% p.a.
Kick-In Level 69.00%
Expiry 23.04.2020
Issuer UBS AG, London
Subscription until 24.10.2018, 15:00 h
 

More UBS products and further information on the risks and opportunities are available at ubs.com/keyinvest.

Source: UBS AG, Bloomberg

As of: 10.10.2018

¹) Please be aware that past performance does not indicate future results.
²) The conditions of ETTs are reviewed on a yearly basis and can be adjusted with a deadline of 13 months after the announcement.

This material has been prepared by UBS AG or one of its affiliates («UBS»). This material is for distribution only as permitted by law. It is not prepared for the needs of any specific recipient. It is published solely for information and is not a solicitation or offer to buy or sell any securities or related financial instruments (“Instruments”). UBS makes no representation or warranty, either express or implied, on the completeness or reliability of the information contained in this document (“Information”) except that concerning UBS AG and its affiliates. The Information should not be regarded by recipients as a substitute for using their own judgment. Any opinions expressed in this material may change without notice and may be contrary to opinions expressed by other business areas of UBS as a result of using different assumptions or criteria. UBS is under no obligation to update the Information. UBS, its officers, employees or clients may have or have had an interest in the Instruments and may at any time transact in them. UBS may have or have had a relationship with entities referred to in the Information. Neither UBS nor any of its affiliates, or their officers or employees, accepts any liability for any loss arising from use of the Information. This presentation is not a basis for entering into a transaction. Any transaction between you and UBS will be subject to the detailed provisions of the term sheet, confirmation or electronic matching systems relating to that transaction. Clients wishing to effect transactions should contact their local sales representative.
This information is communicated by UBS AG and/or its affiliates («UBS»). * (see below) UBS may from time to time, as principal or agent, have positions in, or may buy or sell, or make a market in any securities, currencies, financial instruments or other assets underlying the product to which this website relates (the «Structured Product»). UBS may provide investment banking and other services to and/or have officers who serve as directors of the companies referred to in this website. UBS’s trading and/or hedging activities related to the Structured Product may have an impact on the price of the underlying asset and may affect the likelihood that any relevant barrier or relevant trigger event is crossed or triggered. UBS has policies and procedures designed to minimise the risk that officers and employees are influenced by any conflicting interest or duty and that confidential information is improperly disclosed or made available. UBS may pay or receive brokerage or retrocession fees in connection with the Structured Product described herein. In respect of any Structured Product that is a security, UBS may, in certain circumstances, sell the Structured Product to dealers and other financial institutions at a discount to the issue price or rebate to them for their own account some proportion of the issue price. Further information is available on request. Structured Products are complex and may involve a high risk of loss. Prior to purchasing the Structured Product you should consult with your own legal, regulatory, tax, financial and accounting advisors to the extent you consider it necessary, and make your own investment, hedging and trading decisions (including decisions regarding the suitability of the Structured Product) based upon your own judgement and advice from those advisers you consider necessary. Save as otherwise expressly agreed in writing, UBS is not acting as your financial adviser or fiduciary in relation to the Product. UBS generally hedges its exposure to Structured Products, although it may elect not to hedge or to partially hedge any Structured Product. UBS’s hedging activity may be conducted through transactions in the underlying asset, index or instrument or in options, futures or other derivatives related to the underlying asset, index or instrument on publicly traded markets or otherwise, and may have an impact on the price of the under-lying asset. If a transaction is cash settled, UBS will generally unwind or offset any hedge it has for such Structured Product in close proximity to the relevant valuation time or period. In some cases, this activity may affect the value of the Structured Product. Unless stated otherwise in this document, (i) this document is for information purposes only and should not be construed as an offer, personal recommendation or solicitation to purchase the Structured Product and should not be treated as giving investment advice, and (ii) the terms of any investment in the Structured Product will be exclusively subject to the detailed provisions, including risk considerations, contained in the more detailed legal documentation that relates to the Structured Product (being the confirmation, information memorandum, prospectus or other issuer documentation as relevant). UBS makes no representation or warranty relating to any information herein which is derived from independent sources. This document shall not be copied or reproduced without UBS’s prior written permission. In respect of any Structured Product that is a security, no action has been or will be taken in any jurisdiction that would permit a public offering of the Product, save where explicitly stated in the issuer documentation. The Structured Product must be sold in accordance with all applicable selling restrictions in the jurisdictions in which it is sold.
© UBS 2018. All rights reserved. UBS prohibits the forwarding of this information without the approval of UBS.
Weekly-Hits edition of 12.10.20182018-10-19T07:37:58+02:00

Weekly-Hits edition of 08.10.2018

KeyInvest Weekly Hits

Monday, 08.10.2018

Keyinvest Weekly Hits
  • Topic 1: US tax reform – US companies flourishing
  • Topic 2: Airbus/Boeing – Full-to-bursting order books

US tax reform
US companies flourishing

The US economy is buzzing. In the first quarter of 2018, the country’s gross domestic product (GDP) grew by 4.2% on an annualized basis. At the same time, the economy is more or less at full employment. One of the main drivers of this boom is the tax reform initiated at the start of the year. In December 2017, UBS launched the US Tax Reform Beneficiaries Basket to provide investors with an opportunity to participate in the benefits of the relief in a concentrated form. To date, the strategy behind the shares selected has been very successful. The PERLES (symbol: USTAXU) on the basket has gained 11.3% in value since the start of the year and is therefore outperforming the S&P 500™ index.

One of Donald Trump’s main promises that he made during his election campaign was the implementation of a large-scale tax reform. In the battle for the White House in 2016, the Republican candidate promised extensive relief for private households and businesses, true to the motto of “America first!”. Shortly before Christmas 2017 and about eleven months after taking office, Trump signed a package of laws that had been hotly contested in Washington and implemented the largest tax reform in the US in more than 30 years. This measure, one of the central elements of which was a significant reduction in corporate income tax, is now clearly taking effect. The reform is not only driving the US economy forward as a whole, it is also having a positive effect on company figures according to UBS CIO WM. The experts describe the relief as the “icing on the cake” in an already positive environment. In concrete terms, the reform could accelerate this year’s profit growth in the US by 8%. Overall, UBS CIO WM anticipates a profit increase of 18% for the current year. (Source: UBS CIO WM, «UBS House view Monthly Base», October 2018, 20.09.2018) What is certain is that the US equity market in general and the beneficiaries of the tax reform in particular are currently in strong demand among investors. While other important stock markets hardly made any headway in the first three quarters of 2018, the S&P 500™ continued its attempt to set new records. At the end of September 2018, the benchmark was up by just under 9%. Meanwhile, the US Tax Reform Beneficiaries Basket has increased in price by more than 11%.

UBS launched this selection last December, shortly before a decision had been made on the reform. The impetus to do so came from UBS Research. The in-house analysts were of the opinion at the time that the US tax reform had only been partially priced into share prices. As a result, they systematically searched for companies that could potentially profit from the reform. One of the main criterion for the composition of the basket was the influence of the reform on cash flow and its relation to the respective market capitalization. In order to ensure that the composition did not differ too much from that of the S&P 500™ index, the experts limited the number of shares per sector, resulting in a moderate overweight in companies that benefit the most.

For example, the relatively high proportion of healthcare and technology companies in the US Tax Reform Beneficiaries Basket has paid off to date. In addition to the tax reform, the friendly US consumer climate is playing into the hands of the technology sector. The same also applies to the retail sector. Kohl’s and Macy’s, among others, were considered from this sector of the economy – the shares of the two US department stores have to date risen by around 37% in 2018.

Opportunities: The tracker certificate (symbol: USTAXU) on the US Tax Reform Beneficiaries Basket is still in the first year of its seven-year term. Investors can therefore continue to be able to rely on the long-term effect of the US tax reform. The management fee for the participation product is 0.3% p.a. Any dividend payments distributed by the basket members are reinvested net in the share of the company paying out.

Risks: This product does not have capital protection. The PERLES will make a loss if the underlying basket decreases. Investors in structured products are also exposed to issuer risk, which means that the invested capital may be lost if UBS AG becomes insolvent, regardless of the performance of the underlying.

More UBS products and further information on the risks and opportunities are available at ubs.com/keyinvest.

HCA Healthcare vs. Centene vs. Humana (5 years)¹
(for illustrative purposes only; figures in %)

The three healthcare companies HCA Healthcare, Centene and Humana are among the top performers in the US Tax Reform Beneficiaries Basket to date. The upward pace of the three shares increased once again in 2018.

Source: UBS AG, Bloomberg

As of 03.10.2018

Kohl’s vs. Macy’s vs. Gap (5 years)¹

(for illustrative purposes only; figures in %)

The share prices of the two US retailers Kohl’s and Macy’s have rocketed following the introduction of the tax reform. In contrast, operational problems have put the brakes on the Gap fashion chain’s share performance.

Source: UBS AG, Bloomberg

As of: 03.10.2018

¹) Please be aware that past performance does not indicate future results.
²) The conditions of ETTs are reviewed on a yearly basis and can be adjusted with a deadline of 13 months after the announcement.
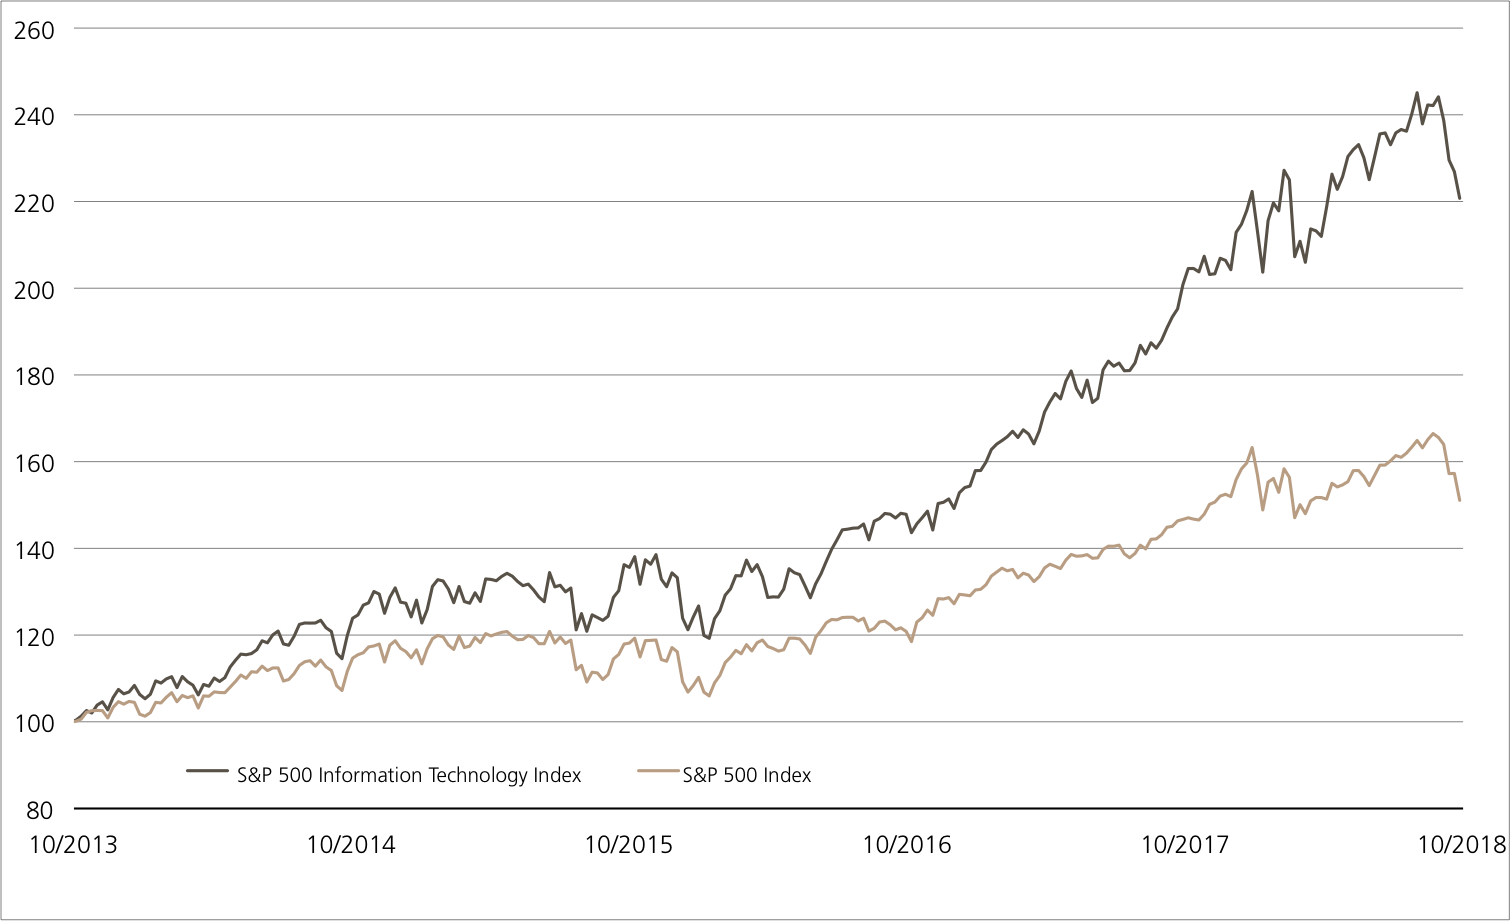
PERLES on US Tax Reform Beneficiaries Basket

Symbol USTAXU
SVSP Name Tracker-Certificate
SPVSP Code 1300
Underlying US Tax Reform Beneficiaries Basket
Ratio 1:1
Currency USD
Administration fee 0.30% p.a.
Participation 100%
Expiry 20.10.2024
Issuer UBS AG, London
Bid/Ask USD 1’135.00 / 1’145.00
 

US Tax Reform Beneficiaries Basket: Initial weighting by sector (as of: 04.12.2017)

Technology 18%
Finances 16%
Healthcare 16%
Non-basic consumer Goods 14%
Industry 12%
Basic consumer Goods 10%
Other 14%

More UBS products and further information on the risks and opportunities are available at ubs.com/keyinvest.

Source: UBS AG, Bloomberg

As of: 03.10.2018

Market overview

Index Quotation Week¹
SMI™ 9’175.21 Pkt. 1.0%
SLI™ 1488.05 Pkt. 0.0%
S&P 500™ 2’925.51 Pkt. 0.7%
Euro STOXX 50™ 3’405.48 Pkt. -0.8%
S&P™ BRIC 40 4’028.54 Pkt. -0.7%
CMCI™ Compos. 977.18 Pkt. 3.6%
Gold (troy ounce) 1’202.90 USD 0.3%

¹ Change based on the closing price of the previous day compared to the closing price a week ago.

SMI™ vs. VSMI™ 1 year

smi vs vsmi

The VSMI™ Index is calculated since 2005. It shows the volatility of the stocks within the SMI™ index. A portfolio which reacts only to changes in volatility instead of volatility itself is relevant for the calculation. Thereby, the VSMI™ methodology uses the squared volatility, known as variance, of the SMI options with remaining time to expiry of 30 days traded at the Eurex.

Source: UBS AG, Bloomberg

As of: 03.10.2018

Airbus/Boeing
Full-to-bursting order books

In the duel between the aircraft manufacturers Airbus and Boeing, the US industry leader has currently inched ahead by a nose. From January to August 2018, Boeing received net orders for 581 aircraft. In contrast, Airbus had to make do with just 219 net orders during this period. The most recent share price performance of the rivals reflects this. While the Airbus share is stagnating in the short term, the Boeing share has started the fourth quarter at a new all-time high.¹ UBS is now combining the two industry giants for an Early Redemption (ER) Worst of Kick-In GOAL (symbol: KCOADU). Investors can expect a coupon payment of 7.5% p.a. here. Meanwhile, the underlyings have a safety cushion of 40% over the two-year term.

Despite the recent slump in orders, Airbus› order book remains full to bursting. At the end of August 2018, the Group reported that it had orders for a total of 7,415 aircraft. At current production rates, production will therefore be fully utilized for almost nine years. Lastly, Airbus secured an order from Europe’s largest airline. Lufthansa converted purchase options for 27 A320 neo and A321 neo aircraft into concrete orders. Ten of the fuel-efficient aircraft from this order will go into service for SWISS. (Source: Airbus press release, 01.10.2018) At Boeing, the legendary 737 is the absolute bestseller. From January to August 2018, almost three-quarters of orders were for the classic aircraft, with the 737 MAX being most in demand. According to Boeing, never before has an airplane sold as well as this ultra-modern model in the company’s history, which stretches back for more than 100 years. The company has revealed that approximately 4,700 orders have been placed for the 737 MAX from more than 100 customers. (Source: Boeing.com) Investors will find out how well the industry leader has performed on October 24 when Boeing publishes its figures for the third quarter. Six days later, Airbus will provide an insight into the company’s latest business developments.

Opportunities: Shortly before the earnings releases, UBS will issue the ER Worst of Kick-In GOAL (symbol: KCOADU) on Airbus and Boeing. A coupon of 7.50% p.a. is available on the two shares. The barriers are set at 60% of the starting level of the two shares. As long as none of the underlyings touch or fall below this level, the product will end with a maximum return in line with the coupon. There is also the opportunity for early redemption at 100% plus the accrued coupon. The Early Redemption feature will take effect if the Airbus and Boeing shares are level with or above the initial price on one of the quarterly observation days (first date: 19.10.2019).

Risks: This product does not have capital protection. If the underlyings touch or fall below the respective Kick-In Level (barrier) and the early redemption feature does not apply, the amount repaid on the maturity date is reflecting the worst performance of the underlyings (but not more than notional value plus coupon). In this case, it is likely that losses will be incurred. Investors in structured products are also exposed to issuer risk, which means that the capital invested may be lost if UBS AG becomes insolvent, regardless of the performance of the underlying.

More UBS products and further information on the risks and opportunities are available at ubs.com/keyinvest.

Airbus vs. Boeing (5 years)¹

(for illustrative purposes only; figures in %)

Source: UBS AG, Bloomberg

As of: 03.10.2018

7.50% p.a. Early Redemption Worst of Kick-In GOAL on Airbus / Boeing

Symbol KCOADU
SVSP Name Barrier Reverse Convertible
SPVSP Code 1230 (Auto-Callable)
Underlyings Airbus / Boeing
Currency EUR
Coupon 7.50% p.a.
Kick-In Level 60.00%
Expiry 12.10.2020
Issuer UBS AG, London
Subscription until 10.10.2018, 15:00 h
 

More UBS products and further information on the risks and opportunities are available at ubs.com/keyinvest.

Source: UBS AG, Bloomberg

As of: 03.10.2018

¹) Please be aware that past performance does not indicate future results.
²) The conditions of ETTs are reviewed on a yearly basis and can be adjusted with a deadline of 13 months after the announcement.
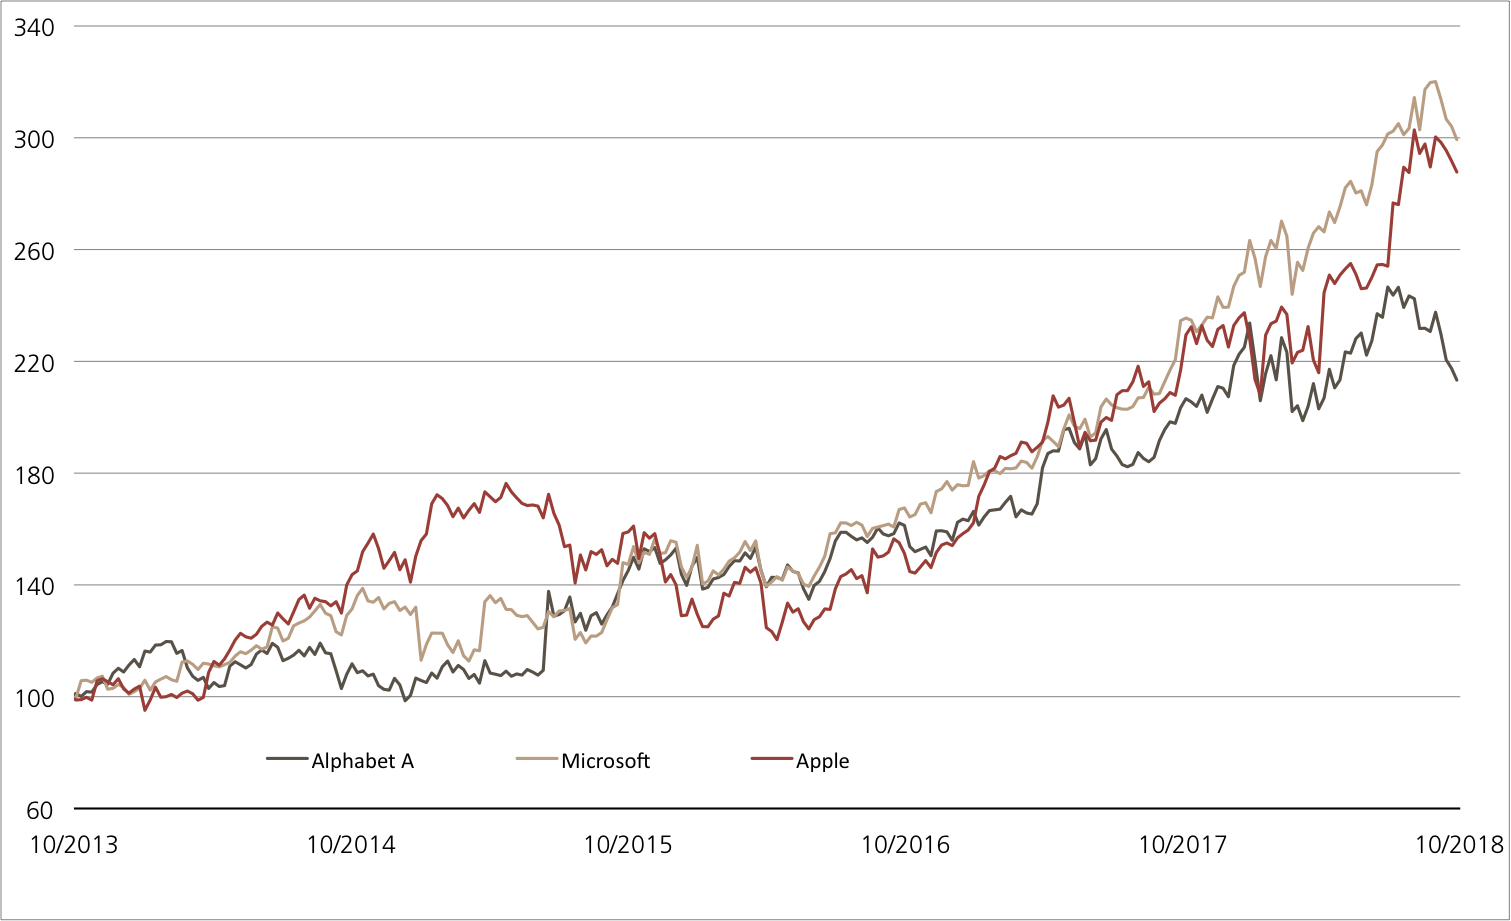
This material has been prepared by UBS AG or one of its affiliates («UBS»). This material is for distribution only as permitted by law. It is not prepared for the needs of any specific recipient. It is published solely for information and is not a solicitation or offer to buy or sell any securities or related financial instruments (“Instruments”). UBS makes no representation or warranty, either express or implied, on the completeness or reliability of the information contained in this document (“Information”) except that concerning UBS AG and its affiliates. The Information should not be regarded by recipients as a substitute for using their own judgment. Any opinions expressed in this material may change without notice and may be contrary to opinions expressed by other business areas of UBS as a result of using different assumptions or criteria. UBS is under no obligation to update the Information. UBS, its officers, employees or clients may have or have had an interest in the Instruments and may at any time transact in them. UBS may have or have had a relationship with entities referred to in the Information. Neither UBS nor any of its affiliates, or their officers or employees, accepts any liability for any loss arising from use of the Information. This presentation is not a basis for entering into a transaction. Any transaction between you and UBS will be subject to the detailed provisions of the term sheet, confirmation or electronic matching systems relating to that transaction. Clients wishing to effect transactions should contact their local sales representative.
This information is communicated by UBS AG and/or its affiliates («UBS»). * (see below) UBS may from time to time, as principal or agent, have positions in, or may buy or sell, or make a market in any securities, currencies, financial instruments or other assets underlying the product to which this website relates (the «Structured Product»). UBS may provide investment banking and other services to and/or have officers who serve as directors of the companies referred to in this website. UBS’s trading and/or hedging activities related to the Structured Product may have an impact on the price of the underlying asset and may affect the likelihood that any relevant barrier or relevant trigger event is crossed or triggered. UBS has policies and procedures designed to minimise the risk that officers and employees are influenced by any conflicting interest or duty and that confidential information is improperly disclosed or made available. UBS may pay or receive brokerage or retrocession fees in connection with the Structured Product described herein. In respect of any Structured Product that is a security, UBS may, in certain circumstances, sell the Structured Product to dealers and other financial institutions at a discount to the issue price or rebate to them for their own account some proportion of the issue price. Further information is available on request. Structured Products are complex and may involve a high risk of loss. Prior to purchasing the Structured Product you should consult with your own legal, regulatory, tax, financial and accounting advisors to the extent you consider it necessary, and make your own investment, hedging and trading decisions (including decisions regarding the suitability of the Structured Product) based upon your own judgement and advice from those advisers you consider necessary. Save as otherwise expressly agreed in writing, UBS is not acting as your financial adviser or fiduciary in relation to the Product. UBS generally hedges its exposure to Structured Products, although it may elect not to hedge or to partially hedge any Structured Product. UBS’s hedging activity may be conducted through transactions in the underlying asset, index or instrument or in options, futures or other derivatives related to the underlying asset, index or instrument on publicly traded markets or otherwise, and may have an impact on the price of the under-lying asset. If a transaction is cash settled, UBS will generally unwind or offset any hedge it has for such Structured Product in close proximity to the relevant valuation time or period. In some cases, this activity may affect the value of the Structured Product. Unless stated otherwise in this document, (i) this document is for information purposes only and should not be construed as an offer, personal recommendation or solicitation to purchase the Structured Product and should not be treated as giving investment advice, and (ii) the terms of any investment in the Structured Product will be exclusively subject to the detailed provisions, including risk considerations, contained in the more detailed legal documentation that relates to the Structured Product (being the confirmation, information memorandum, prospectus or other issuer documentation as relevant). UBS makes no representation or warranty relating to any information herein which is derived from independent sources. This document shall not be copied or reproduced without UBS’s prior written permission. In respect of any Structured Product that is a security, no action has been or will be taken in any jurisdiction that would permit a public offering of the Product, save where explicitly stated in the issuer documentation. The Structured Product must be sold in accordance with all applicable selling restrictions in the jurisdictions in which it is sold.
© UBS 2018. All rights reserved. UBS prohibits the forwarding of this information without the approval of UBS.
Weekly-Hits edition of 08.10.20182018-10-08T07:06:13+02:00

Weekly-Hits edition of 28.09.2018

KeyInvest Weekly Hits

Friday, 28.09.2018

dax
  • Topic 1: Germany – A warm fall
  • Topic 2: Ferrari/Porsche – Luxury car bodies in new splendor

Germany
A warm fall

Just as it enters the year of its 30th anniversary, the DAX™ has been thrown out of step. Since the start of the year, the Deutscher Aktienindex™, launched on July 1, 1988, has recorded a negative performance of 4.4%.¹ As is the case on other stock exchanges, the simmering trade conflict is regarded as the main source of friction for the German stock market. Nevertheless, the current ifo Business Climate Index shows that the mood within the German economy remains at a comparatively high level despite all of the factors contributing to the uncertainty. With an ETT (symbol: ETDAX), investors can use the current weakness in the DAX™ to enter the market. While the participation product is directly linked to the fluctuating performances of 30 large caps, the aim of the new Worst of Kick-In GOAL on Bayer, SAP and Volkswagen (symbol: KCMSDU) is to achieve a relatively stable performance. The DAX™ trio allow a coupon of 6.50 percent p.a. This return opportunity is linked to a 40% safety buffer.

Every month, the Munich-based ifo Institute asks around 9,000 managers about the current situation on the markets and their expectations for the next six months. This survey helps form the Business Climate Index, which is one of the most important early indicators for the German economy. Although the barometer became slightly gloomier in September, falling to 103.7 points after totaling 103.9 points in the previous month, the Index still remained at a historically high level. “The German economy is stable, even if there is increasing uncertainty,” commented Clemens Fuest, President of the ifo Institute, on the latest results. (Source: ifo Institute press release, 24.09.2018)

The customs dispute between the US and China that continues to simmer is weighing heavily on the mood on the Frankfurt Stock Exchange. Added to this is an instable political situation, which is unusual for Germany. Nevertheless, the Grand Coalition of the CDU, CSU and SPD would now like to focus on the business at hand after the recent quarrels regarding Hans-Georg Maassen, former President of the Federal Office for the Protection of the Constitution. The German regional elections in Bavaria and Hesse on October 14 and 28, respectively, could be indicatory in this respect. In addition to the two polls, DAX™ investors are likely to keep a close eye on the reporting season over the coming weeks, as this will show whether and to what extent the protectionism that is emerging worldwide is having an impact on the business of the major export-oriented German corporations.

Opportunities: Should the results of the elections cure the DAX™ of its recent lethargy, the ETT (symbol: ETDAX) would be an effective investment instrument. The open-end product tracks the key index with a conversion ratio of 10:1. Investors also benefit from the attractive profit sharing schemes of the German large caps, with dividends being reinvested in net terms. No management fees are typically incurred for this structure.² SAP traditionally kicks off the reporting season on the DAX, with the software group presenting its quarterly figures on October 18. Together with those of Bayer and Volkswagen, the SAP share serves as the underlyings for a new Worst of Kick-In GOAL (symbol: KCMSDU). Investors can make concrete plans here thanks to an annual coupon payment of 6.50%. If none of the shares fall level with or below the barrier of 60% of the initial fixings, investors will also receive their nominal amount back in full at the end of the term.

Risks: These products do not have capital protection. The ETT will make a loss if the underlying index falls below the initial price. If the underlyings of the Worst of Kick-In GOAL touch or fall below the respective Kick-In Level (barrier), the amount repaid on the maturity date is reflecting the worst performance of the underlyings (but not more than notional value plus coupon). In this case, it is likely that losses will be incurred. Investors in structured products are also exposed to issuer risk, which means that the capital invested may be lost if UBS AG becomes insolvent, regardless of the performance of the underlying.

More UBS products and further information on the risks and opportunities are available at ubs.com/keyinvest.

DAX™ (5 years)¹

Consolidation at a high level: The DAX™ has been trending sideward for more than a year. During this time, the area has emerged as a support level for the benchmark at around 12,000 points.

Source: UBS AG, Bloomberg

As of 27.09.2018

Bayer vs. SAP vs. Volkswagen (5 years)¹

Three equities, two directions: While Bayer and Volkswagen have posted a negative performance over the last five years, the DAX™ heavyweight SAP was able to significantly increase its market capitalization.

Source: UBS AG, Bloomberg

As of: 27.09.2018

¹) Please be aware that past performance does not indicate future results.
²) The conditions of ETTs are reviewed on a yearly basis and can be adjusted with a deadline of 13 months after the announcement.
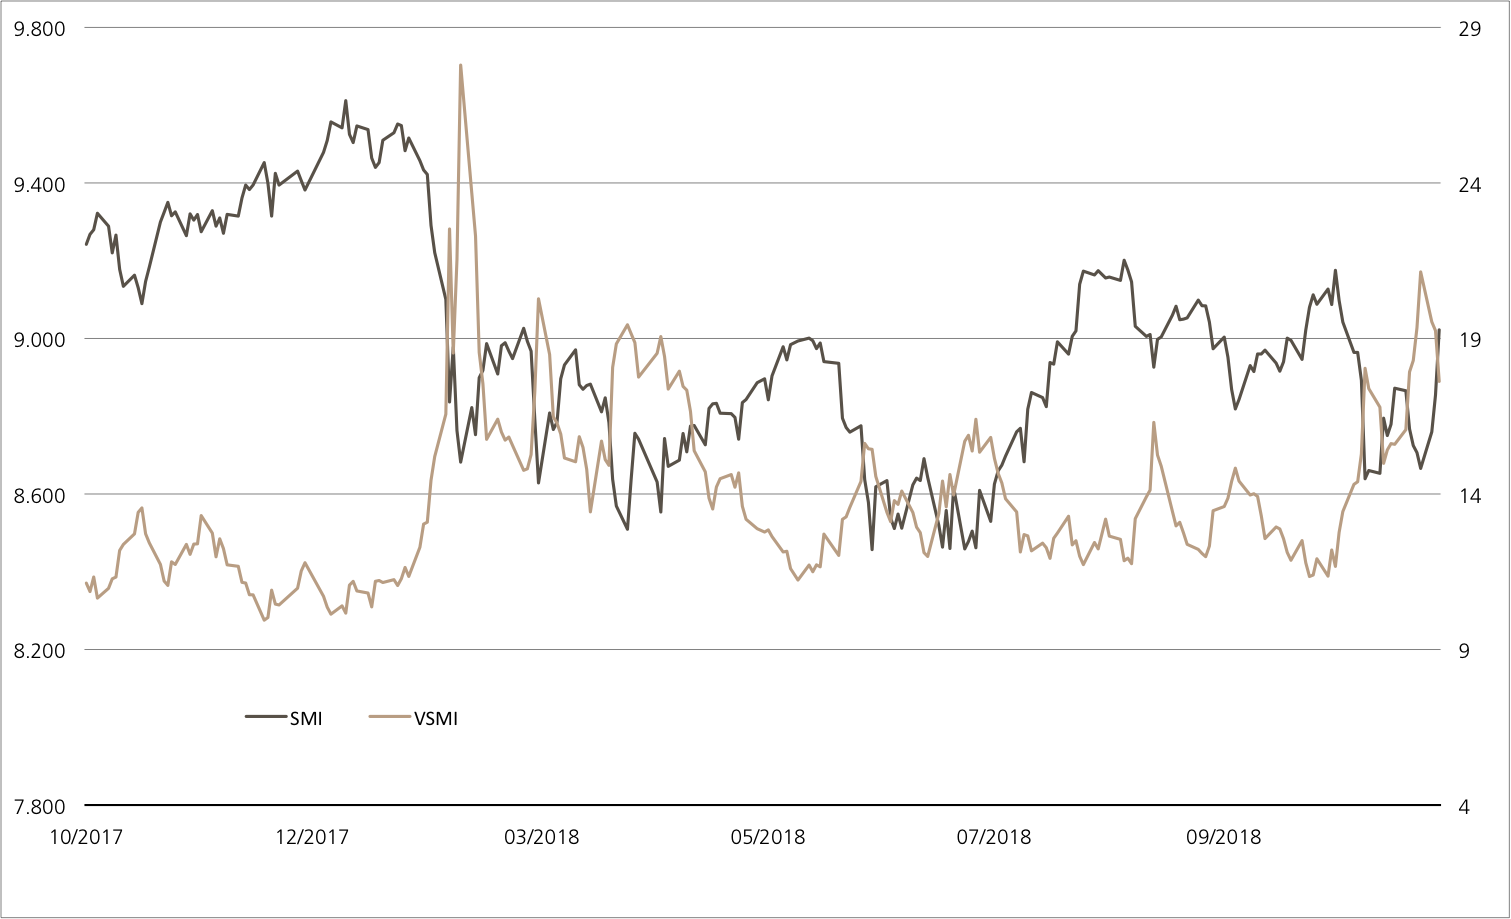
ETT on DAX™

Symbol ETDAX
SVSP Name Tracker-Certificate
SPVSP Code 1300
Underlying DAX™
Ratio 10:1
Currency EUR
Administration fee 0.00% p.a.
Participation 100%
Expiry Open End
Issuer UBS AG, London
Bid/Ask EUR 1’235.00 / 1’241.00
 

6.50% p.a. Worst of Kick-In GOAL auf Bayer / SAP / Volkswagen

Symbol KCMSDU
SVSP Name Barrier Reverse Convertible
SPVSP Code 1230
Underlying Bayer / SAP / Volkswagen VZ
Currency EUR
Coupon 6.50% p.a.
Kick-In Level 60.00%
Expiry 03.04.2020
Issuer UBS AG, London
Subscription until 03.10.2018, 15:00 h
 

More UBS products and further information on the risks and opportunities are available at ubs.com/keyinvest.

Source: UBS AG, Bloomberg

As of: 27.09.2018

Market overview

Index Quotation Week¹
SMI™ 9’080.14 1.6%
SLI™ 1’488.24 1.6%
S&P 500™ 2’905.97 -0.1%
Euro STOXX 50™ 3’433.15 1.9%
S&P™ BRIC 40 4’056.94 2.1%
CMCI™ Compos. 943.22 1.4%
Gold (troy ounce) 1’199.10 -0.8%

¹ Change based on the closing price of the previous day compared to the closing price a week ago.

SMI™ vs. VSMI™ 1 year

smi vs vsmi

The VSMI™ Index is calculated since 2005. It shows the volatility of the stocks within the SMI™ index. A portfolio which reacts only to changes in volatility instead of volatility itself is relevant for the calculation. Thereby, the VSMI™ methodology uses the squared volatility, known as variance, of the SMI options with remaining time to expiry of 30 days traded at the Eurex.

Source: UBS AG, Bloomberg

As of: 27.09.2018

Ferrari/Porsche
Luxury car bodies in new splendor

The events in the sports car segment are coming thick and fast at the moment, as luxury manufacturer Ferrari wants to place 15 new models on the market by 2022. Their aim by this point in time is for some 60% of their cars to come equipped with a hybrid engine. Alternative engines are also a hot topic at rivals Porsche. The company was the first German car maker to announce its intention to withdraw from the diesel market. It now focuses solely on gasoline engines, hybrid models and electric vehicles. Investors have the option of including both of the car stocks in their portfolio. The new Worst of Kick-In GOAL (symbol: KCOIDU) in subscription has an attractive annual coupon of 8% and offers a safety buffer of 30%.

The traditional combustion engine is increasingly becoming obsolete. Electric engines are now also making waves in the sports car industry. Porsche has removed diesel engines from its product range and increased its focus in the areas of hybrid and electric mobility. It is estimated that more than EUR 6 billion will be pumped into these technologies by 2022. As early as 2025, every second new Porsche vehicle could be electrically powered, be it via a hybrid engine or a completely electric engine. The long-established Italian company Ferrari is also following this path. At its recent presentation of the new medium-term development plan in Maranello, CEO Louis Camilleri announced a plethora of new models – with 15 new models and model variants being planned to be released in the three areas of Sport, GT and Special Series between 2019 and 2022. This will also include a sporty all-terrain vehicle, which has suffered long delays. The aim of this offensive push is to further diversify the current product range. By 2022, some 60% of the Ferraris produced will be hybrid models. This should also see profits increasing further. The Group’s operating margin is expected to reach 38% in 2022, after totaling 31.9% in the second quarter of 2018.

Opportunities: Should any investors want the two luxury car body manufacturers to be part of their portfolio as a pair, they would be advised to take a look at the Worst of Kick-In GOAL (symbol: KCOIDU). The configuration of this new issue is very impressive – The product is in subscription and has an annual coupon of 8% as well as an initial risk buffer of 30%. Provided that neither the Ferrari share nor the Porsche share fall level with or below the barrier of 70% of the initial fixing level, the maximum return will be paid out. The product issued in Swiss francs includes currency hedging. The security matures after exactly one year.

Risks: This product does not have capital protection. If the underlyings touch or fall below the respective Kick-In Level (barrier), the amount repaid on the maturity date is reflecting the worst performance of the underlyings (but not more than notional value plus coupon). In this case, it is likely that losses will be incurred. Investors in structured products are also exposed to issuer risk, which means that the capital invested may be lost if UBS AG becomes insolvent, regardless of the performance of the underlying.

More UBS products and further information on the risks and opportunities are available at ubs.com/keyinvest.

Ferrari vs. Porsche (since 04.01.2016, Start Ferrari-Listing in Mailand)¹

Source: UBS AG, Bloomberg

As of: 27.09.2018

8.00% p.a. Worst of Kick-In GOAL on Porsche / Ferrari

Symbol KCOIDU
SVSP Name Barrier Reverse Convertible
SPVSP Code 1230
Underlyings Ferrari / Porsche
Currency CHF (Quanto)
Coupon 8.00% p.a.
Kick-In Level 70.00%
Expiry 10.10.2019
Issuer UBS AG, London
Subscription until 10.10.2018, 15:00 h
 

More UBS products and further information on the risks and opportunities are available at ubs.com/keyinvest.

Source: UBS AG, Bloomberg

As of: 27.09.2018

¹) Please be aware that past performance does not indicate future results.
²) The conditions of ETTs are reviewed on a yearly basis and can be adjusted with a deadline of 13 months after the announcement.
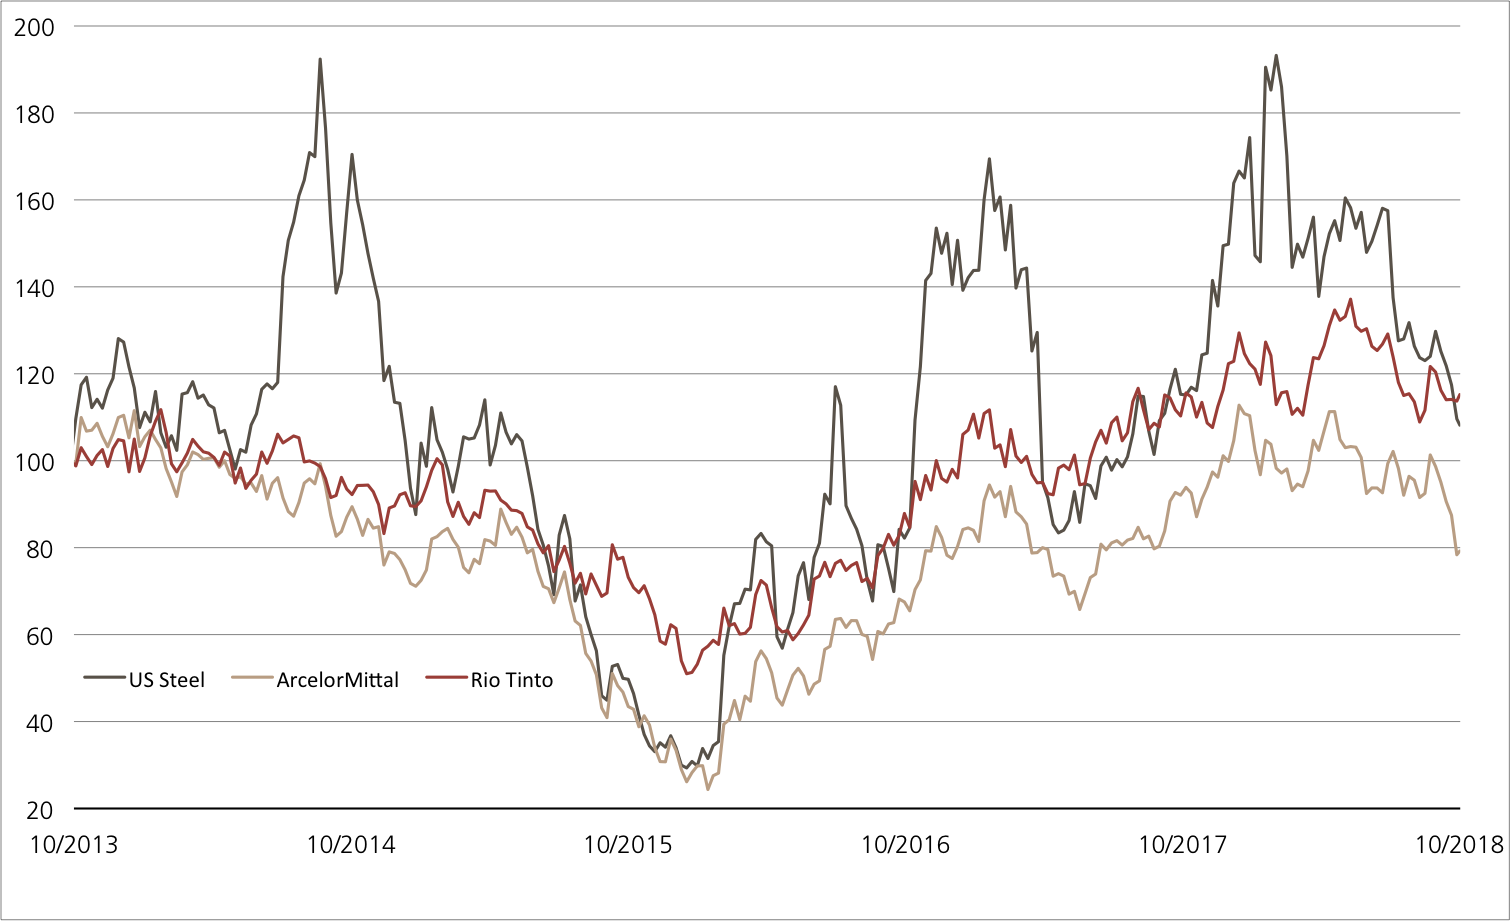
This material has been prepared by UBS AG or one of its affiliates («UBS»). This material is for distribution only as permitted by law. It is not prepared for the needs of any specific recipient. It is published solely for information and is not a solicitation or offer to buy or sell any securities or related financial instruments (“Instruments”). UBS makes no representation or warranty, either express or implied, on the completeness or reliability of the information contained in this document (“Information”) except that concerning UBS AG and its affiliates. The Information should not be regarded by recipients as a substitute for using their own judgment. Any opinions expressed in this material may change without notice and may be contrary to opinions expressed by other business areas of UBS as a result of using different assumptions or criteria. UBS is under no obligation to update the Information. UBS, its officers, employees or clients may have or have had an interest in the Instruments and may at any time transact in them. UBS may have or have had a relationship with entities referred to in the Information. Neither UBS nor any of its affiliates, or their officers or employees, accepts any liability for any loss arising from use of the Information. This presentation is not a basis for entering into a transaction. Any transaction between you and UBS will be subject to the detailed provisions of the term sheet, confirmation or electronic matching systems relating to that transaction. Clients wishing to effect transactions should contact their local sales representative.
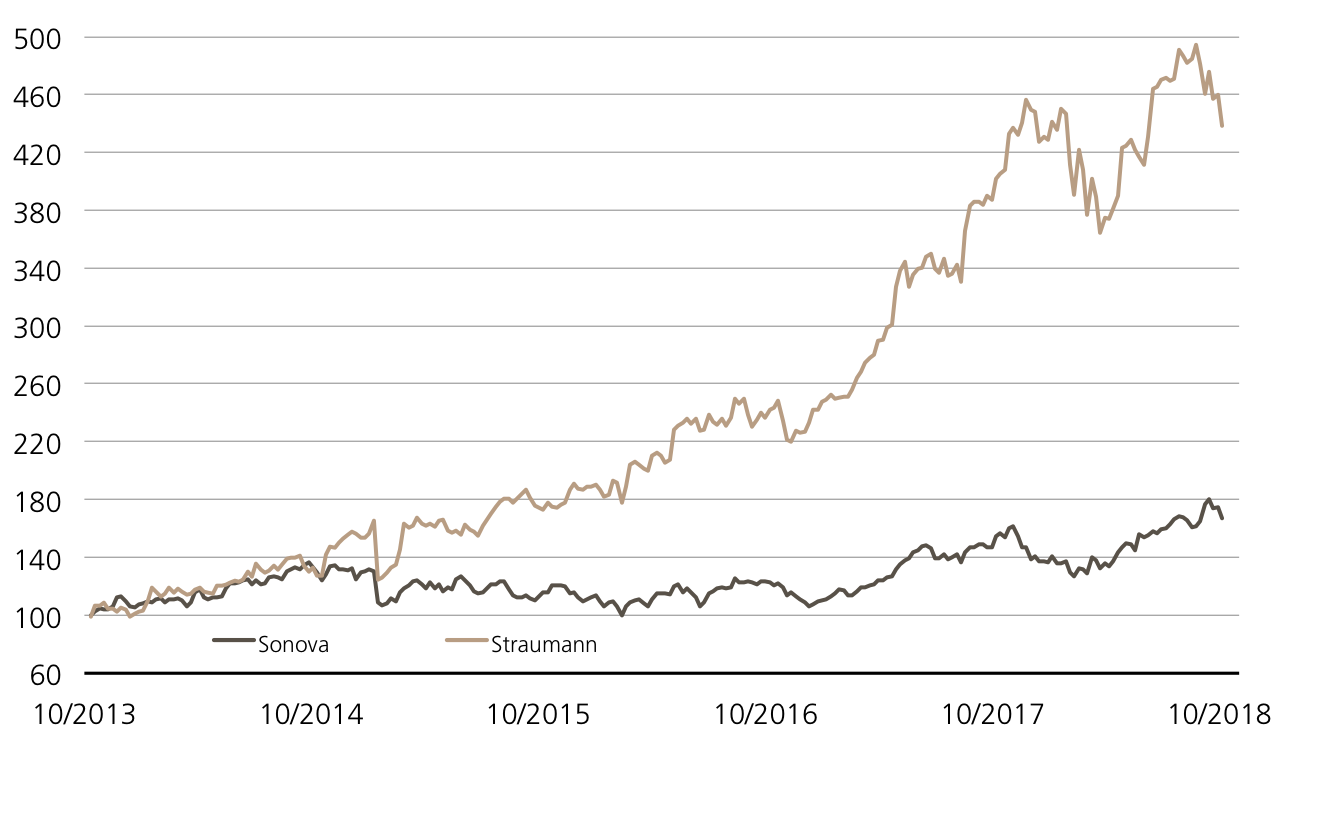
This information is communicated by UBS AG and/or its affiliates («UBS»). * (see below) UBS may from time to time, as principal or agent, have positions in, or may buy or sell, or make a market in any securities, currencies, financial instruments or other assets underlying the product to which this website relates (the «Structured Product»). UBS may provide investment banking and other services to and/or have officers who serve as directors of the companies referred to in this website. UBS’s trading and/or hedging activities related to the Structured Product may have an impact on the price of the underlying asset and may affect the likelihood that any relevant barrier or relevant trigger event is crossed or triggered. UBS has policies and procedures designed to minimise the risk that officers and employees are influenced by any conflicting interest or duty and that confidential information is improperly disclosed or made available. UBS may pay or receive brokerage or retrocession fees in connection with the Structured Product described herein. In respect of any Structured Product that is a security, UBS may, in certain circumstances, sell the Structured Product to dealers and other financial institutions at a discount to the issue price or rebate to them for their own account some proportion of the issue price. Further information is available on request. Structured Products are complex and may involve a high risk of loss. Prior to purchasing the Structured Product you should consult with your own legal, regulatory, tax, financial and accounting advisors to the extent you consider it necessary, and make your own investment, hedging and trading decisions (including decisions regarding the suitability of the Structured Product) based upon your own judgement and advice from those advisers you consider necessary. Save as otherwise expressly agreed in writing, UBS is not acting as your financial adviser or fiduciary in relation to the Product. UBS generally hedges its exposure to Structured Products, although it may elect not to hedge or to partially hedge any Structured Product. UBS’s hedging activity may be conducted through transactions in the underlying asset, index or instrument or in options, futures or other derivatives related to the underlying asset, index or instrument on publicly traded markets or otherwise, and may have an impact on the price of the under-lying asset. If a transaction is cash settled, UBS will generally unwind or offset any hedge it has for such Structured Product in close proximity to the relevant valuation time or period. In some cases, this activity may affect the value of the Structured Product. Unless stated otherwise in this document, (i) this document is for information purposes only and should not be construed as an offer, personal recommendation or solicitation to purchase the Structured Product and should not be treated as giving investment advice, and (ii) the terms of any investment in the Structured Product will be exclusively subject to the detailed provisions, including risk considerations, contained in the more detailed legal documentation that relates to the Structured Product (being the confirmation, information memorandum, prospectus or other issuer documentation as relevant). UBS makes no representation or warranty relating to any information herein which is derived from independent sources. This document shall not be copied or reproduced without UBS’s prior written permission. In respect of any Structured Product that is a security, no action has been or will be taken in any jurisdiction that would permit a public offering of the Product, save where explicitly stated in the issuer documentation. The Structured Product must be sold in accordance with all applicable selling restrictions in the jurisdictions in which it is sold.
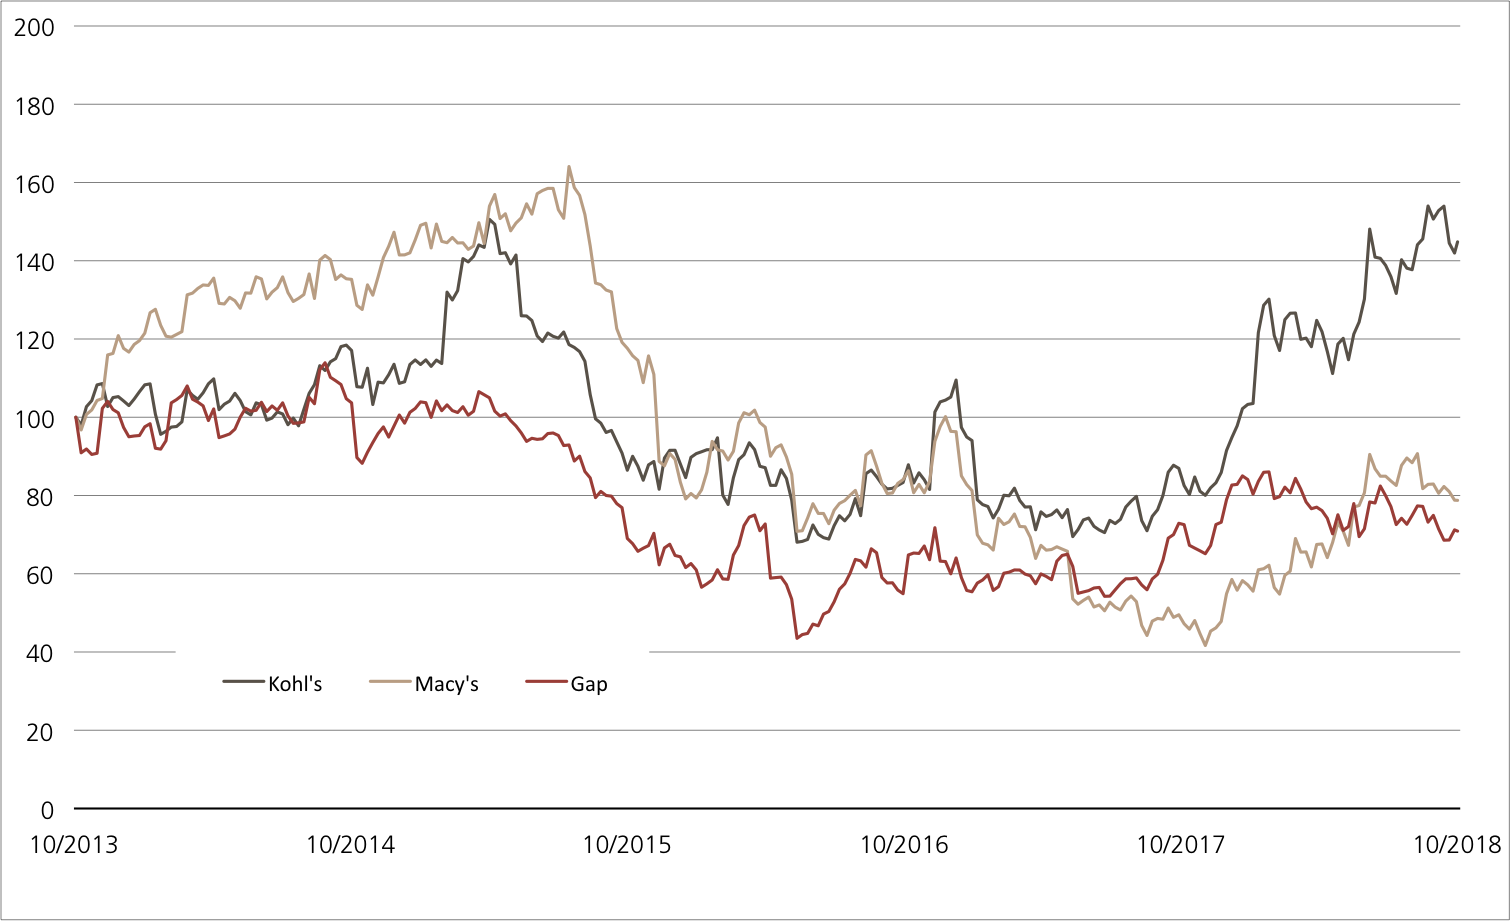
© UBS 2018. All rights reserved. UBS prohibits the forwarding of this information without the approval of UBS.
Weekly-Hits edition of 28.09.20182018-09-28T11:34:20+02:00
Go to Top