Weekly-Hits: Automobilindustrie, Facebook & Twitter

- Thema 1: Automobilindustrie – Vorhang auf für die Zukunft
- Thema 2: Facebook/Twitter – Innovationsgetriebenes Duo
Automobilindustrie
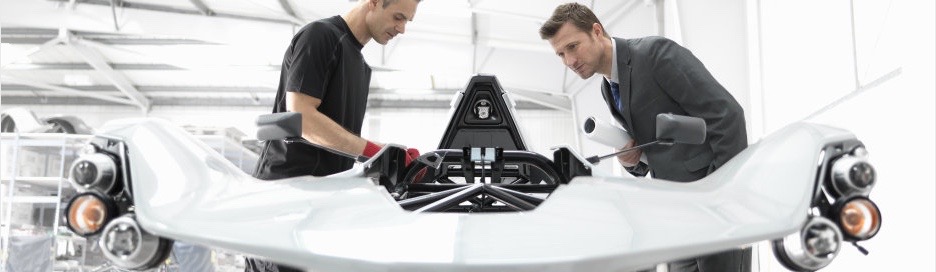
Vorhang auf für die Zukunft
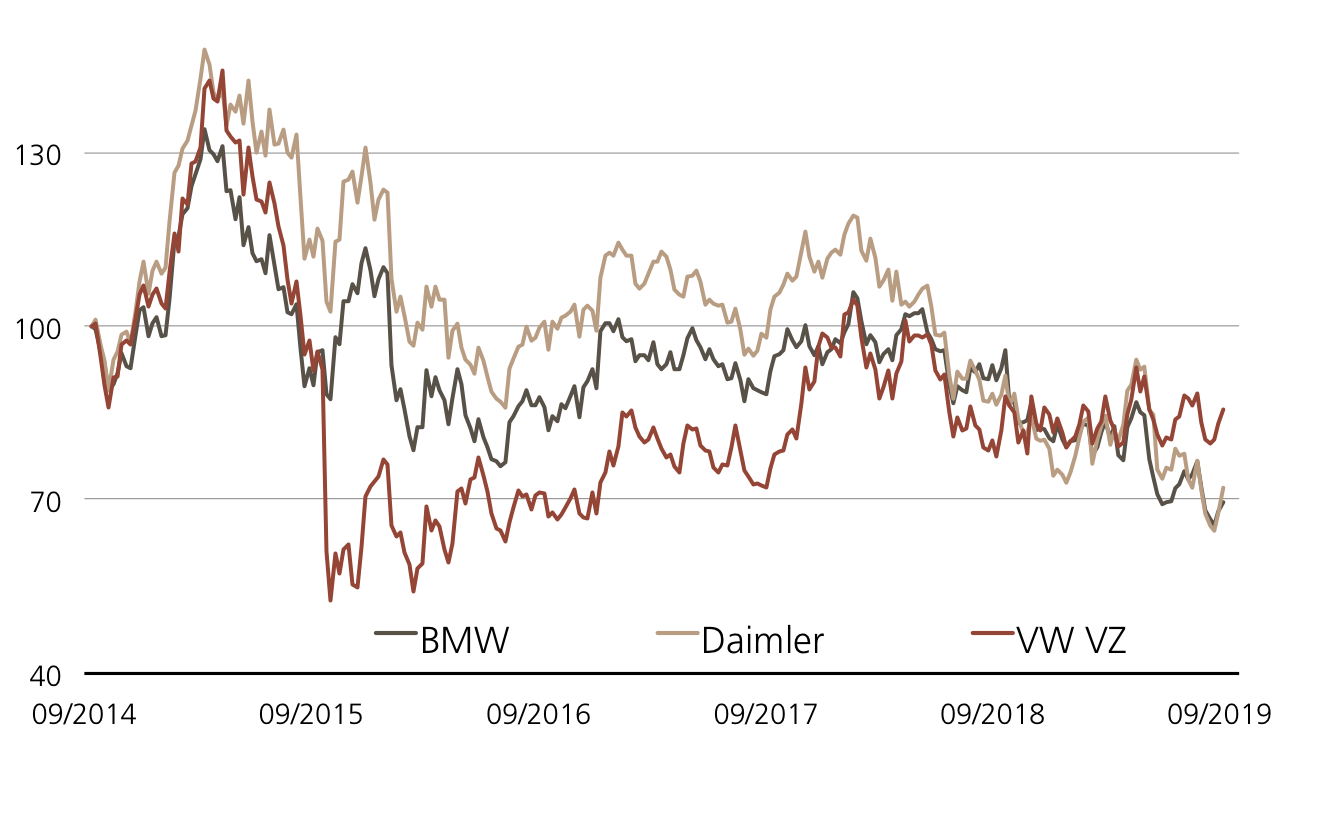
Auf der IAA treffen sich längst nicht mehr nur die klassischen Autohersteller, auch Zulieferer und Anbieter neuester Mobilitätsdienstleistungen sowie innovative Tech-Unternehmen aus aller Welt reisen nach Frankfurt. Elektro-Antriebe sowie Digitalisierung und Vernetzung zählen zu den wichtigen Wachstumstreibern in der Branche. Laut der Experten von Kenneth Research wird der Markt für intelligente Mobilität zwischen 2017 und 2023 voraussichtlich um durchschnittlich 19.9 Prozent pro Jahr zulegen. (Quelle: Kenneth Research, Medienmitteilung, 02.04.2019) Grosse Hoffnungen setzt die Branche zudem auf selbstfahrende Fahrzeuge. Die Studie „Branchenkompass Automotive 2019“ von Sopra Steria Consulting und dem F.A.Z.-Institut kommt zu dem Ergebnis, dass 68 Prozent der befragten Automobilhersteller und Zulieferer die Zukunft der Branche in autonomen Autos sehen. So arbeitenbeispielsweise die beiden deutschen Hersteller Daimler und BMW im Rahmen eines Joint Venture an gemeinsamen Mobilitätsprojekten.
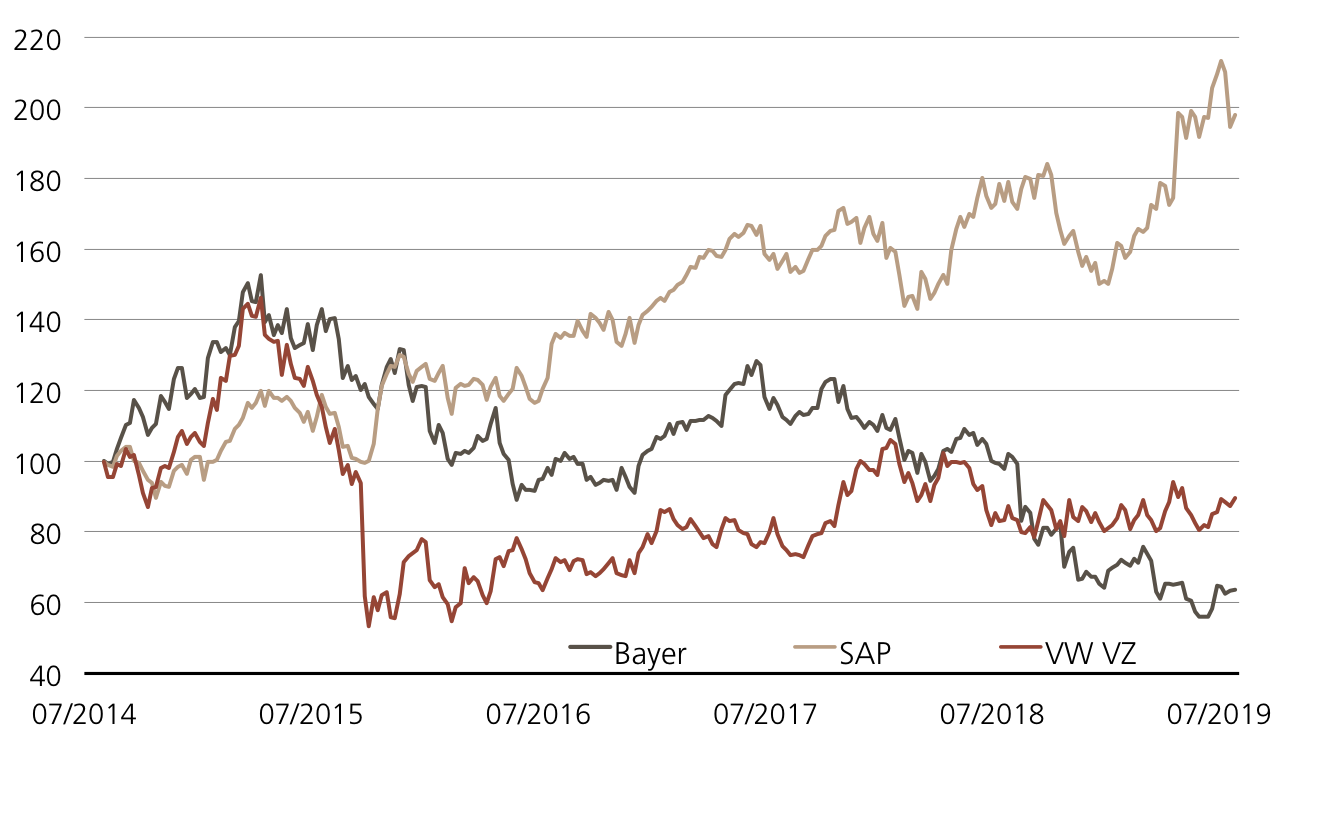
VW macht derweil gemeinsame Sache mit Ford. 2.6 Milliarden US-Dollar haben die Wolfsburger dafür in die Ford-Tochter Argo AI gesteckt, die Systeme für selbstfahrende Autos entwickelt. (Quelle: Thomson Reuters, Medienbericht, 12.07.2019) Auf der IAA sorgt das Unternehmen allerdings vorerst mit einem E-Modell für ein Highlight: dem ID.3. Dabei handelt es sich um ein vollelektrisches Fahrzeug, welches die breite Käuferschicht ansprechen soll. Zudem zeigte sich VW-Chef Herbert Diess am Vorabend der Automesse trotz Brexit und Handelskriege zuversichtlich für das operative Geschäft: «Wir haben Marktanteile weltweit dazugewonnen.» Demzufolge blickt der CEO «verhalten optimistisch» auf den Rest des Jahres. (Quelle: Thomson Reuters, Medienbericht, 09.09.2019)
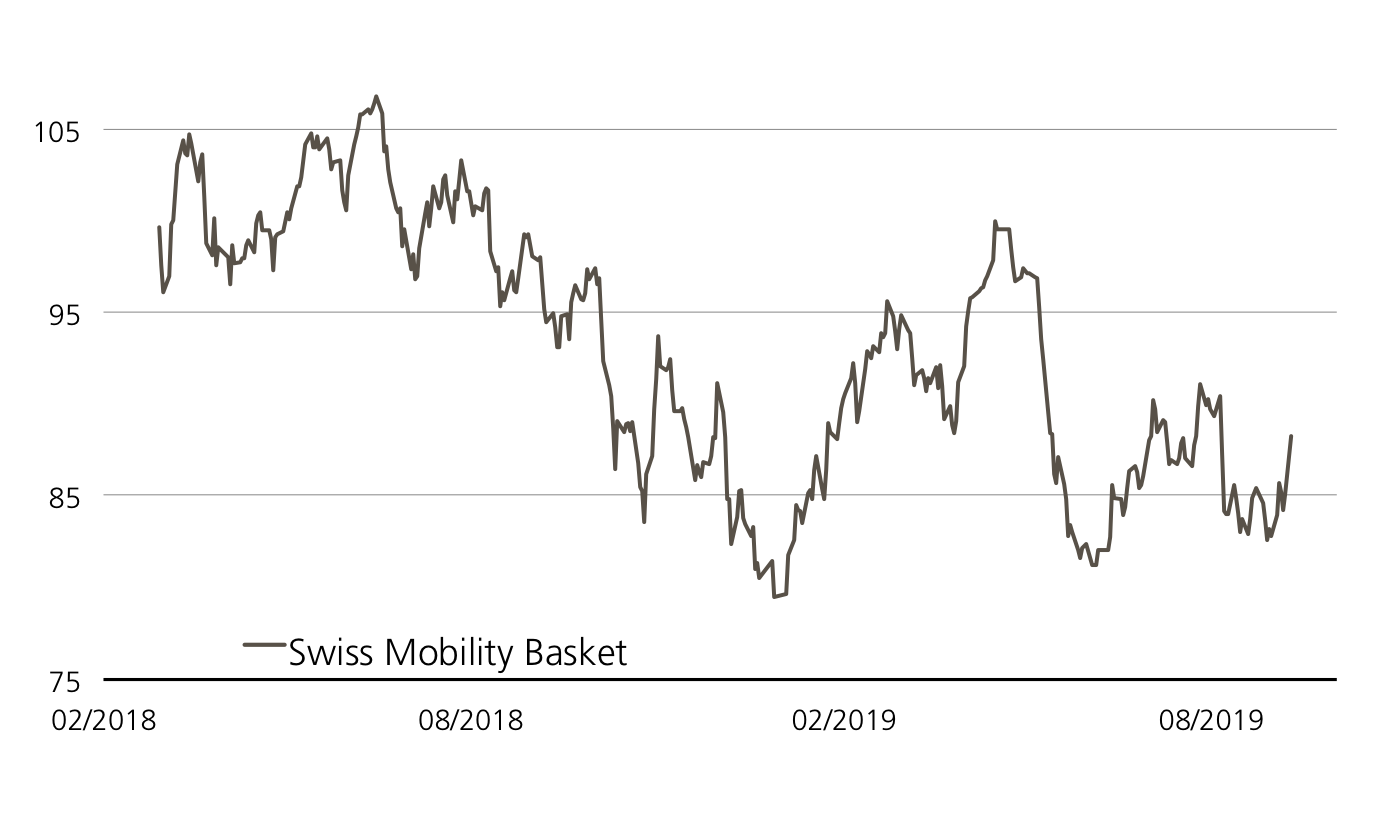
Chancen: Mit dem Smart Mobility Basket bekommen Anleger Zugang zu den innovativen Mobilitätskonzepten der Zukunft. In dem 16 Titel starken Korb befinden sich Unternehmen aus unterschiedlichsten Branchen wie Automobil, Halbleiter oder auch elektronische Ausrüstung. Mit von der Partie sind beispielsweise der chinesische E-Auto-Produzent BYD sowie der japanische Spezialist für autonomes Fahren Murata. Abzüglich einer Managementgebühr von 0.50 Prozent p.a spiegelt der PERLES (Symbol: MOBILU) die Kursentwicklung des Baskets vollständig wider. Ein etwas konservativeres Investment in den Auto-Sektor bietet der neue ER Kick-In GOAL (Symbol: KEEMDU) auf BMW, Daimler und VW. Der Coupon beträgt 8.50 Prozent p.a., die Barriere wird am 18. September bei 60 Prozent der Startkurse fixiert.
Risiken:Die vorgestellten Produkte sind nicht kapitalgeschützt. Bei einem PERLES kommt es zu Verlusten, sobald der zugrundeliegende Basket unter dem Einstiegspreis zu liegen kommt. Notiert einer der Basiswerte des Kick-In GOAL während der Laufzeit einmal auf oder unter dem jeweiligen Kick-In Level (Barriere) und kommt zudem das Early Redemption Feature nicht zum tragen, kann die Tilgung am Verfalltag durch Lieferung einer vorab durch das Bezugsverhältnis fixierten Anzahl des Basiswertes mit der schlechtesten Wertentwicklung (vom Strike aus) erfolgen (höchstens jedoch zum Nominalwert zuzüglich Coupon). In diesem Fall sind Verluste wahrscheinlich. Zudem trägt der Anleger bei strukturierten Produkten das Emittentenrisiko, so dass das eingesetzte Kapital – unabhängig von der Entwicklung der Basiswerte – im Falle einer Insolvenz der UBS AG verloren gehen kann.
| Index | Stand | Woche¹ | |
|---|---|---|---|
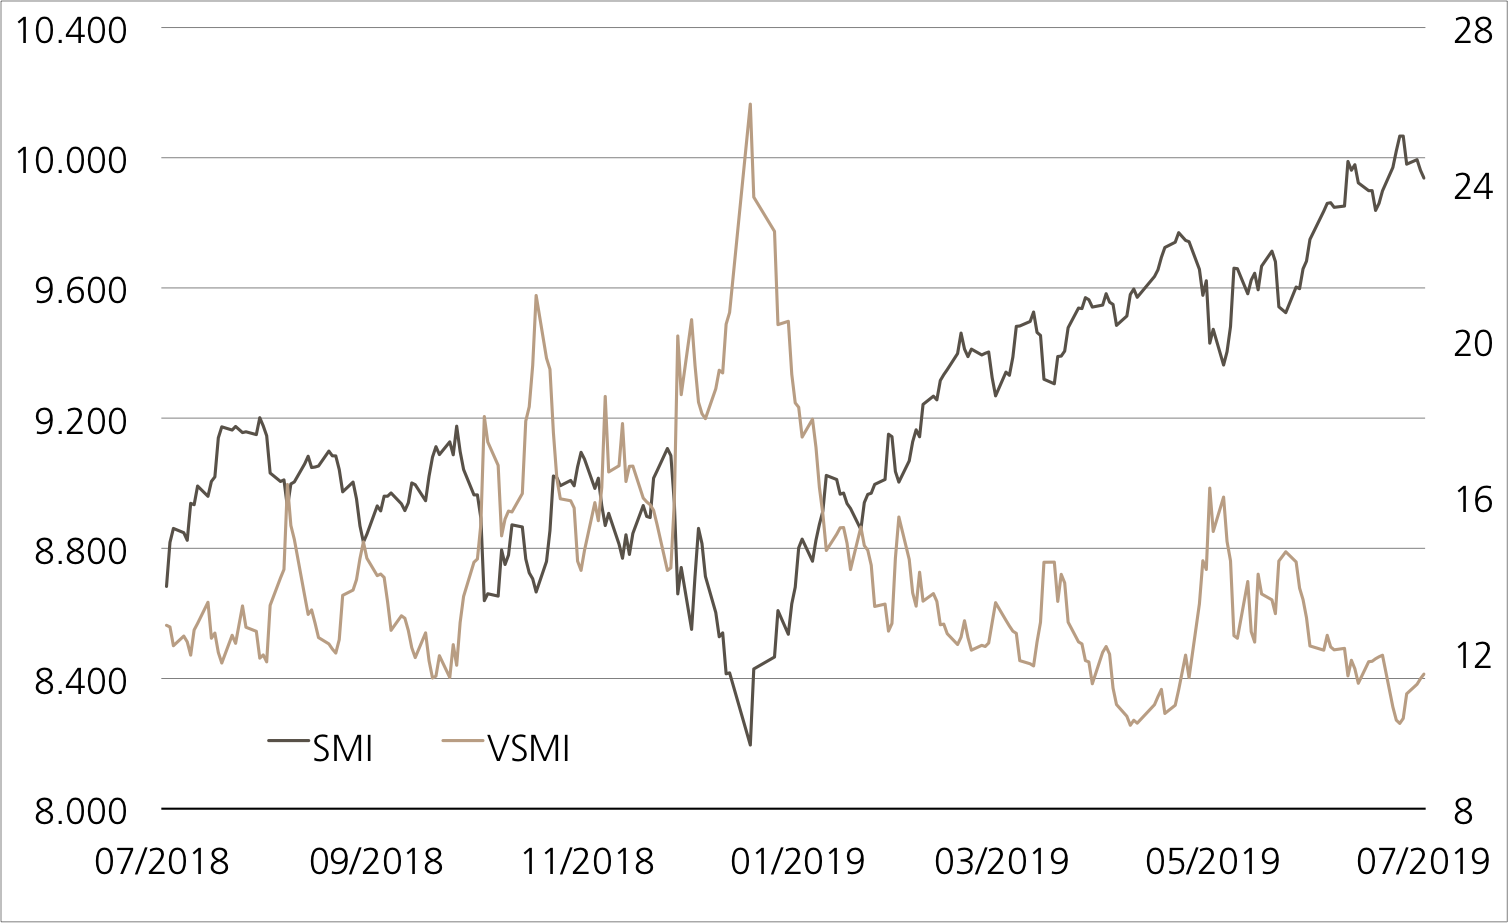
| SMI™ | 10’098.59 | 2.1% | |
| SLI™ | 1’550.08 | 3.1% | |
| S&P 500™ | 3’003.93 | 2.3% | |
| EURO STOXX 50™ | 3’516.82 | 1.9% | |
| S&P™ BRIC 40 | 4’208.30 | 2.9% | |
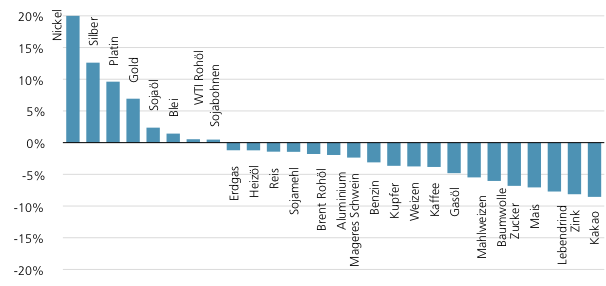
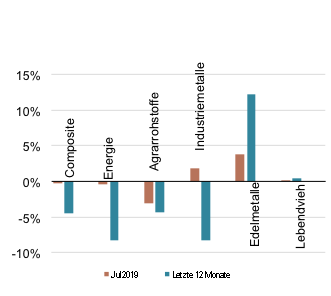
| CMCI™ Compos. | 880.39 | 0.5% | |
| Gold (Feinunze) | 1’503.20 | -3.7% | |
Facebook/Twitter
Innovationsgetriebenes Duo
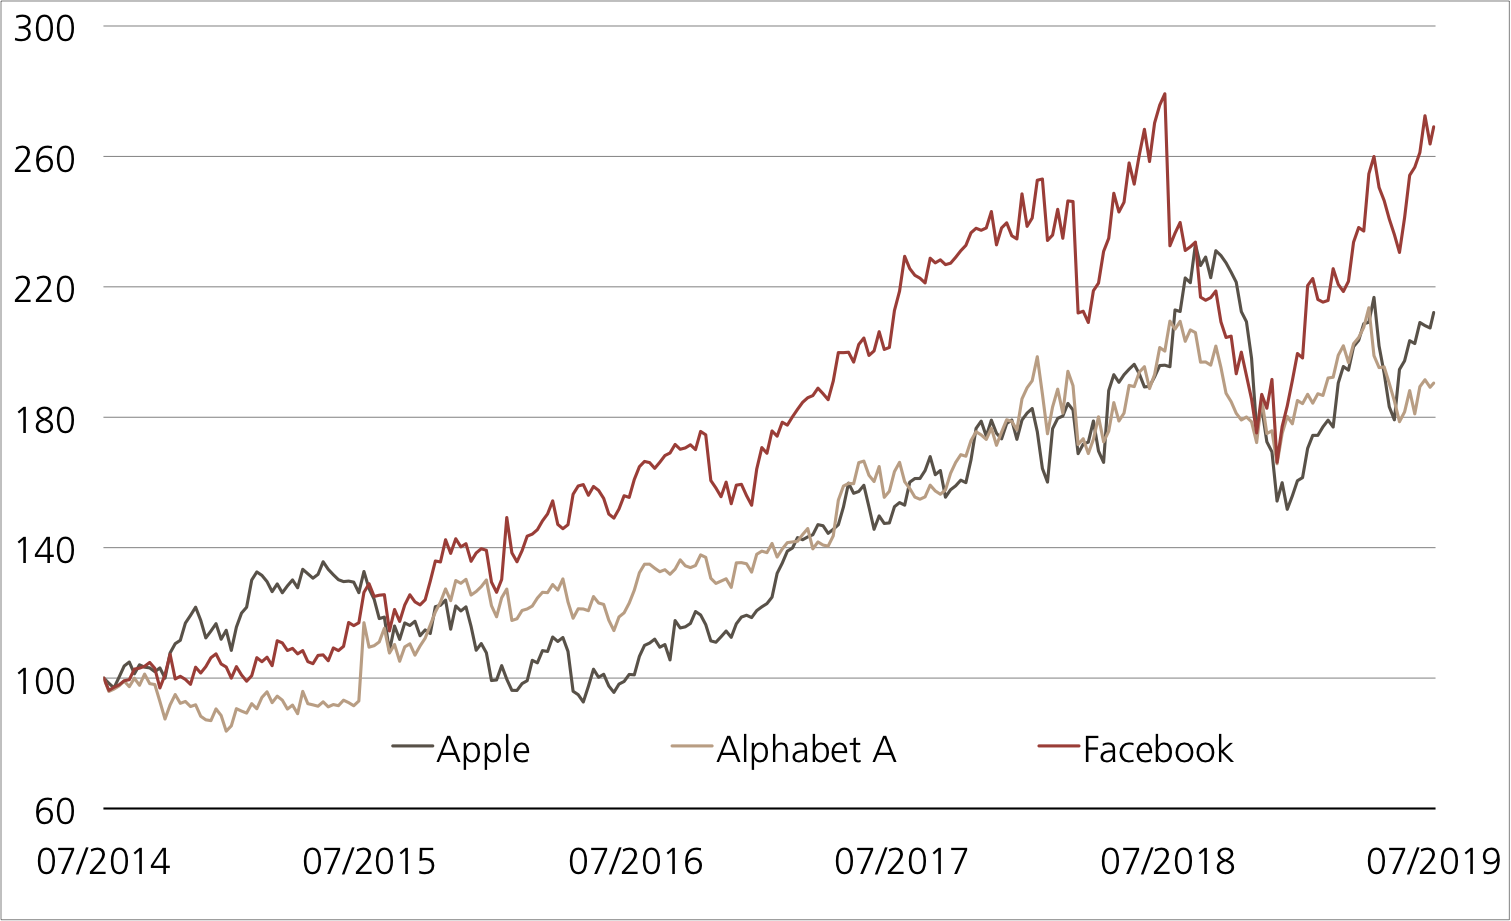
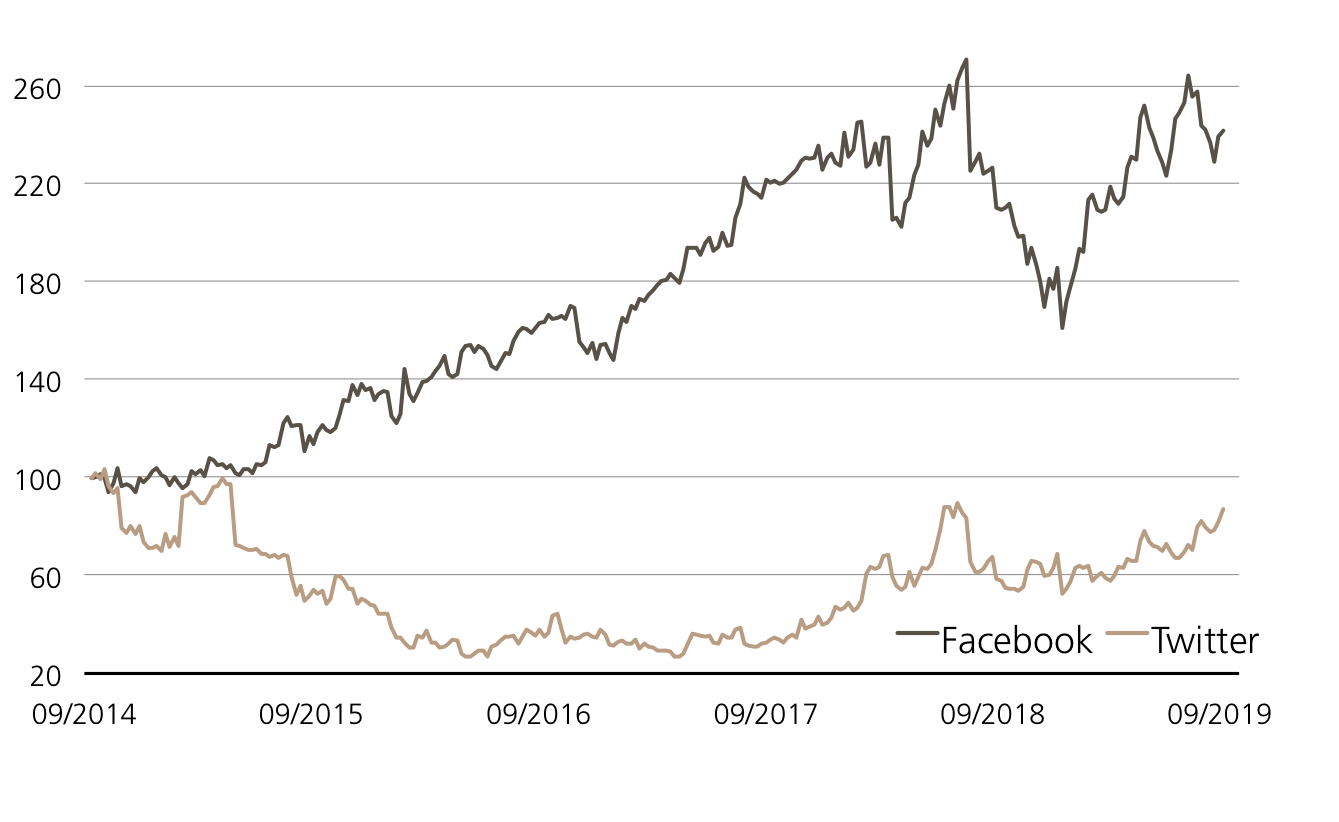
Chancen:Die Aktien von Facebook und Twitter waren im bisherigen Jahresverlauf auf Outperformancekurs. Um rund 43 respektive 50 Prozent ging es mit den beiden Titeln seit Jahresbeginn nach oben.¹ Für den in Zeichnung stehenden Kick-In GOAL (Symbol: KEEDDU) sind weitere Kursavancen allerdings nicht von Nöten. Das Produkt bietet eine ansehnliche Maximalrendite von 13.75 Prozent. Bedingung dafür ist, dass keiner der Basiswerte seine bei 60 Prozent der Startwerte fixierte Barriere innerhalb der kommenden zwölf Monate verletzt.
Risiken:Kick-In GOALs sind nicht kapitalgeschützt. Notiert einer der Basiswerte des Kick-In GOALs während der Laufzeit einmal auf oder unter dem jeweiligen Kick-In Level, kann die Tilgung am Verfalltag durch Bartilgung entsprechend der (vom Strike aus) schwächsten Performance aus dem Duo erfolgen (höchstens jedoch zum Nominalwert zuzüglich Coupon). In diesem Fall sind Verluste wahrscheinlich. Zudem trägt der Anleger bei strukturierten Produkten das Emittentenrisiko, so dass das eingesetzte Kapital – unabhängig von der Entwicklung der Basiswerte – im Falle einer Insolvenz der UBS AG verloren gehen kann.
13.75% p.a. Kick-In GOAL auf Facebook / Twitter
| Remove | ||
|---|---|---|
| Symbol | KEEDDU | |
| SVSP Name | Barrier Reverse Convertible | |
| SVSP Code | 1230 | |
| Basiswert | Facebook, Twitter | |
| Handelswährung | USD | |
| Coupon | 13.75% p.a. | |
| Kick-In Level (Barriere) | 60% | |
| Verfall | 18.09.2020 | |
| Emittentin | UBS AG, London | |
| Zeichnung bis | 18.09.2019, 15:00 Uhr | |
Termsheet Weitere Produkte sowie Informationen zu Chancen und Risiken finden Sie unter: ubs.com/keyinvest Quelle: UBS AG Stand: 11.09.2019