Weekly Hits: L’approvisionnement énergétique & Airbus / Boeing
Vendredi, 21.06.2019

- Thème 1: L’approvisionnement énergétique - Un secteur sous tension
- Thème 2: Airbus / Boeing - Duel à Paris
L’approvisionnement énergétique
Un secteur sous tension
Lorsqu’en bourse on entend le mot clé « disruption », il s’agit le plus souvent de mégatendances comme la robotique, la technologie financière ou les voitures autonomes. Toutefois, actuellement, les fournisseurs d’énergie subissent un véritable bouleversement. L’avancée des énergies renouvelables qui va de pair avec le changement climatique induit une mutation du secteur. Si l’on considère les cours des actions, la transformation des entreprises est sur la bonne voie. Le STOXX™ Europe 600 Utilities EUR Net Return Index est coté à son plus haut niveau depuis plus de onze ans. Un UBS ETT (symbole : ETUTI) reproduit l’indice à l’identique et sans limitation de durée. Avec Electricité de France (EDF), Enel et RWE, trois représentants renommés de la branche font office de sous-jacent pour un nouveau Callable Worst of Kick-In GOAL (symbole : KDTKDU). Avec un coupon de 8.50% p.a., le produit doté d’une barrière basse de 55% de chaque cours initial a une maturité de deux ans.
Fin 2018, dans le monde entier, on recensait des ressources d’énergie d’une capacité d’environ 2400 gigawatt (GW). Si le volume a ainsi progressé de 7.9% par rapport à l’année précédente, les capacités de l’électricité « verte » principalement hydraulique, photovoltaïque et éolienne ont plus que doublé depuis 2009. (Source : International Renewable Energy Agency (IRENA), Renewable Capacity Statistics 2019, mars 2019)
Bien évidemment, les grands fournisseurs ont un rôle décisif dans la transformation du mix énergétique. Ceci vaut aussi et précisément pour Iberdrola, le plus important membre de l’indice de la branche européen en pondération. Dans le monde entier, l’entreprise espagnole fournit tout juste 35 millions de personnes en électricité. Après le changement de siècle, Iberdrola a massivement investi dans les sources d’énergies renouvelables. Aujourd’hui, plus de 60% de la capacité globale de 47.4 GW proviennent de ce segment. (Source : Iberdrola, Factbook 2019, à décembre 2018). Les affaires marchent : au premier trimestre 2019, l’entreprise espagnole a fait progresser son bénéfice de 15%. La direction a par la suite révisé ses prévisions pour toute l’année à la hausse. (Source : Thomson Reuters, article de presse, 25.04.2019).
Enel, numéro 2 au STOXX™ Europe 600 Utilities Index mise lui aussi sur l’éolien, l’hydraulique et le soleil. Selon ses propres indications, le groupe est l’acteur privé le plus important dans le domaine des sources d’énergies renouvelables. Fin 2018, la capacité installée s’établissait à 39.2 GW. D’ici 2021, elle devrait encore s’accroître de 9.2 GW. Dans le même temps, les Italiens aimeraient renforcer le bénéfice qui devrait atteindre les 5.6 milliards d’euros d’ici 2021. Ceci correspondrait à une croissance de 36.6% par rapport au niveau de l’année dernière. (Source : Enel, Investor Presentation, mai 2019)
Opportunités: outre les deux poids lourds, le STOXX™ Europe 600 Utilities Index comprend 26 autres entreprises. L’ETT (symbole : ETUTI) offre donc un investissement diversifié dans le secteur sans frais de gestion. Si ce produit vise des hausses de cours, avec le Callable Worst of Kick-In GOAL (symbole : KDTKDU), les investisseurs misent sur une évolution globalement stable. Avec Enel, EDF et l’Allemand RWE constituent les sous-jacents. Tant qu’aucune des trois actions n’atteindra ou ne passera en-dessous de la barrière de 55% des cours initiaux, l’investissement produira au bout de deux ans le rendement maximal de 8.50% p.a. Si l’émetteur applique la fonction Callable, les investisseurs récupéreront de manière anticipée le nominal ainsi que le coupon au pro rata.
Risques: les produits présentés ne bénéficient d’aucune protection du capital. Une évolution négative de l’actif sous-jacent entraîne des pertes correspondantes pour l’ETT. Si, pendant la durée de l’investissement, un des sous-jacents du Worst of Kick-In GOAL atteint une seule fois sa barrière respective (« Kick-In Level ») ou est inférieur à celle-ci, et que par ailleurs la fonction Callable ne s’applique pas, le montant remboursé en espèces à maturité par amortissement est basé sur la performance la plus faible (base Strike) du trio (au maximum toutefois à la valeur nominale majorée du coupon). En pareil cas, des pertes sont probables. De plus, avec des produits structurés, l’investisseur supporte le risque d’émetteur, si bien qu’en cas d’insolvabilité d’UBS SA, le capital investi peut être perdu, indépendamment de l’évolution du sous-jacent.
Vous trouverez davantage de produits UBS et des informations sur les opportunités et les risques à l’adresse ubs.com/keyinvest.
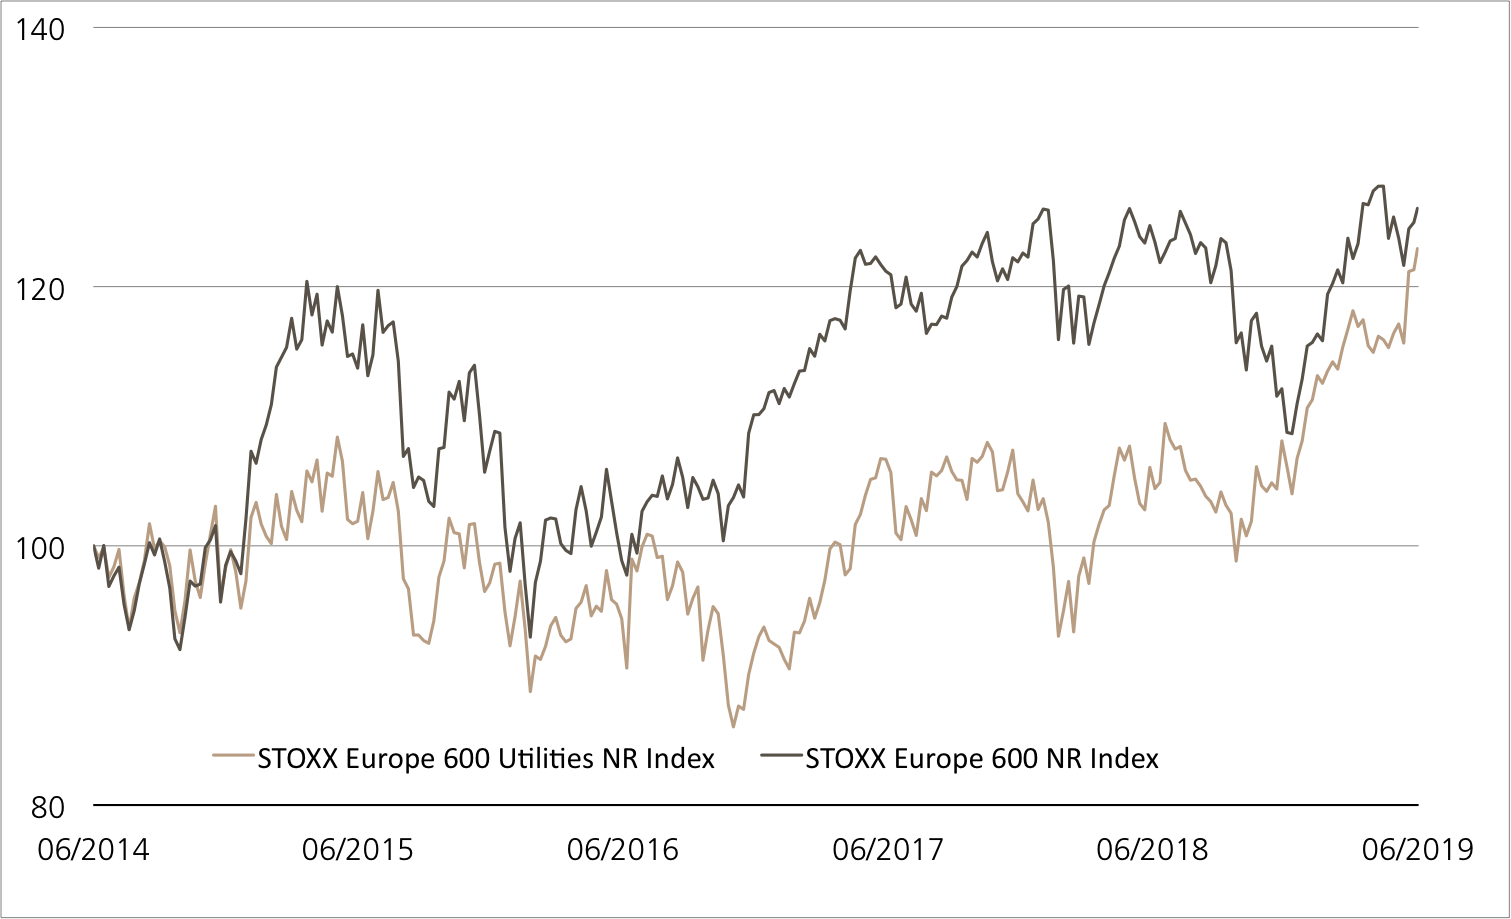
STOXX™ Europe 600 Utilities Index vs. STOXX™ Europe 600 Index (5 ans, aux fins d’illustration uniquement, données en %)¹
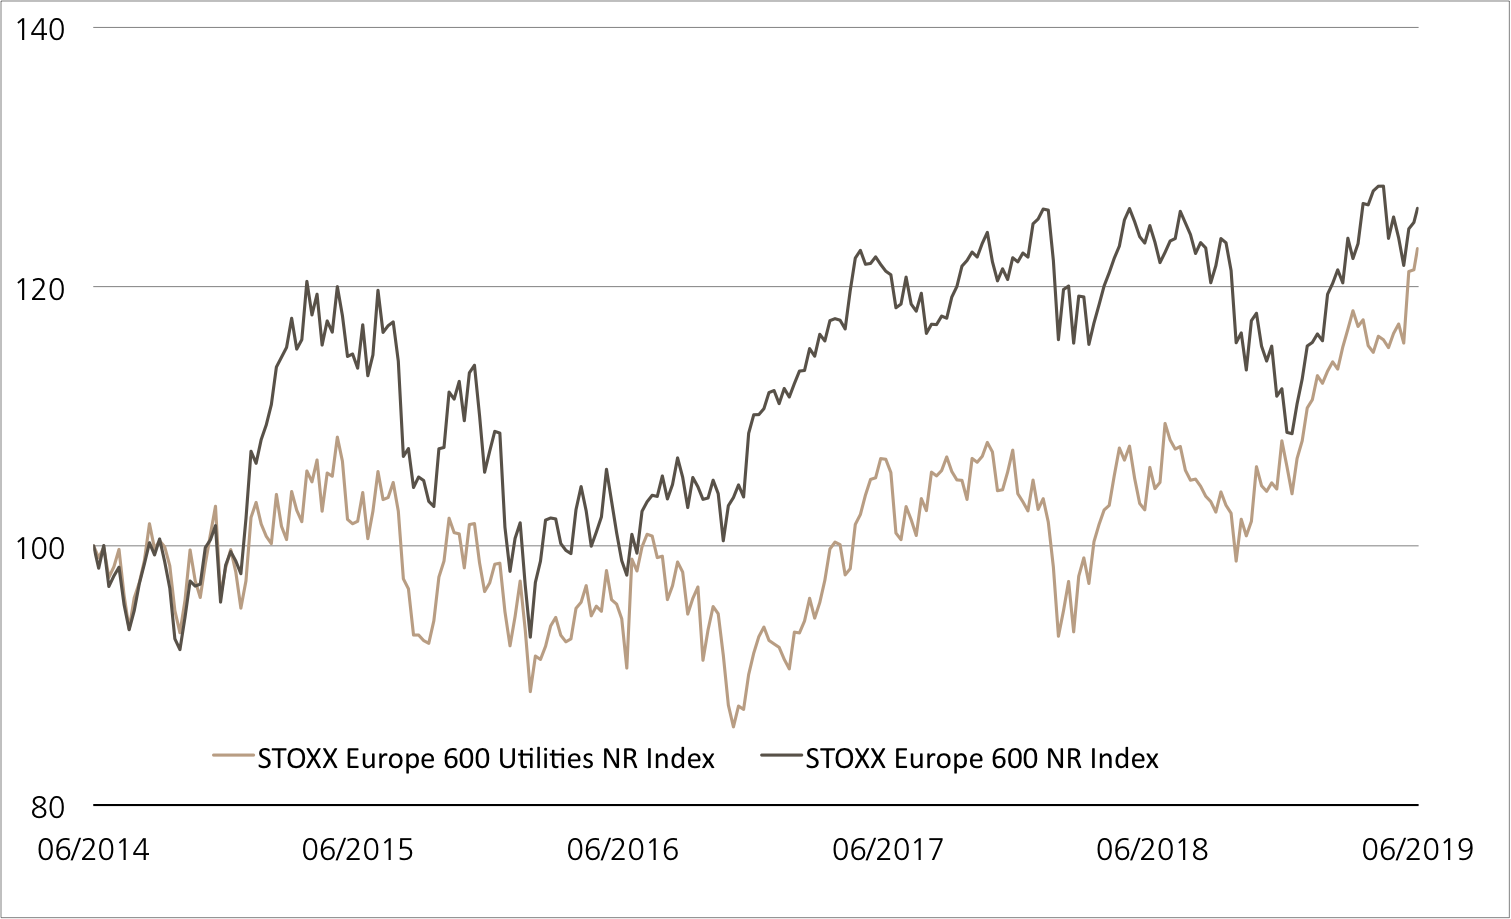
Au cours des cinq dernières années, le secteur des services d’intérêt public n’a pas tout à fait réussi à suivre le rythme du marché européen des actions en général. Toutefois le STOXX™ Europe 600 Utilities Index a récemment comblé son retard.
Source: UBS AG, Bloomberg
Valeurs du: 21.06.2019
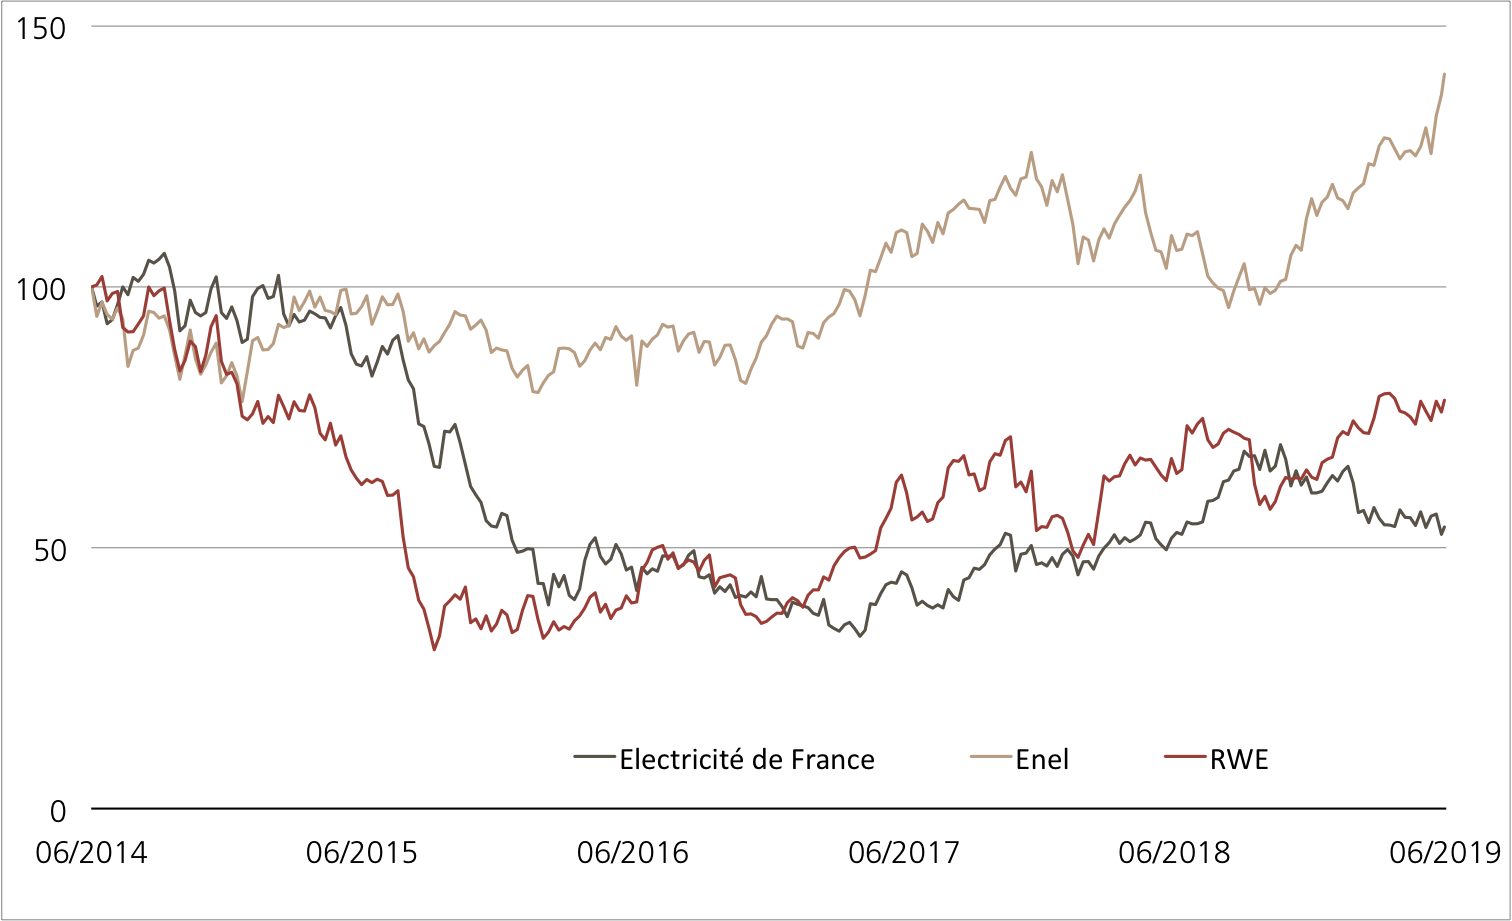
Electricité de France vs. Enel vs. RWE (5 ans, aux fins d’illustration uniquement, données en %)¹
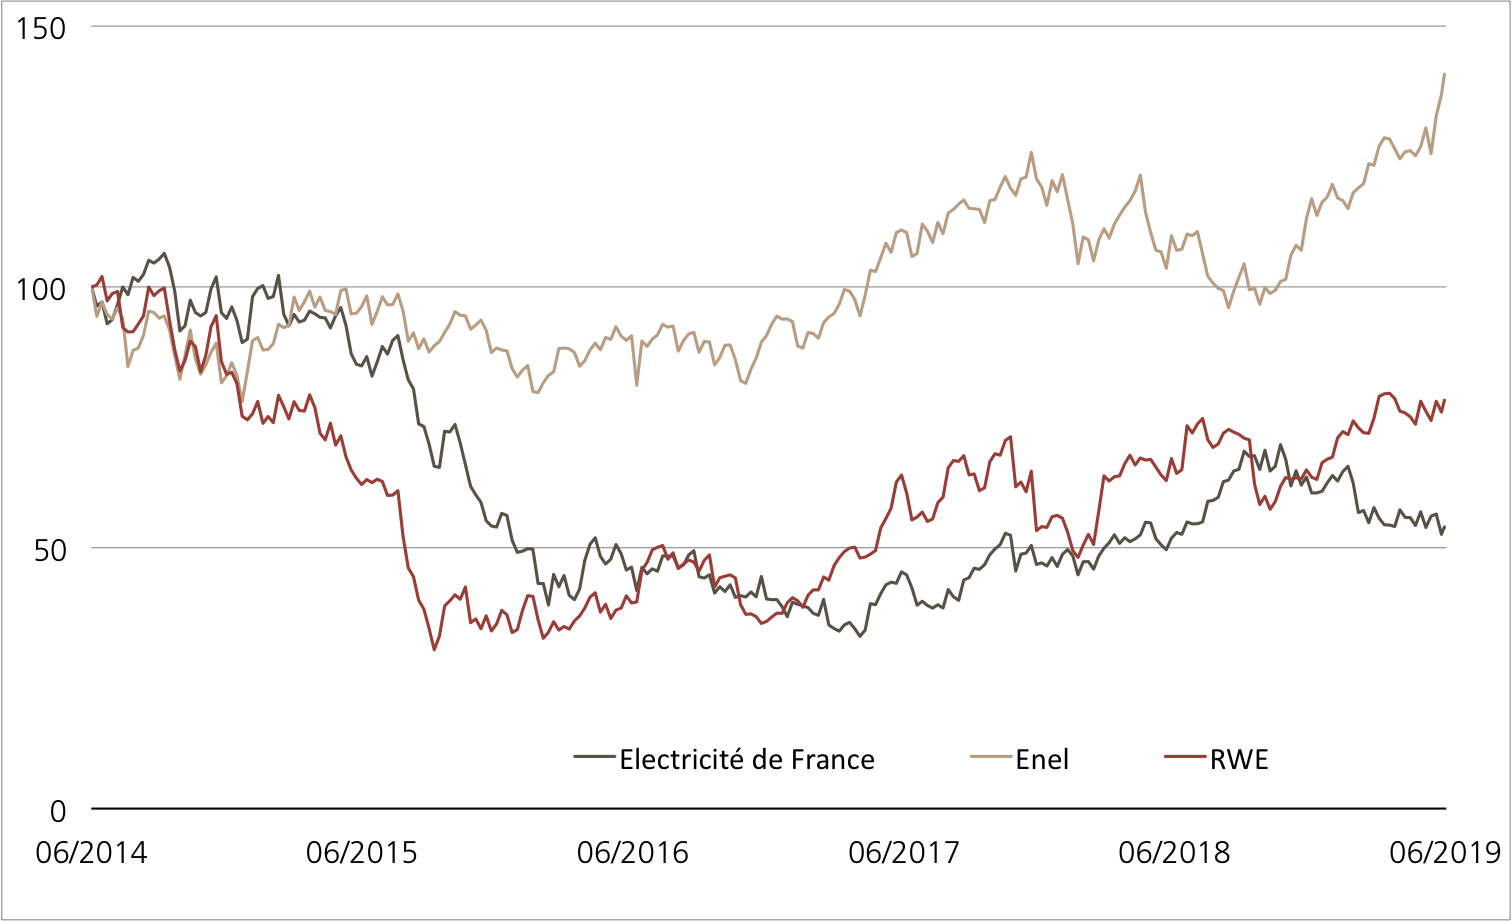
En comparaison sur 5 ans, Enel se distingue largement de ses deux concurrents européens. Toutefois, la tendance est à la hausse depuis un certain temps pour Electricité de France et RWE.
Source: UBS AG, Bloomberg
Valeurs du: 21.06.2019
¹) Nous attirons votre attention sur le fait que la performance passée n’est pas un indicateur de l’évolution de valeur future.
ETT sur STOXX™ Europe 600 Utilities EUR Net Return Index
| Symbol | ETUTI |
| SVSP Name | Tracker Certifikat |
| SVSP Code | 1300 |
| Sous-jacent | STOXX™ Europe 600 Utilities EUR Net Return Index |
| Conversion ratio | 1:1 |
| Devise | EUR |
| Frais de gestion | 0.00% p.a.² |
| Participation | 100% |
| Echéance | Open End |
| Émetteur | UBS AG, London |
| Bid/Ask | EUR 949.50 / 950.00 |
8.50% p.a. Callable Worst of Kick-In GOAL sur Eléctricité de France / Enel / RWE
| Symbol | KDTKDU |
| SVSP Name | Barrier Reverse Convertible |
| SVSP Code | 1230 (Callable) |
| Sous-jacent | Eléctricité de France / Enel / RWE |
| Coupon | 8.50% p.a. |
| Devise | EUR |
| Kick-in Level (barrière) | 55% |
| Echéance | 28.06.2021 |
| Émetteur | UBS AG, London |
| Date de fixation du prix | 26.06.2019, 15:00 h |
Vous trouverez davantage de produits UBS et des informations sur les opportunités et les risques à l’adresse ubs.com/keyinvest.
Source: UBS AG, Bloomberg
Valeurs du: 21.06.2019
Apérçu du marché
| Index | Citation | Semaine¹ |
| SMI™ | 9’961.65 Pt. | 1.0% |
| SLI™ | 1’524.15 Pt. | 1.0% |
| S&P 500™ | 2’926.46 Pt. | 1.6% |
| Euro STOXX 50™ | 3’454.70 Pt. | 2.0% |
| S&P™ BRIC 40 | 4’271.05 Pt. | 2.5% |
| CMCI™ Compos. | 890.22 Pt. | 1.1% |
| Gold (troy ounce) | 1348.80 USD | 0.9% |
¹ Changement basé sur le cours de clôture du jour précédent par rapport au cours de clôture de la semaine dernière.
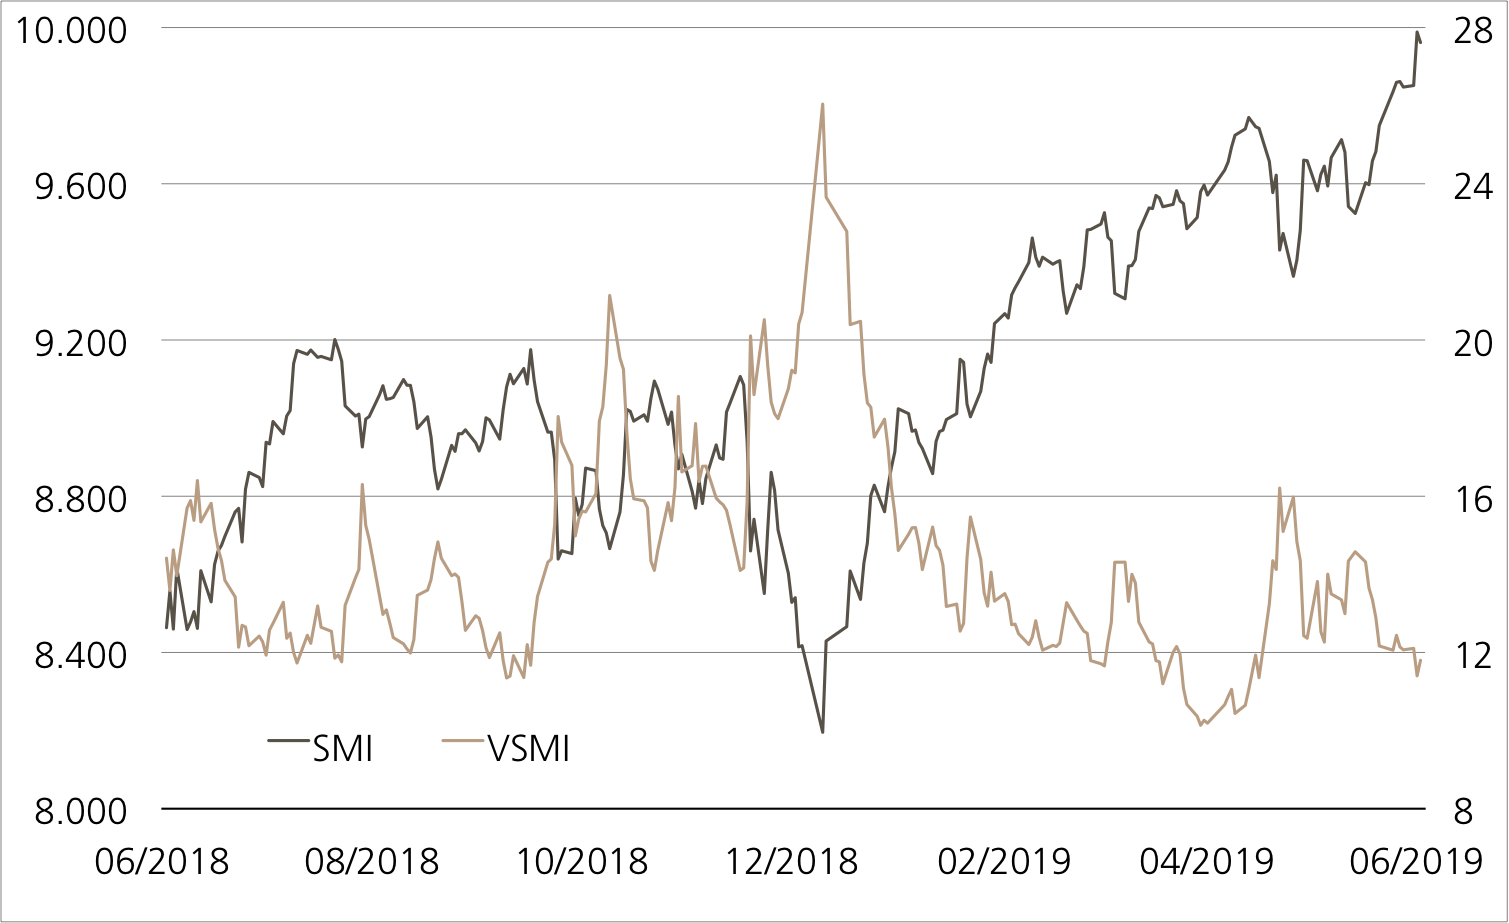
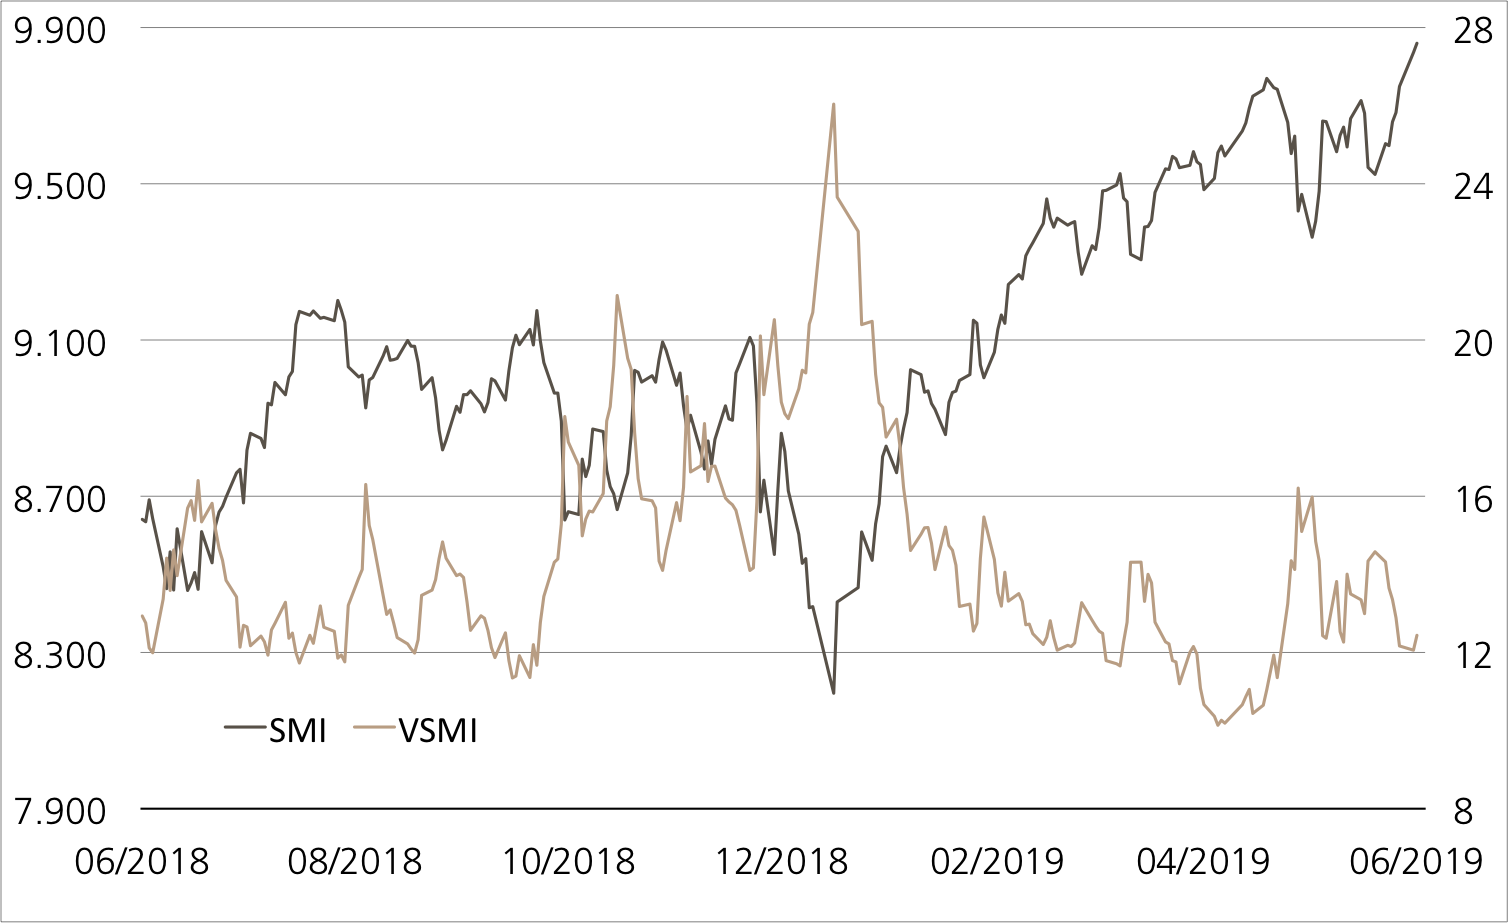
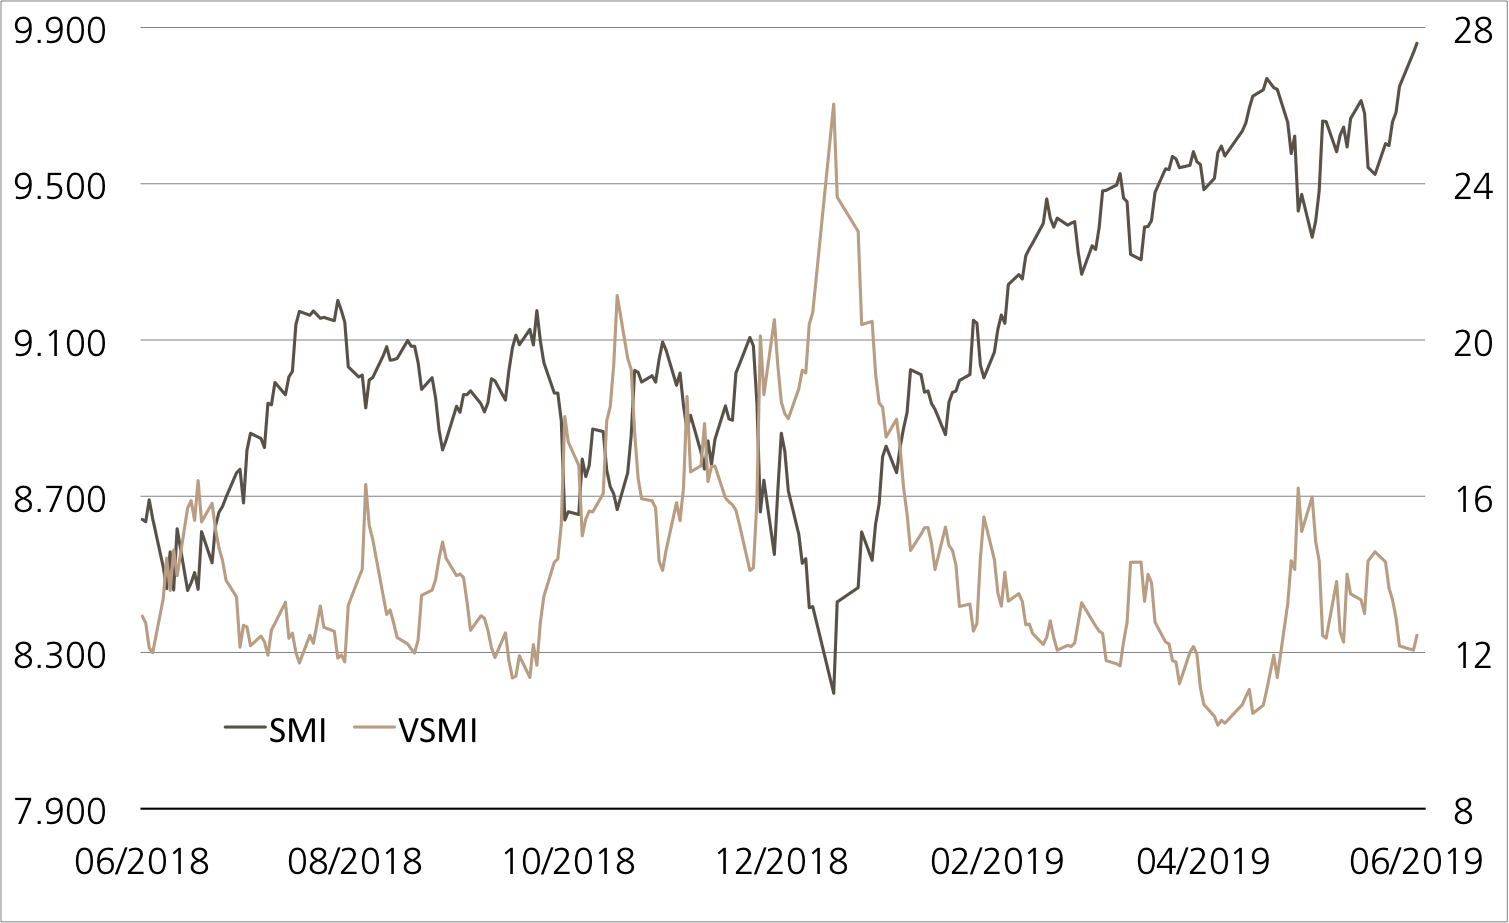
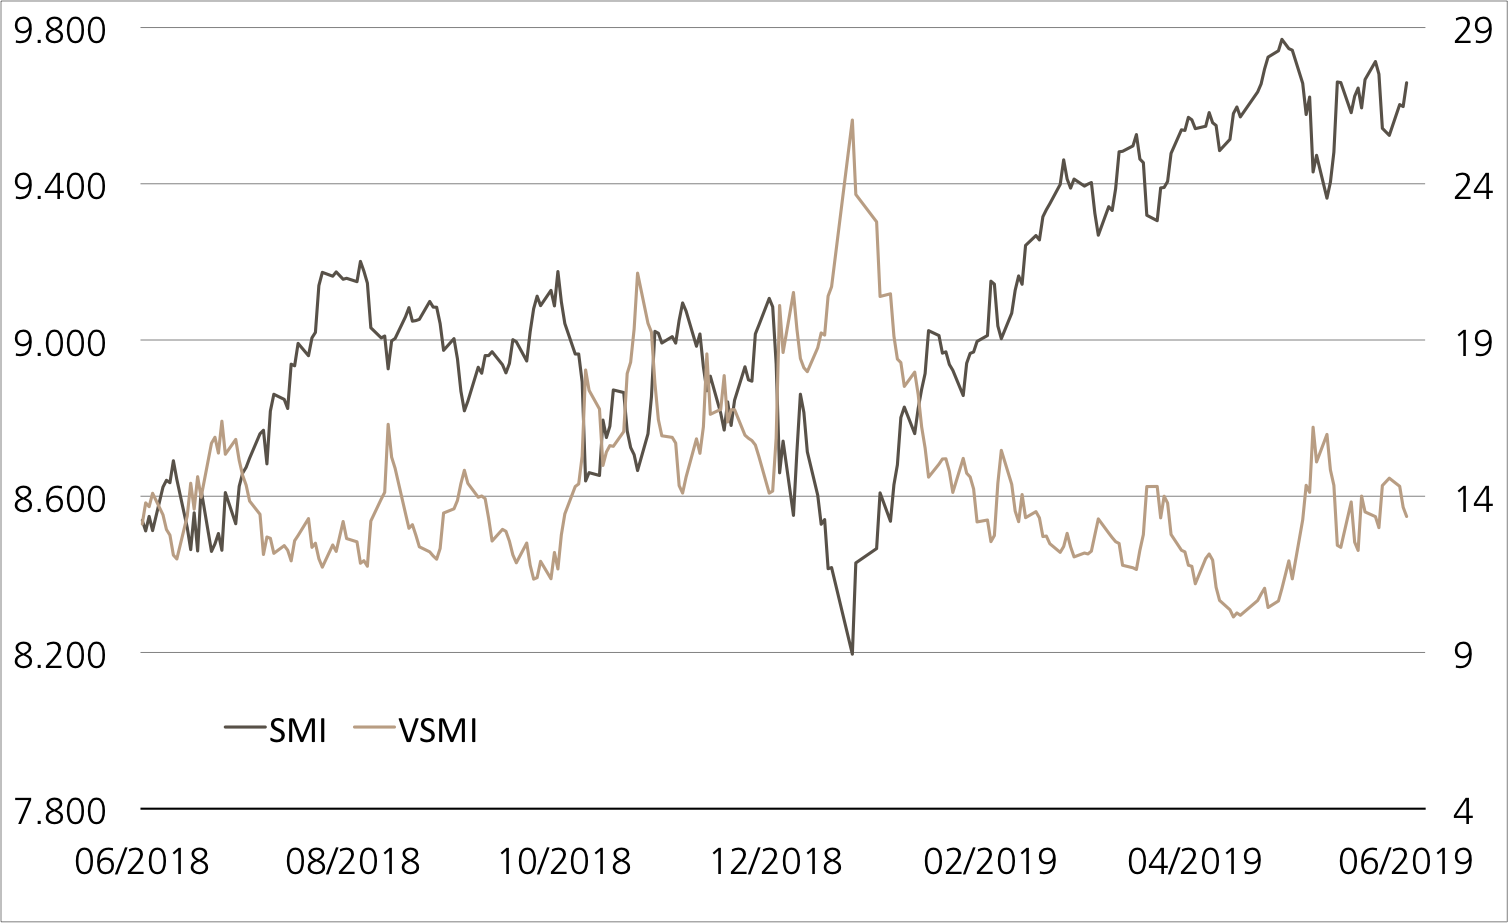
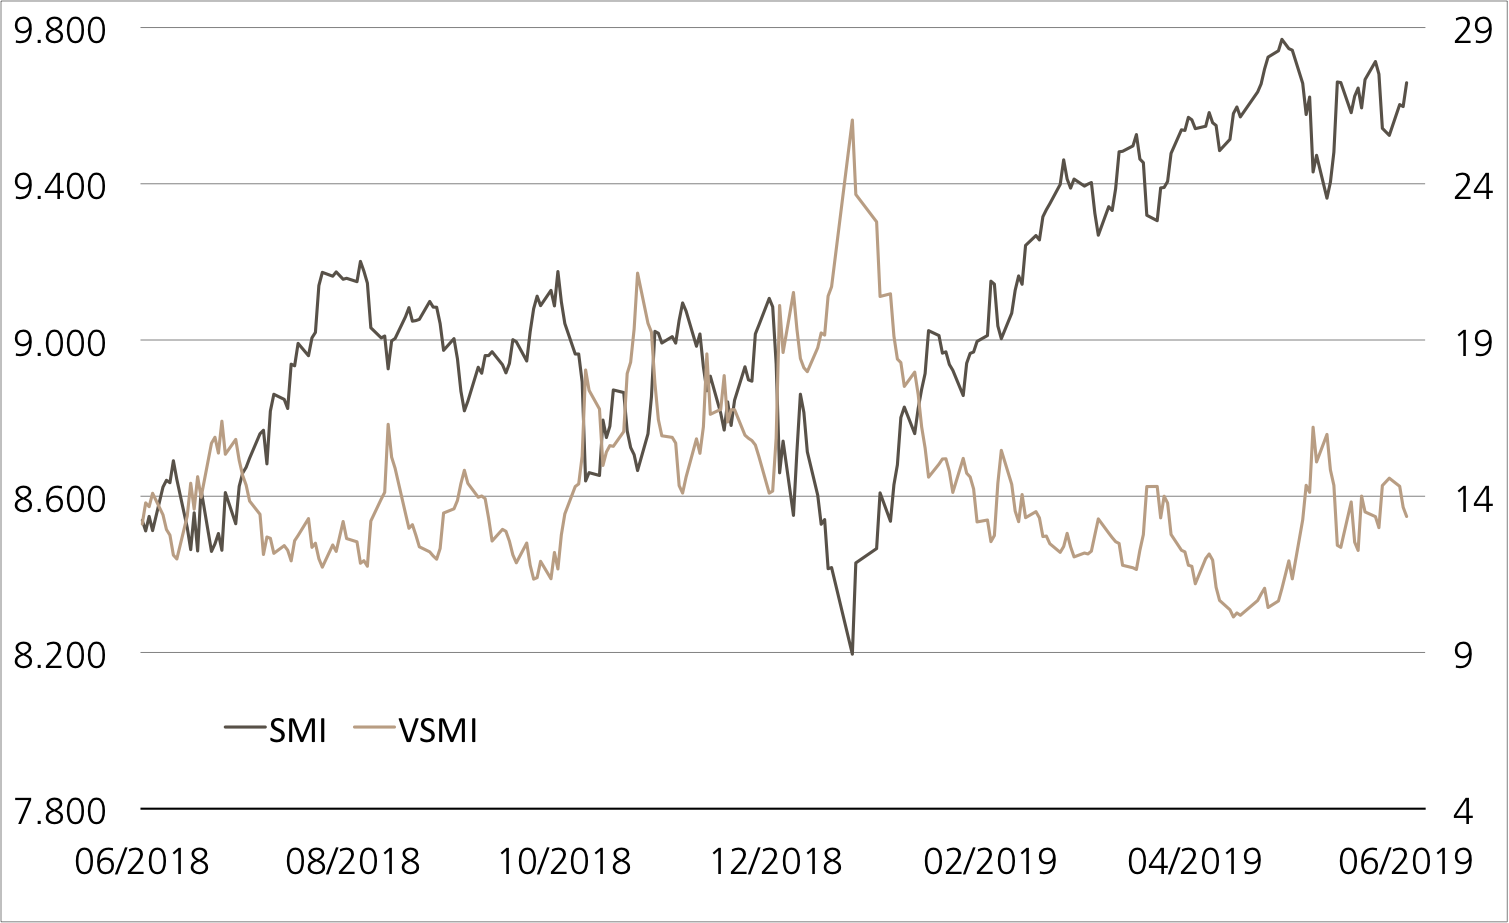
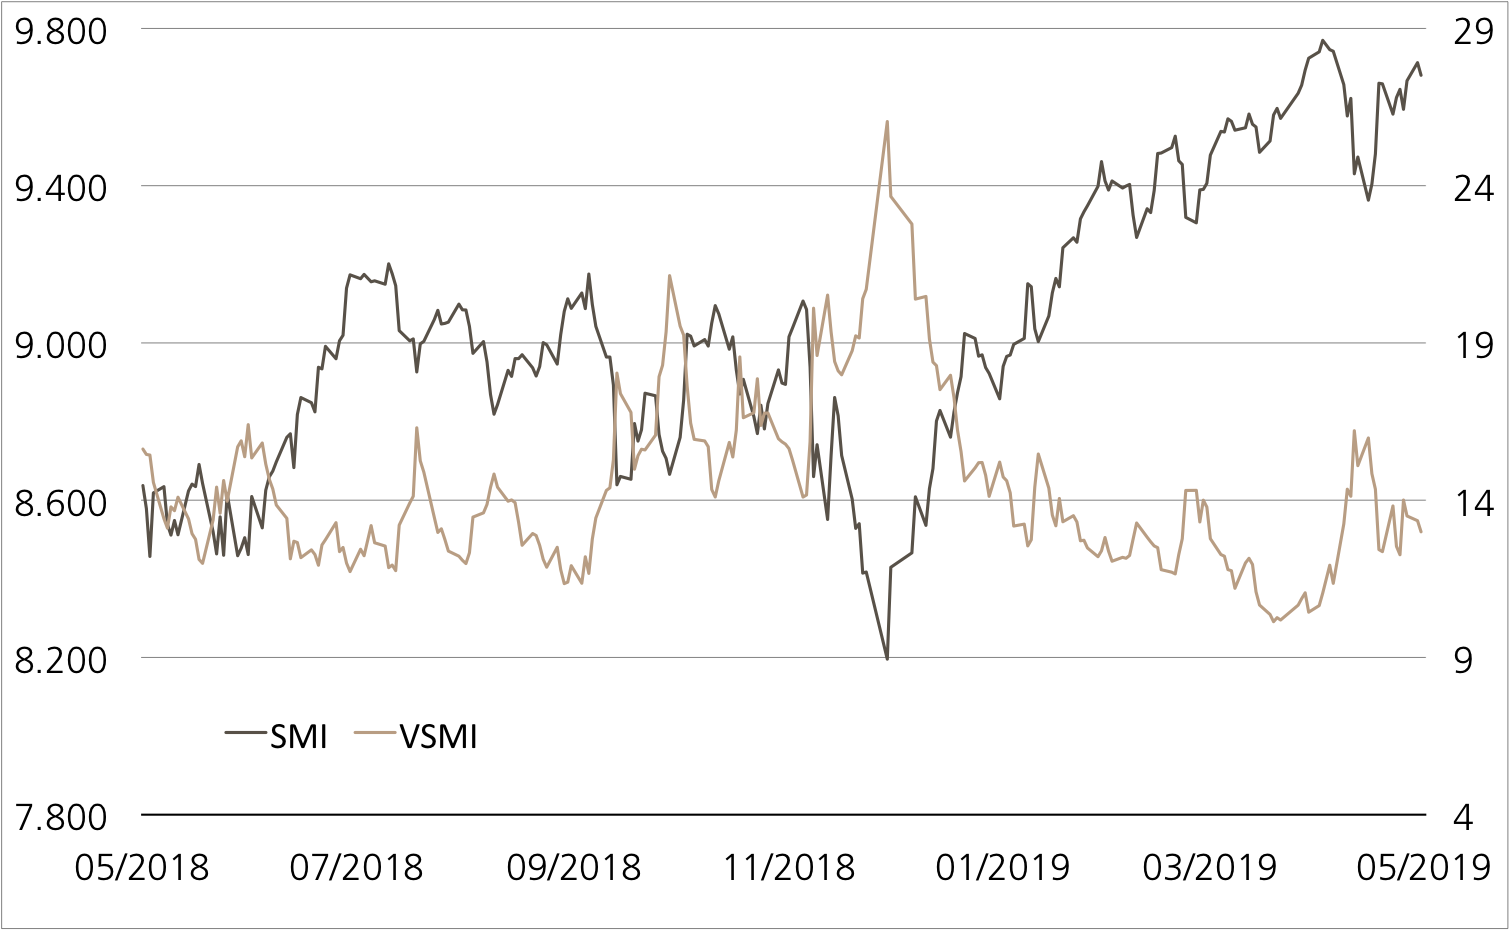
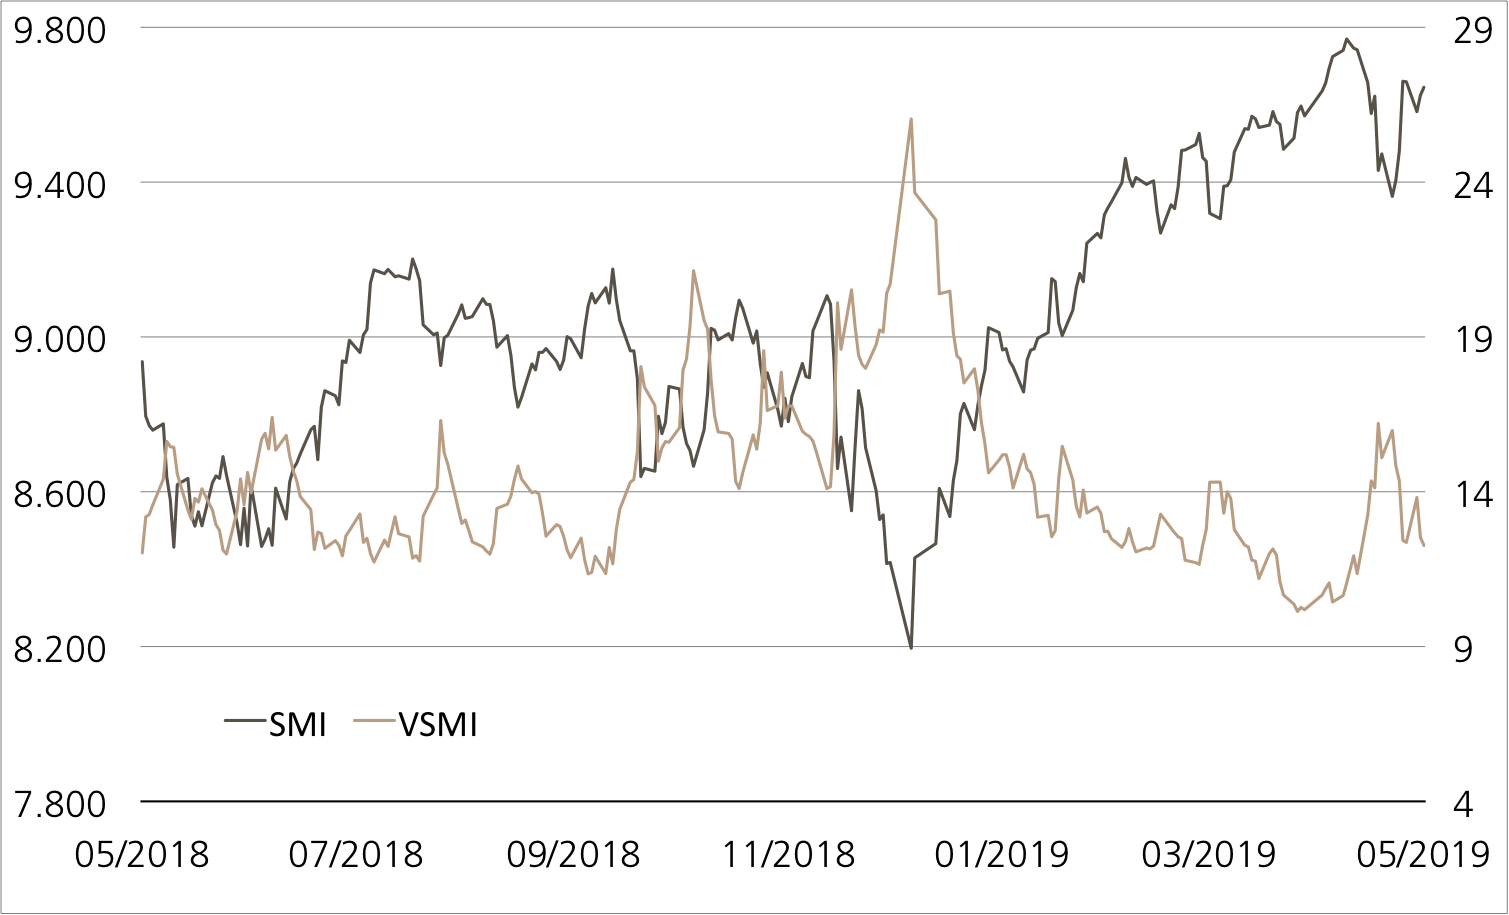
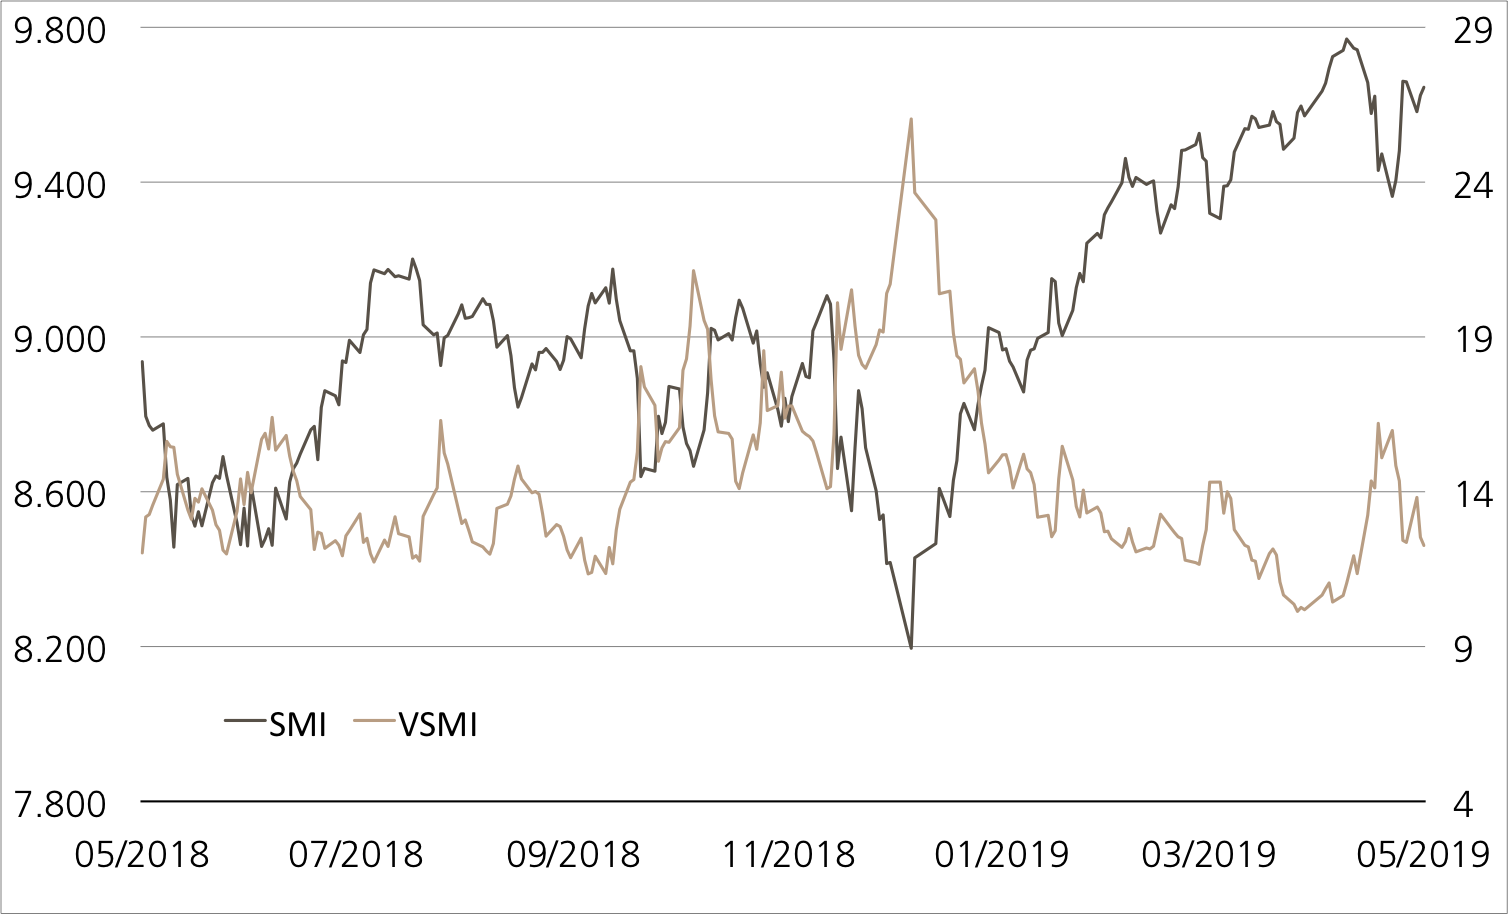
SMI™ vs. VSMI™ 1 année
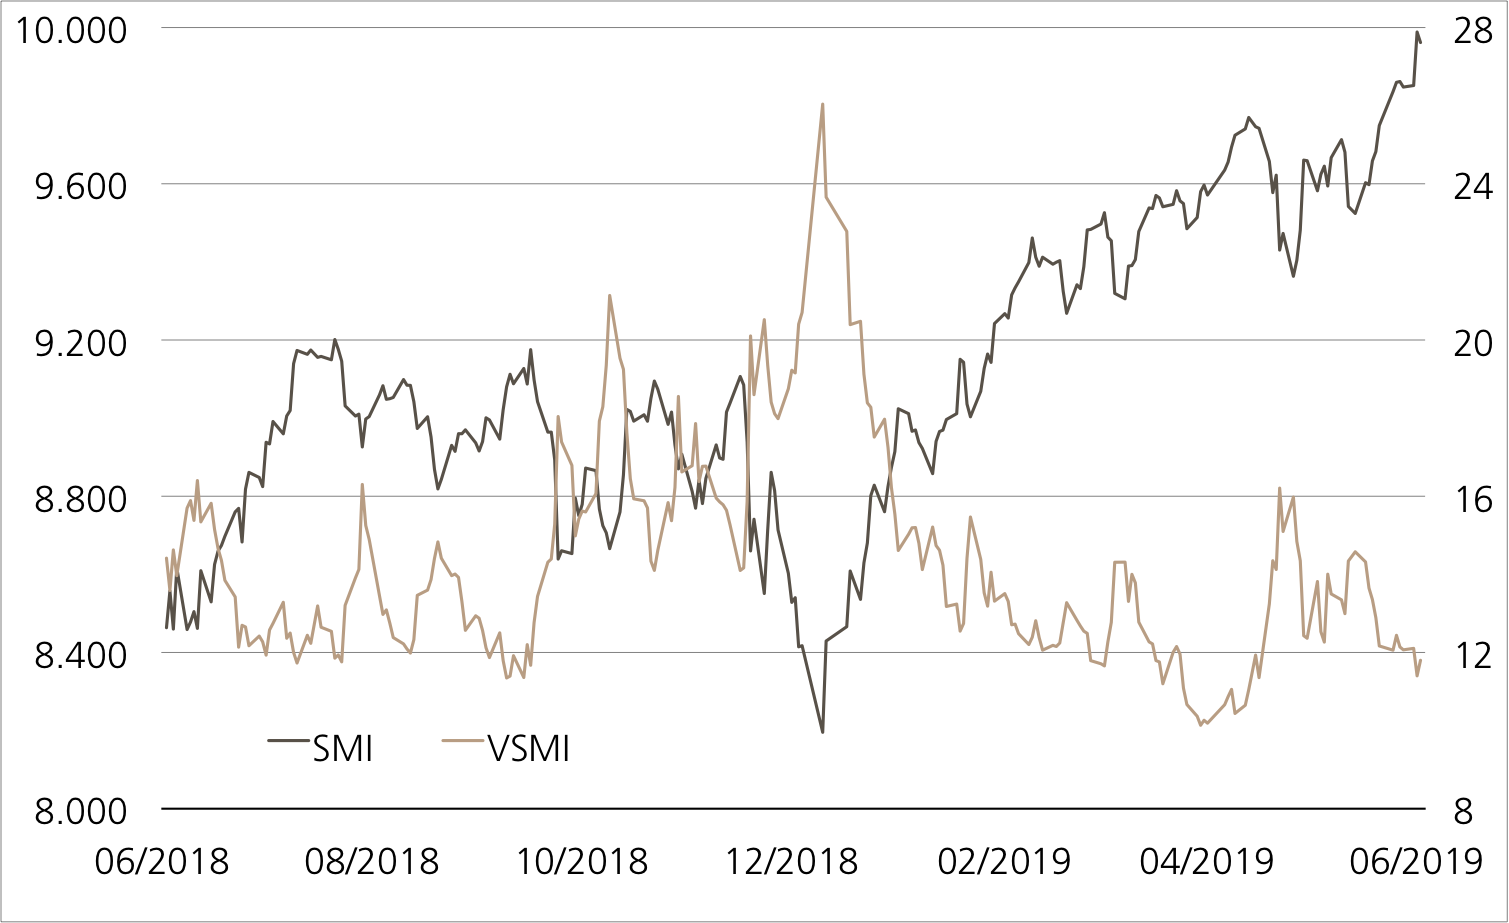
L’index VSMI™ est calculé depuis 2005. Il affiche la volatilité des actions inclus dans le SMI™ index. Pour la calculation, un portefeuille est utilisé qui ne réagit qu’au variations de la volatilité au lieu des variations des prix. En le faisant, la méthodologie du VSMI™ utilise la volatilité carré, connu sous le terme variance, des options sur le SMI avec 30 jours jusqu’à l’échéance négociées à la Bourse Eurex.
Source: UBS AG, Bloomberg
Valeurs du: 21.06.2019
Airbus / Boeing
Duel à Paris
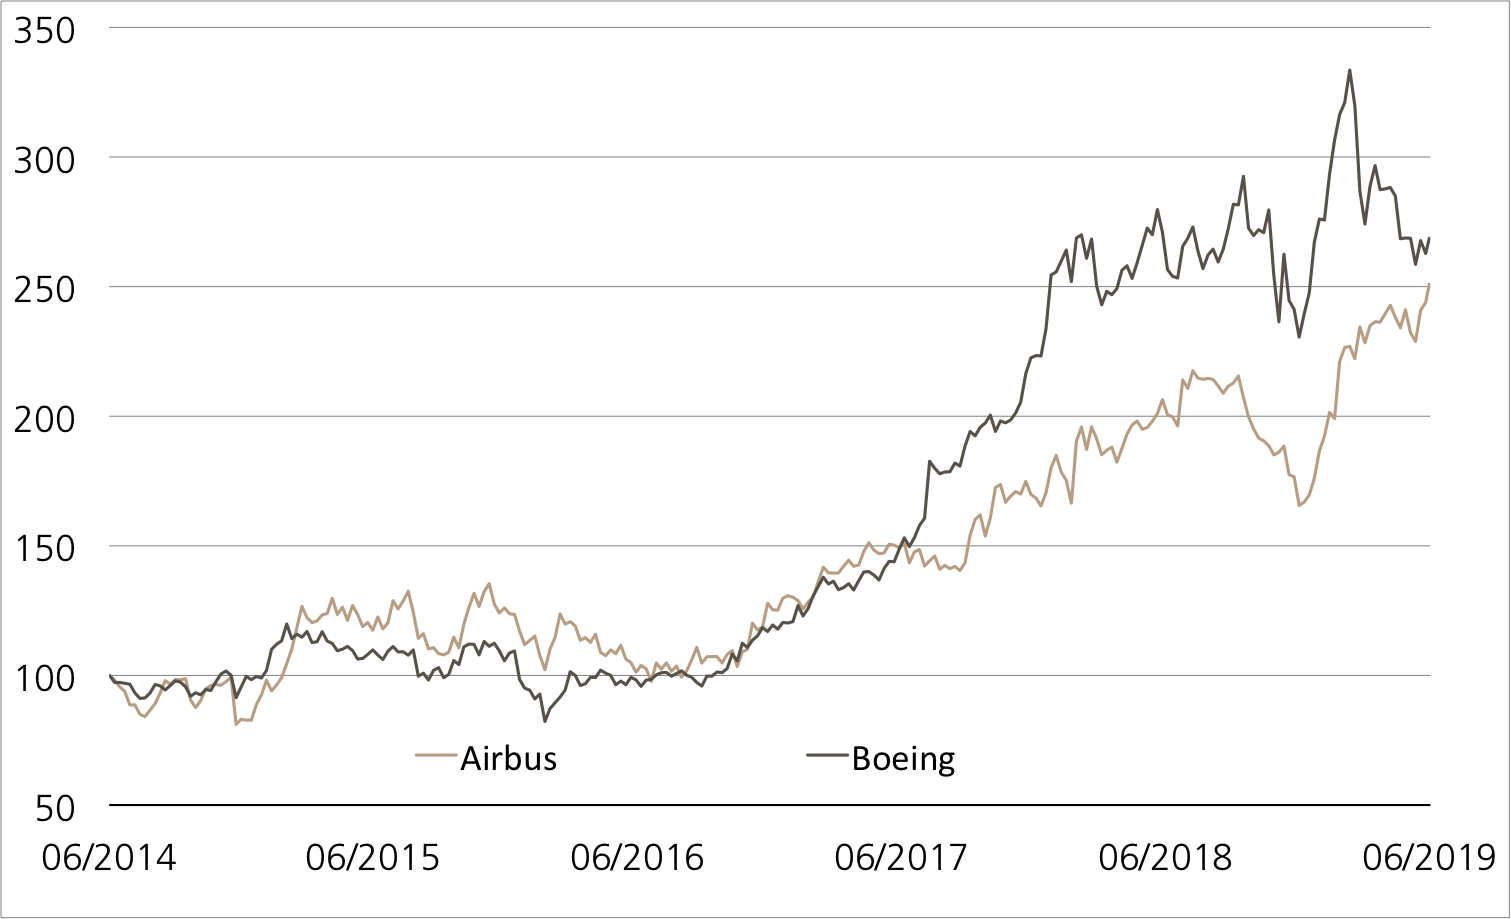
Pour la 53e fois déjà, le salon international de l’aéronautique et de l’espace de Paris a lieu cette semaine. Jusqu’au 23 juin, les visiteurs pourront admirer les dernières nouveautés de la technique aéronautique et spatiale. Ce salon qui est le plus grand de son genre présente une importance centrale pour Airbus et Boeing. Les deux constructeurs leaders recherchent traditionnellement de grosses commandes au Bourget. Ensemble, le duo est représenté dans le Callable Worst of Kick-In GOAL (symbole : KCYPDU). Le produit émis en début d’année présente un rendement latéral de 7.70% p.a. Même pour le Boeing, le moins performant, l’écart de la barrière est de 41.7%.
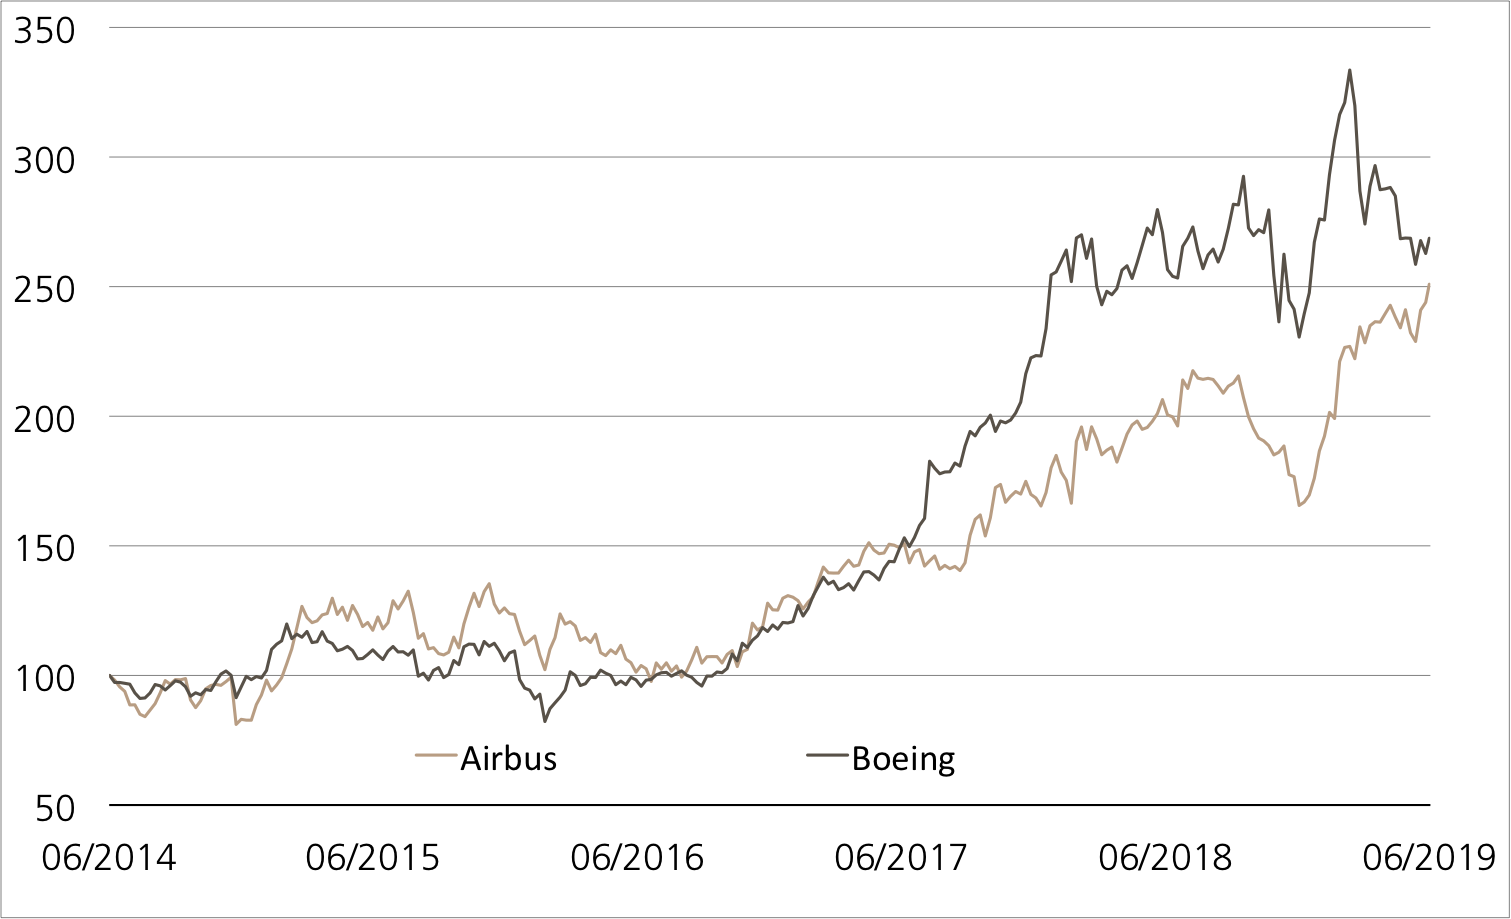
Le fait que Boeing n’ait pas réussi, récemment, à suivre son rival européen de toujours a une raison très claire. Après deux crashs catastrophiques, le 737 MAX, un bestseller du groupe américain, reste cloué au sol depuis mars 2019. Malgré tout, Boeing a remporté d’importantes commandes à Paris. Par exemple, Korean Air a commandé 20 appareils Boeing 787. Au prix catalogue, le volume de la commande s’élève à 6.3 milliards de dollars US.
Les affaires ont particulièrement bien marché pour Airbus au début du célèbre salon. L’Européen s’est notamment assuré d’une commande de six milliards de dollars US passée par Cebu Air. La société des Philippines a commandé au total 36 appareils dont 10 A321XLR. Airbus avait présenté ces longs courriers modernes pour la première fois à Paris. L’Arabie Saoudite a acheté au groupe aéronautique et aérospatiale 30 autres A320neo d’une valeur de 3.3 milliards de dollars au prix catalogue. (Source : Thomson Reuters, article de presse, 18.06.2019). Dans ce contexte, il n’est pas étonnant que l’action Airbus ait battu le 18 juin, deuxième jour du salon, un record absolu.¹
Opportunités: une vitesse de croisière stables des deux actions aéronautiques et aérospatiales serait suffisante pour que le Callable Kick-In GOAL (symbole : KCYPDU) exploite tout son potentiel, et produise le rendement maximal d’actuellement 7.70% p.a. Le fait que ni Airbus ni Boeing n’atteigne la barrière ni ne soit inférieur à celle-ci pendant la durée est déterminant. Si actuellement, 57% séparent le sous-jacent européen de la barrière, son rival américain dispose d’une marge de sécurité de tout de même 41.9%. Nous attirons votre attention sur le fait que l’émetteur a le droit de résilier et de rembourser le Kick-In GOAL de manière anticipée. À partir du 9 janvier 2020, l’émetteur peut appliquer la fonction Callable tous les trois mois.
Risques: il n’existe aucune protection du capital pour le produit présenté. Si, pendant la durée de l’investissement, l’un des sous-jacents atteint une seule fois la barrière respective (« Kick-In Level ») ou est inférieur à celle-ci, et que la fonction de Callable ne s’applique pas, l’amortissement à l’échéance par remboursement en espèces est basé sur la performance la plus faible (base Strike) du duo (au maximum toutefois à la valeur nominale majorée du coupon). En pareil cas, des pertes sont probables. De plus, avec des produits structurés, l’investisseur supporte le risque d’émetteur, si bien qu’en cas d’insolvabilité d’UBS SA, le capital investi peut être perdu, indépendamment de l’évolution des sous-jacents.
Vous trouverez davantage de produits UBS et des informations sur les opportunités et les risques à l’adresse ubs.com/keyinvest.
Airbus vs. Boeing
(5 ans, uniquement aux fins d’illustration, indications en %)¹
Source: UBS AG, Bloomberg
Valeurs du: 21.06.2019
10.00% p.a. Callable Worst of Kick-In GOAL sur Airbus / Boeing
| Symbol | KCYPDU |
| SVSP Name | Barrier Reverse Convertible |
| SPVSP Code | 1230 (Callable) |
| Sous-jacent | Airbus / Boeing |
| Devise | CHF |
| Coupon | 10.00% p.a. |
| Kick-In Level (Barrière) | Airbus: EUR 53.808 (56.25%) Boeing: USD 206.298 (44.03%) |
| Rendement latéraux | 12.21% / 7.54% p.a. |
| Echéance | 11.01.2021 |
| Émetteur | UBS AG, London |
| Bid/ask | 101.94% / 102.94% |
Vous trouverez davantage de produits UBS et des informations sur les opportunités et les risques à l’adresse ubs.com/keyinvest.
Source: UBS AG, Bloomberg
Valeurs du: 21.06.2019
¹) La performance passée n’indique pas les résultats futures.

