Weekly-Hits Ausgabe vom 22.11.2018


KeyInvest Weekly Hits
Donnerstag, 22.11.2018
  • Thema 1: Konsum – Die ganze Welt im Kaufrausch
  • Thema 2: Continental & Michelin – Mehr als nur schwarze Pneus

Konsum
Die ganze Welt im Kaufrausch

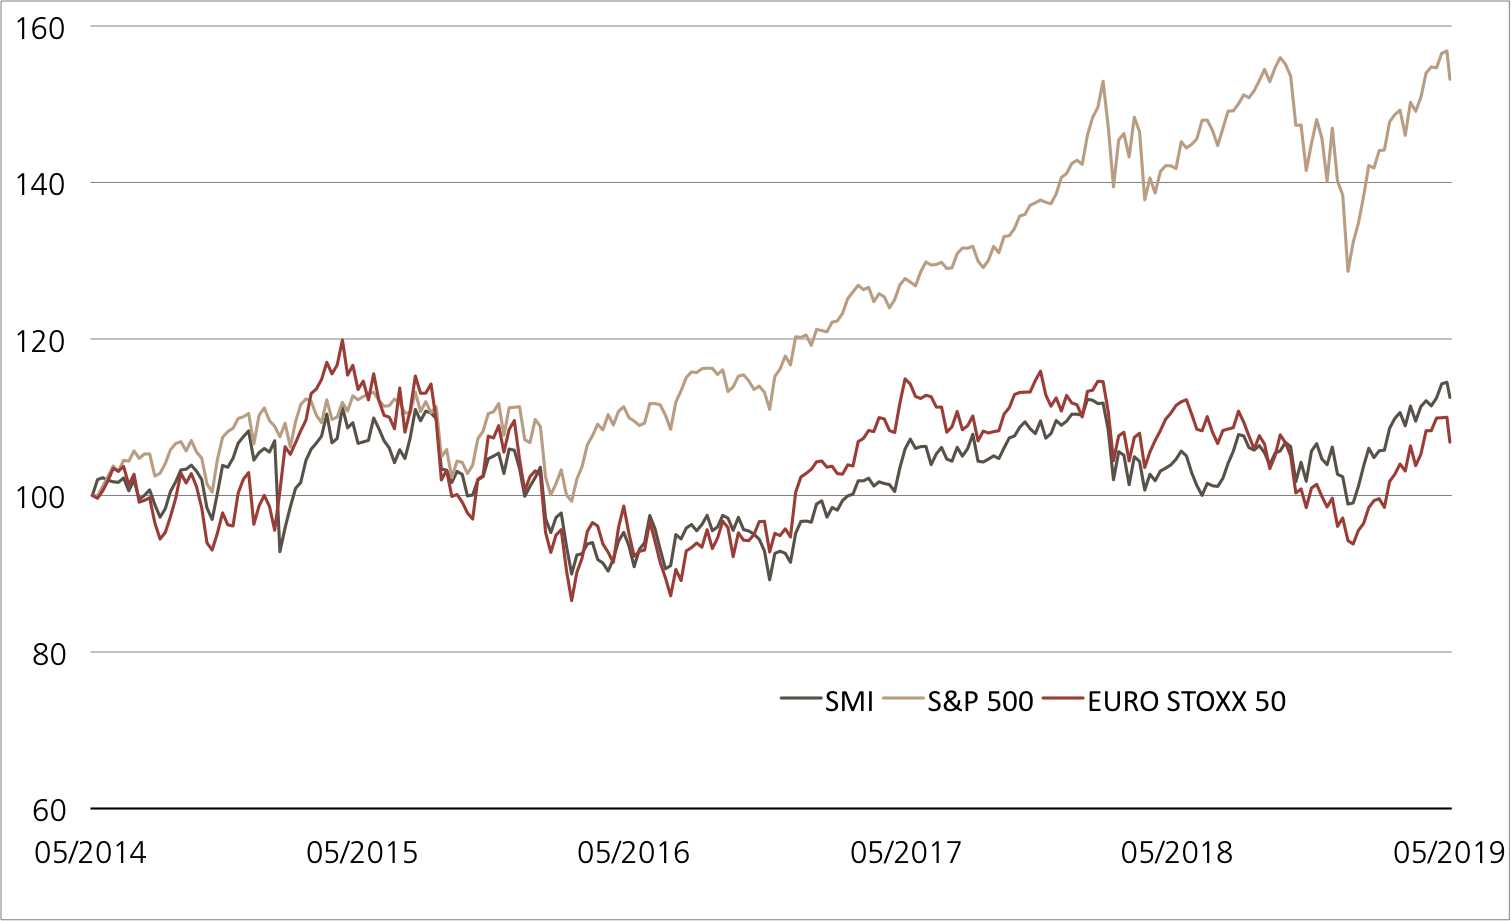
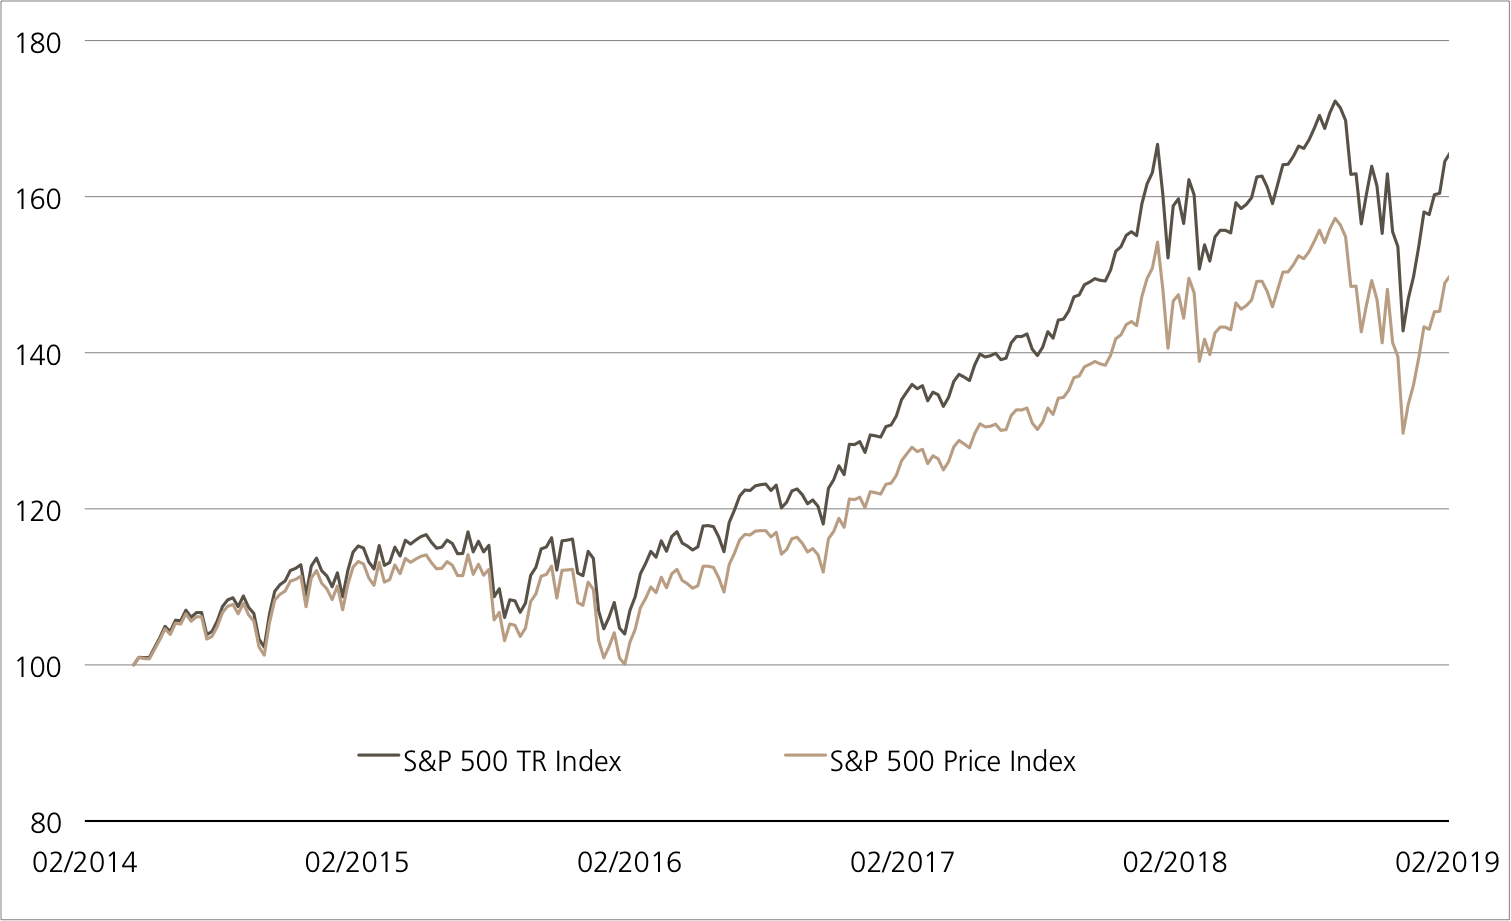
Traditionell beginnt in den USA an Thanksgiving das grösste Shopping-Event des Jahres. Aber nicht nur am «Black Friday» werden die Konsumenten wieder Milliarden an Dollars ausgeben, drei Tage später folgt mit dem «Cyber Monday» dann der grosse Tag der E-Commerce-Branche. Besonders gewinnbringend könnte das Geschäft für Amazon sein, das Unternehmen startete bereits am 19. November offiziell mit täglich wechselnden Schnäppchen in die «Cyberwoche». Chinesische Internetkonzerne wie Alibaba sind den Amerikanern mit dem «Singles› Day» am 11.11. im Reich der Mitte nicht nur zeitlich, sondern auch mit Blick auf das Volumen voraus. Das Online-Potenzial haben mittlerweile auch Kaufhäuser wie Walmart und Target erkannt, die ihre Produkte ebenfalls im Netz anbieten. Mit den in Zeichnung stehenden Kick-In GOALs auf Alibaba, Amazon, eBay (Symbol: KCWUDU) sowie Target, Walmart, Macy’s (Symbol: KCWLDU) können Anleger teilgeschützt in die internationalen Handels-riesen investieren. Die Produkte bieten neben hohen Risikopuffern von bis zu 50 Prozent auch prozentual zweistellige Renditechancen.

Die jüngste Rabattschlacht in China war ein voller Erfolg. Am weltgrössten Shopping-Event, dem Singles› Day, ging es kräftig zur Sache. Allein der Lokalmatador Alibaba konnte bei dem 24-stündigen Einkaufsfest Waren im Wert von umgerechnet 30.7 Milliarden US-Dollar absetzen, das waren 27 Prozent mehr als noch im Vorjahr. Allein in den ersten zwei Minuten erlöste der chinesische Amazon-Rivale laut der Nachrichtenagentur Xinhua knapp 1.5 Milliarden US-Dollar. Möglicherweise ein guter Indikator für den anstehenden Kaufmarathon in den USA. Vergleichbar hohe Umsätze sind allerdings nicht zu erwarten. Im vergangenen Jahr wurden am Black Friday nach Angaben von Adobe Digital Insights Waren im Wert von 5 Milliarden US-Dollar verkauft, am Cyber Monday kamen dann noch einmal6.6 Milliarden US-Dollar hinzu. Auch wenn die Shoppingtage in den USA etwas kleiner als in China ausfallen, für die Unternehmen ist das eine wichtige Zeit. So hat Amazon am Cyber Monday 2017 einen derart hohen Umsatz erzielt wie an keinem anderen Tag in dem Jahr.
 
Wie dominant Amazon ist, zeigen Zahlen von eMarketer. Der Marktforscher hat errechnet, dass 49.1 Prozent aller Online-Einzelhandelsausgaben des Landes respektive 5 Prozent aller Einzelhandelsumsätze auf den E-Commerce-Riesen entfallen. Auf Platz zwei steht eBay weit abgeschlagen mit einem Anteil von 6.6 Prozent. Aber auch stationäre Kaufhäuser sind unter den Top Ten zu finden. Auf Rang vier steht Walmart mit einem Anteil am US-E-Commerce-Kuchen von 3.7 Prozent, auf Platz acht Macy’s mit 1.2 Prozent. (Quelle: eMarketer, Juli 2018) Beim weltgrössten Einzelhändler Walmart läuft es auch jenseits des Black Friday gut. Im dritten Quartal legte der Konzernumsatz um 1.4 Prozent im Vergleich zum Vorjahr zu. Für das laufende Geschäftsjahr 2018/19 (31.01.) hob das Unternehmen den Ausblick für das bereinigte Ergebnis je Aktie auf 4.75 bis 4.85 US-Dollar (bisher 4.65 bis 4.80 US-Dollar) an. Auch die Prognose für das organische Wachstum des US-Geschäfts wurde von «rund» auf «mindestens» drei Prozent erhöht.


Chancen:
Zwei neue Kick-In GOALs geben Anlegern die Möglichkeit, sich aussichtsreich im Einzelhandelssektor zu positionieren. Der Kick-In GOAL auf Alibaba, Amazon, eBay (Symbol: KCWUDU) stellt einen Coupon von 11.00 Prozent p.a. in Aussicht. Der maximale Ertrag wird erzielt, sollte keiner der Basiswerte in den kommenden zwölf Monaten seine Barriere von 54 Prozent der Startwerte verletzen. Der ER Kick-In GOAL (Symbol: KCWLDU) auf Target, Walmart und Macy’s weist sogar noch attraktivere Konditionen auf: Der Risikopuffer beträgt stolze 50 Prozent, der Coupon 12.00 Prozent p.a. Aufgrund der Early-Redemption-Funktion kann sich die maximale Laufzeit auf zwölf Monate verkürzen.

Risiken:
Kick-In GOALs sind nicht kapitalgeschützt. Notiert einer der Basiswerte während der Laufzeit einmal auf oder unter dem jeweiligen Kick-In Level (Barriere) und kommt zudem des Early Redemption Feature nicht zum tragen, kann die Rückzahlung am Verfalltag durch Bartilgung entsprechend der (vom Strike aus) schwächsten Performance aus dem Trio erfolgen (höchstens jedoch zum Nominalwert zuzüglich Coupon). In diesem Fall sind Verluste wahrscheinlich. Zudem trägt der Anleger bei strukturierten Produkten das Emittentenrisiko, so dass das eingesetzte Kapital – unabhängig von der Entwicklung des Basiswertes – im Falle einer Insolvenz der UBS AG verloren gehen kann.

Weitere UBS Produkte sowie Informationen zu Chancen und Risiken finden Sie unter ubs.com/keyinvest.
 
 
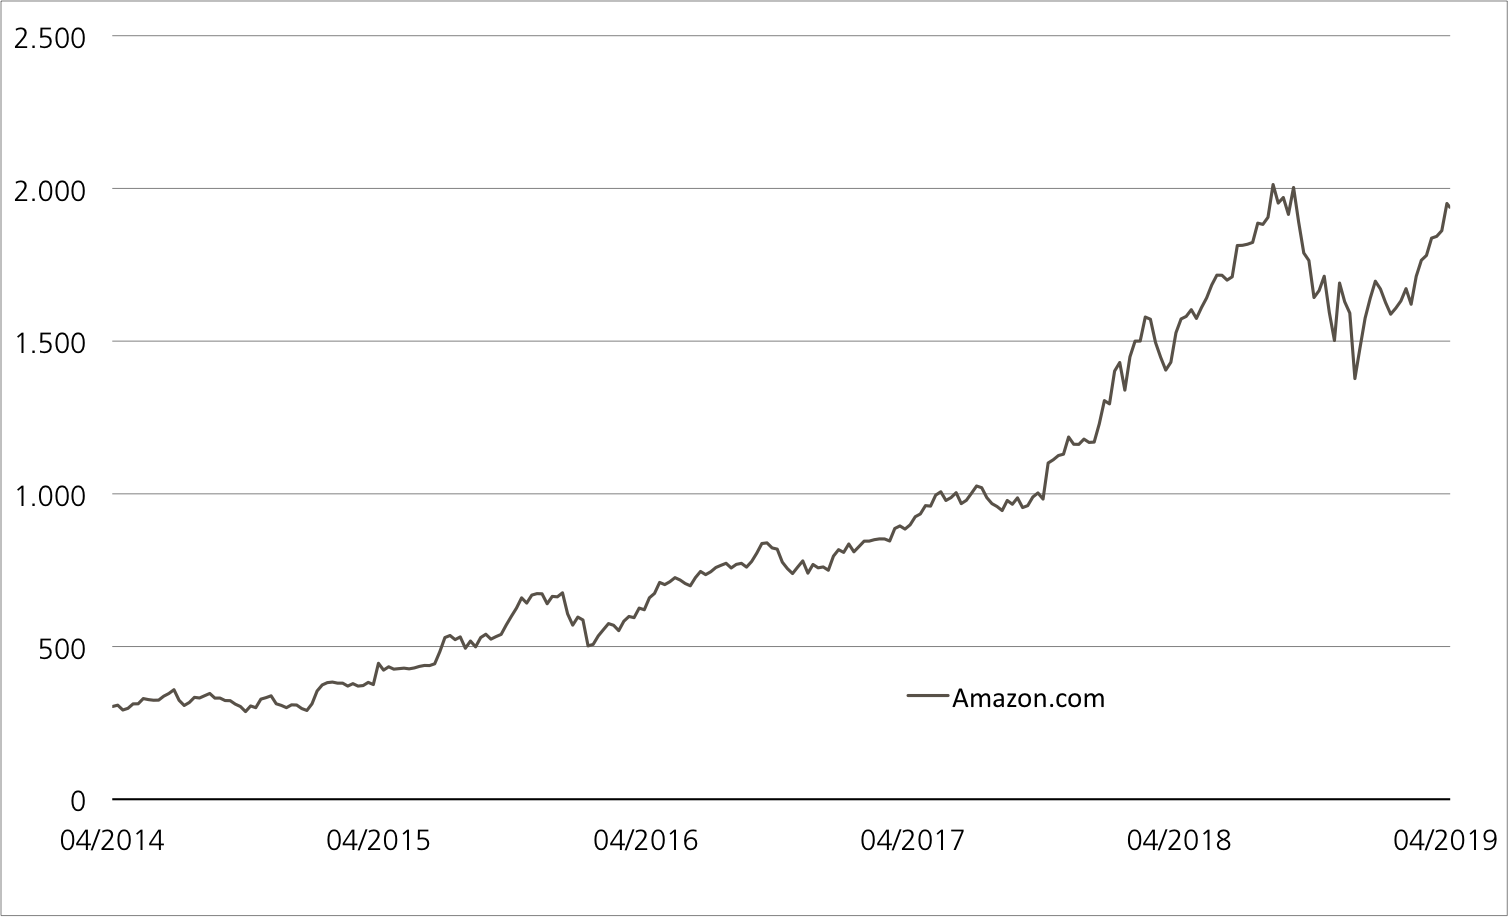
Alibaba vs. Amazon vs. eBay (seit dem Alibaba-IPO am 19.09.2014)¹
Auf und davon machte sich die Amazon-Aktie in den vergangenen Jahren im Vergleich zu den Konkurrenten Alibaba und eBay. Dieses Jahr knackte der E-Commerce-Riese beim Börsenwert sogar die 1-Billion-Dollar-Marke.
 
Quelle: UBS AG, Bloomberg
Stand: 21.11.2018

Target vs. Walmart vs. Macy’s (5 Jahre)¹
Während die Aktien von Target und Walmart den ausgewählten Fünf-Jahres-Zeitraum mit einem Plus abschliessen konnte, musste die Aktie von Mary’s Federn lassen. Diese verlor unter dem Strich 35 Prozent.
 
Quelle: UBS AG, Bloomberg
Stand: 21.11.2018

 
¹) Bitte beachten Sie, dass vergangene Wertentwicklungen keine Indikationen für künftige Wertentwicklungen sind.
 
11.00% p.a. Kick-In GOAL auf Alibaba, Amazon, eBay 

Symbol KCWUDU
SVSP Name Barrier Reverse Convertible
SPVSP Code 1230
Basiswerte Alibaba, Amazon, eBay
Handelswährung USD
Coupon 11.00% p.a.
Kick-In Level (Barriere)
54%
Verfall 05.12.2019
Emittentin UBS AG, London
Zeichnung bis 05.12.2018, 15:00 Uhr
 

12.00% p.a. ER Kick-In GOAL auf Target, Walmart, Macy’s

Symbol KCWLDU
SVSP Name Barrier Reverse Convertible
SPVSP Code 1230 (Auto-Callable)
Basiswerte Target, Walmart, Macy’s
Handelswährung USD
Coupon 12.00% p.a.
Kick-In Level (Barriere) 50%
Verfall 05.06.2020
Emittentin UBS AG, London
Zeichnung bis 05.12.2018, 15:00 Uhr
 

Weitere Produkte sowie Informationen zu Chancen und Risiken finden Sie unter: ubs.com/keyinvest Quelle: UBS AG, Bloomberg Stand: 21.11.2018
 
Marktübersicht
Index Stand Woche¹
SMI™ 8’841.48 -1.0%
SLI™ 1’368.38 -1.8%
S&P 500™ 2’649.93 -1.9%
Euro STOXX 50™ 3’153.91 -1.6%
S&P™ BRIC 40 3’853.70 1.1%
CMCI™ Compos. 898.76 -1.0%
Gold (Feinunze) 1’228.00 1.5%

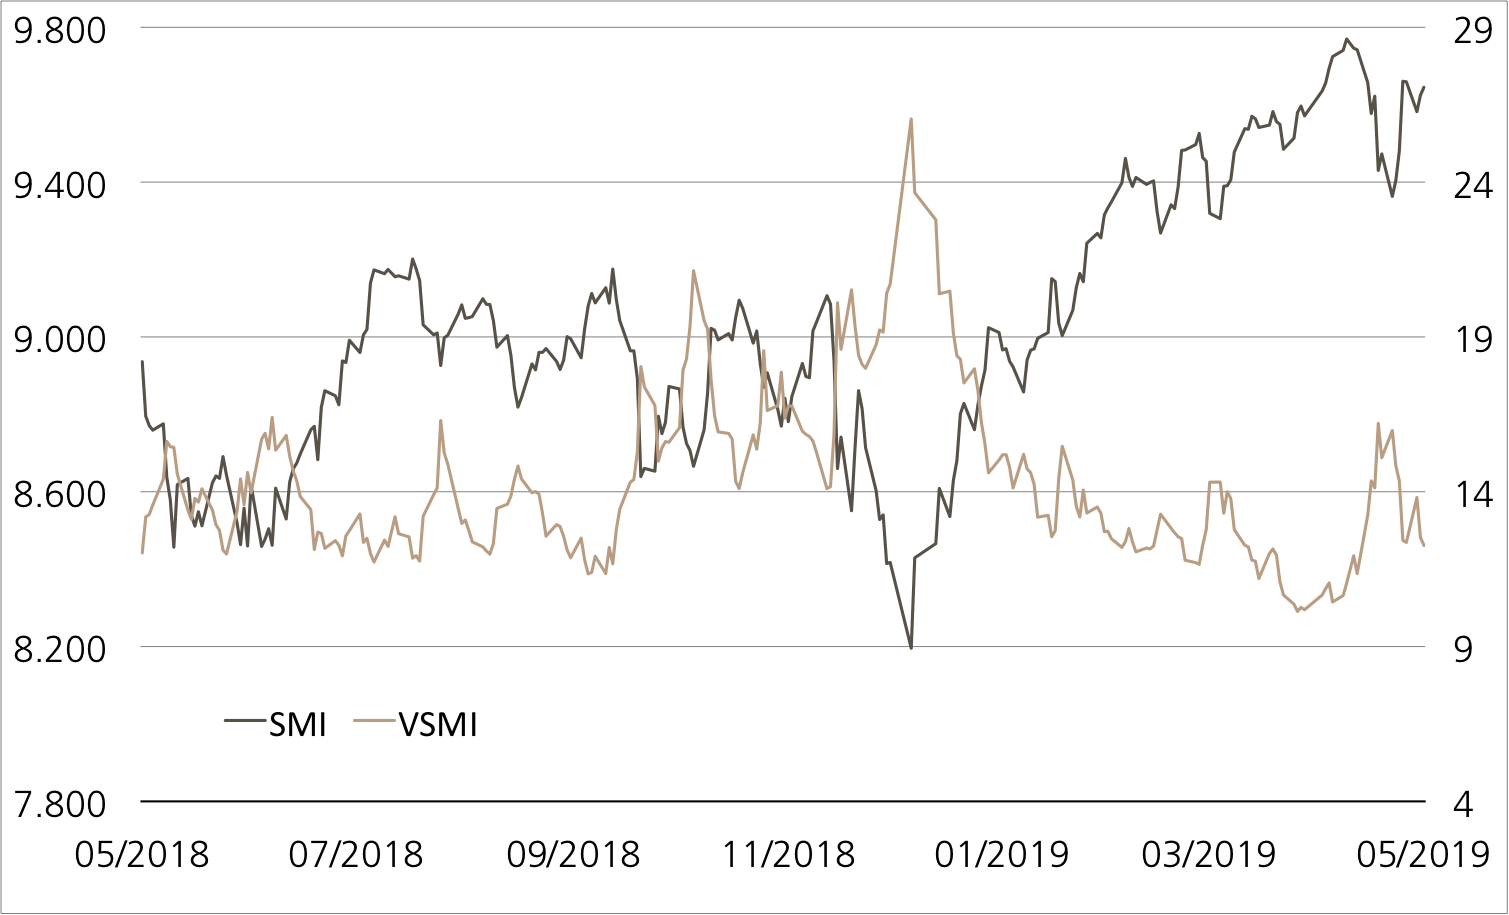
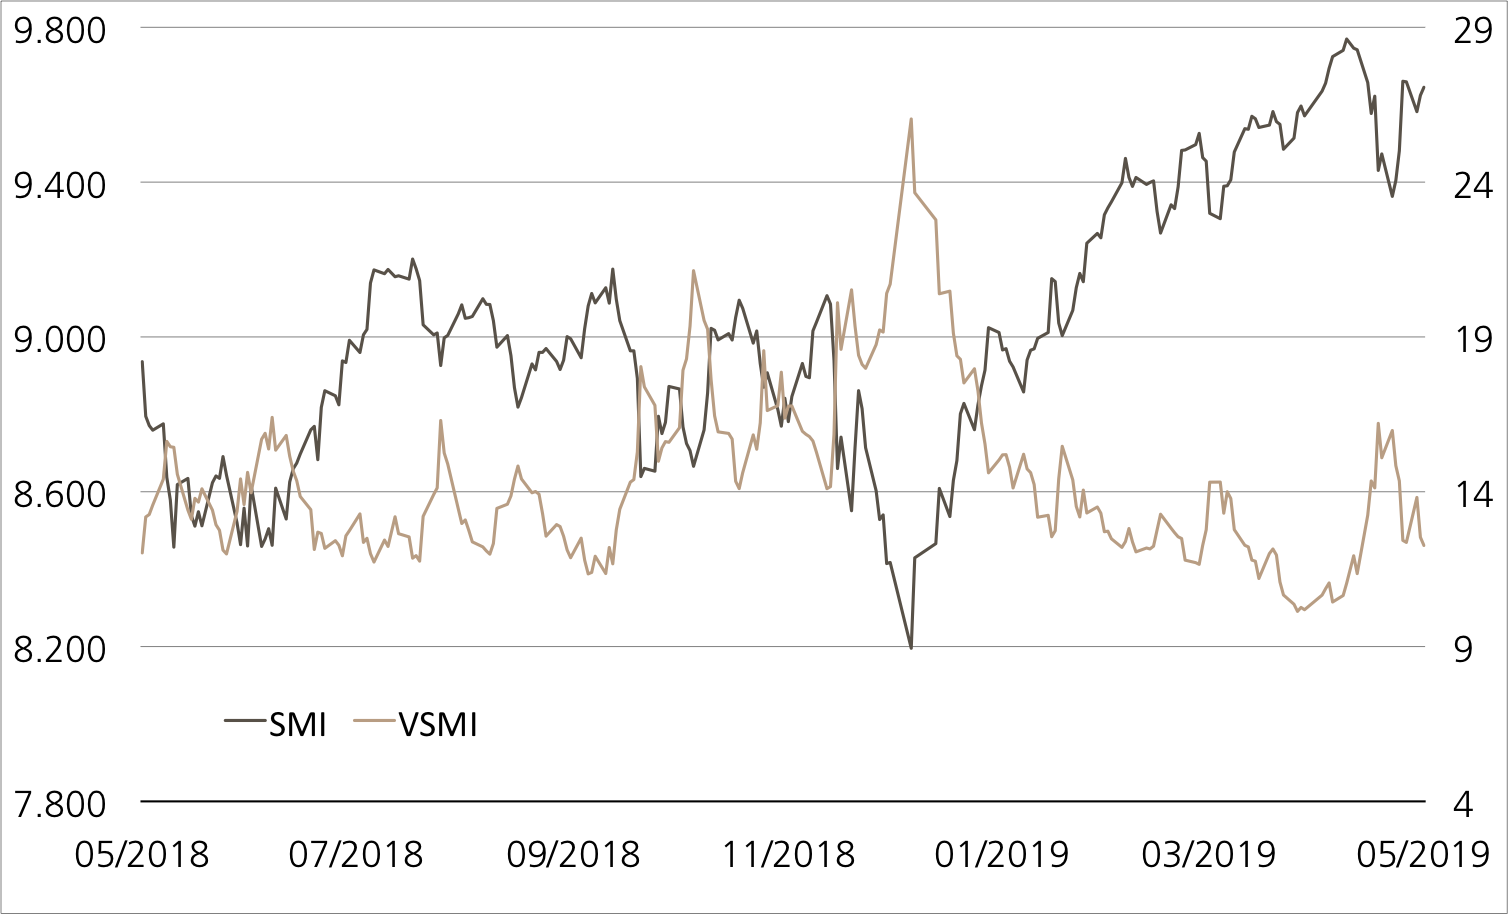
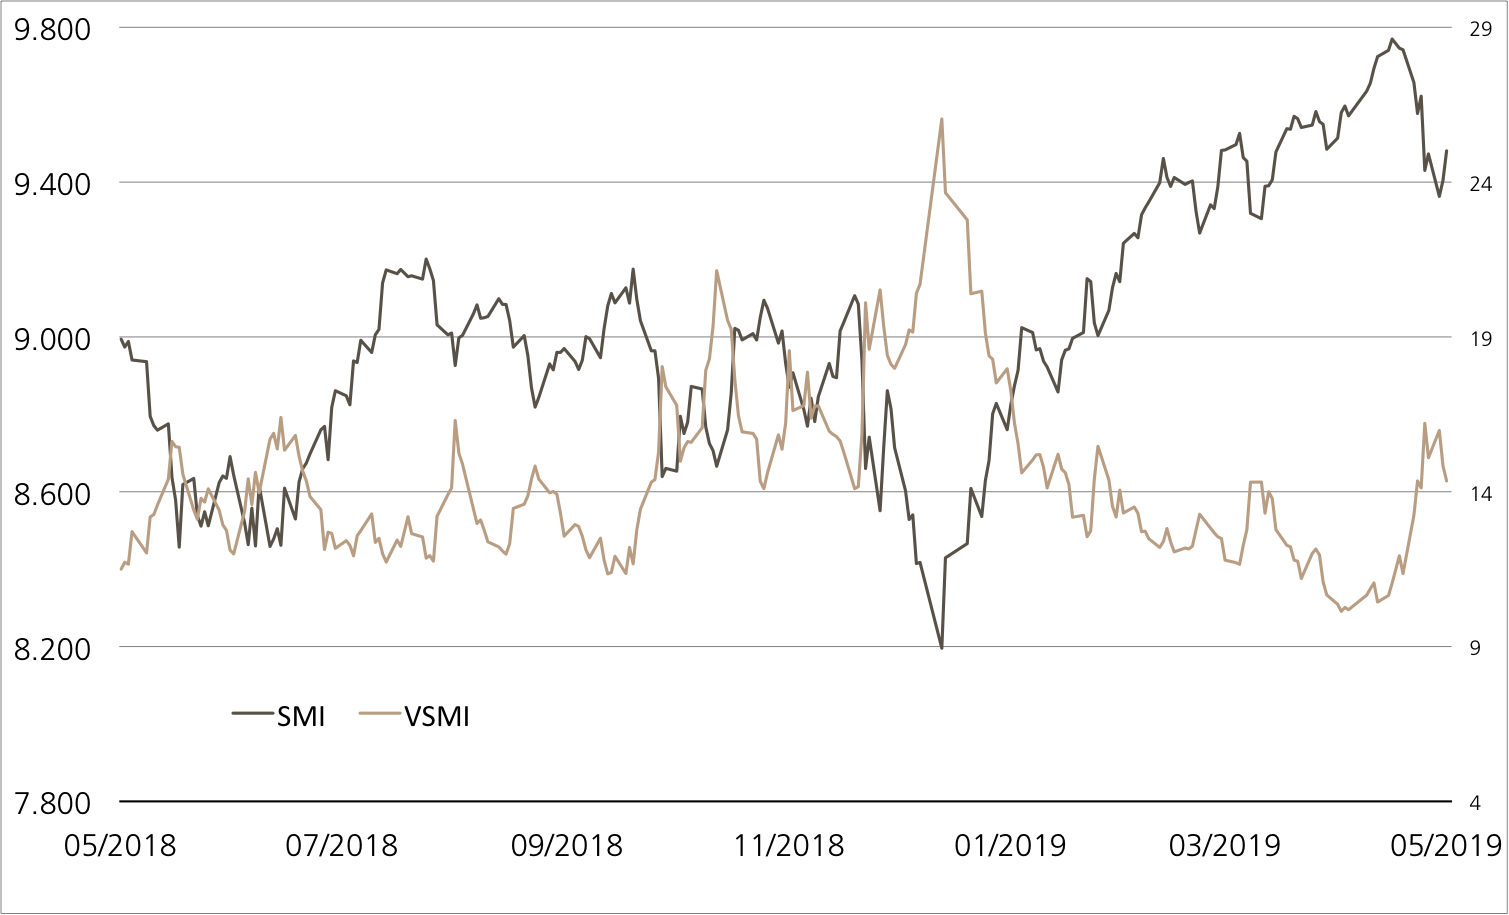
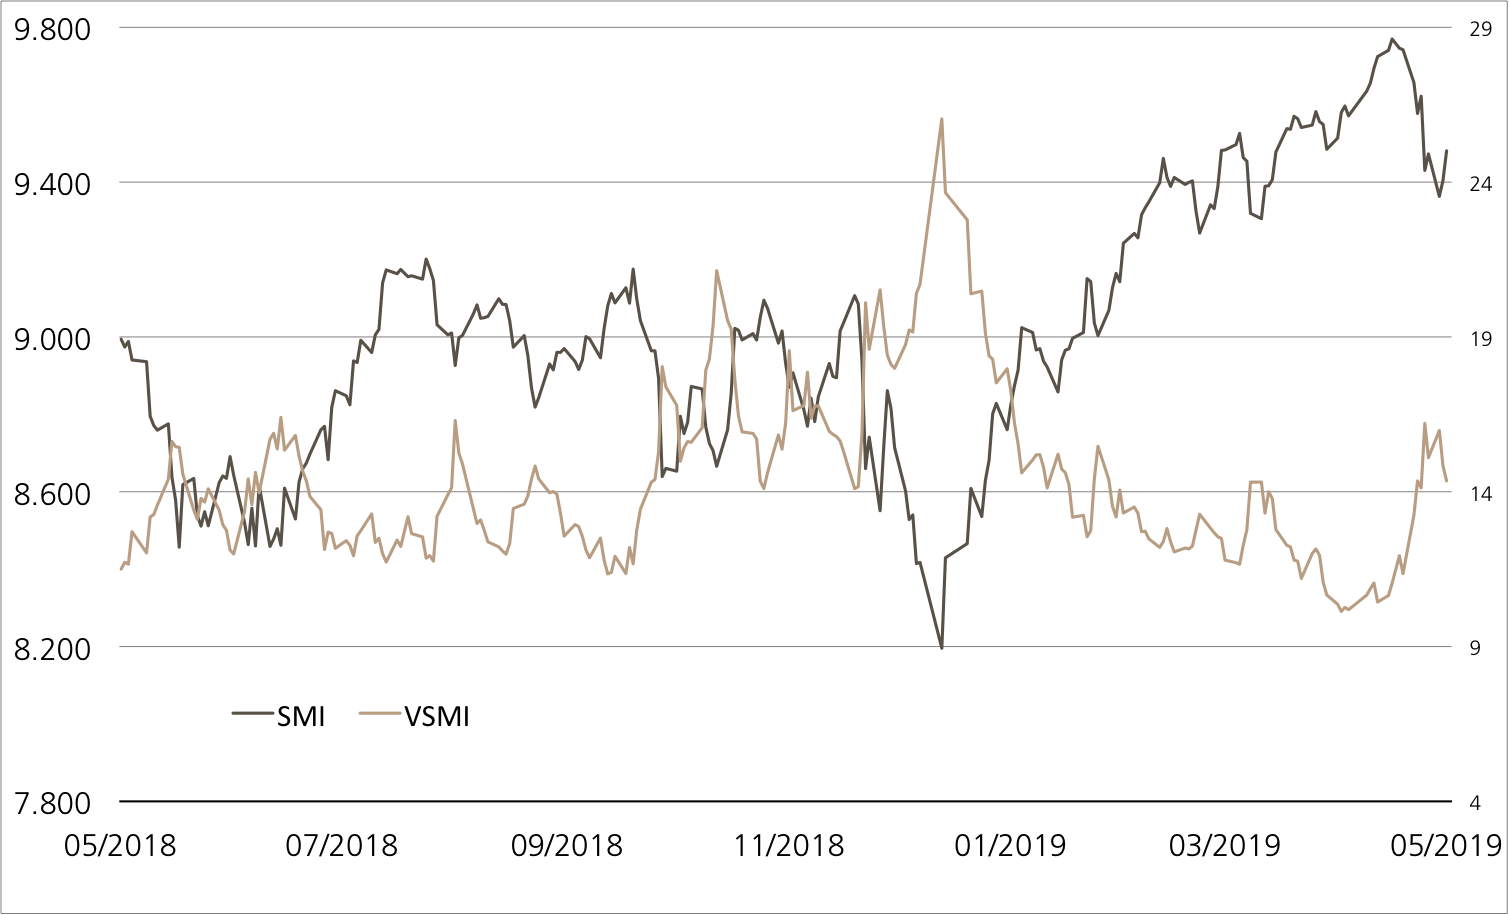
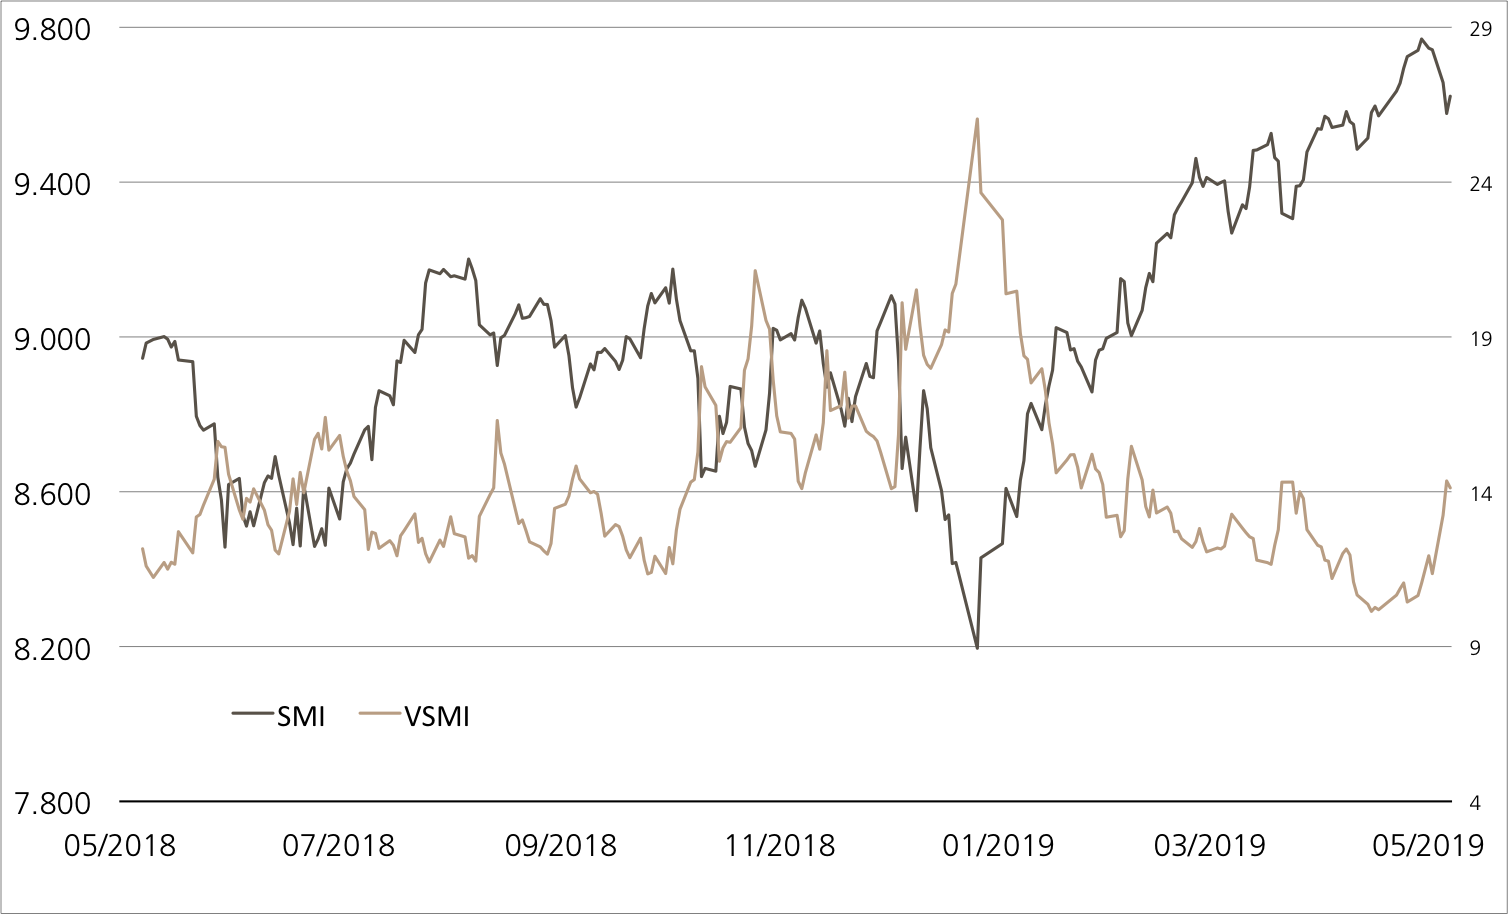
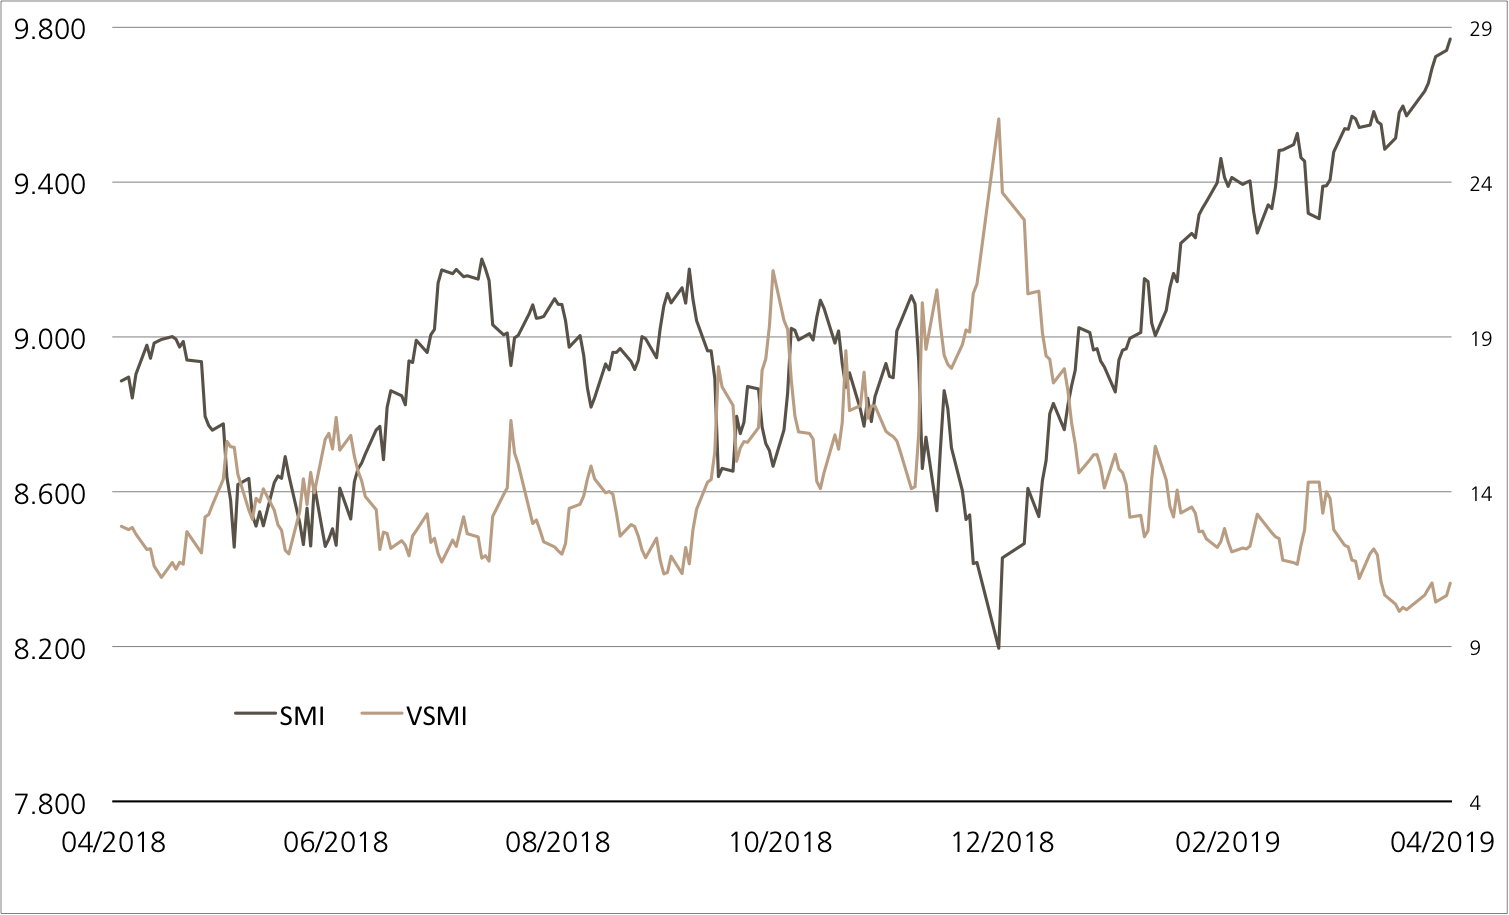
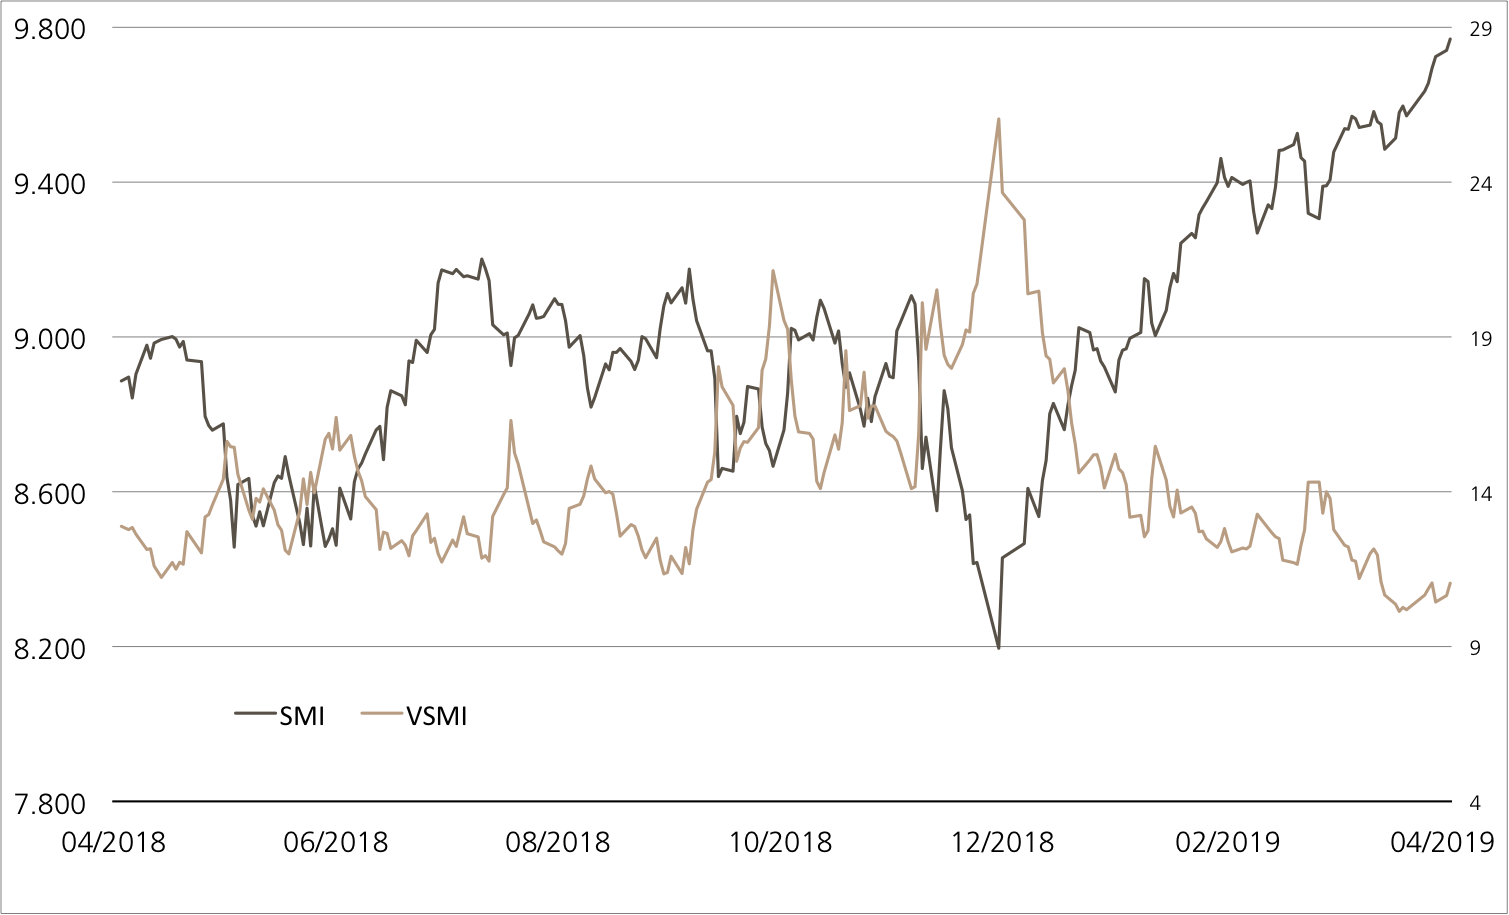
SMI™ vs. VSMI™ 1 Jahr

 
¹ Veränderung auf Basis des Schlusskurses des Vortages im Vergleich zum Schlusskurs vor einer Woche.
Der VSMI™ Index wird seit 2005 berechnet. Er zeigt die Volatilität der im SMI™ Index enthaltenen Aktien. Massgeblich für die Berechnung ist ein Portfolio, welches nicht auf Preisschwankungen, sondern ausschliesslich auf Veränderungen der Volatilität reagiert. Dabei greift die VSMI™ Methodik auf die quadrierten Volatilitäten, im Fachjargon „Varianzen“, der an der Eurex gehandelten SMI-Optionen mit einer konstanten Restlaufzeit von 30 Tagen zurück.


Continental & Michelin
Mehr als nur schwarze Pneus

 
Die Temperaturen sinken, der Regen verwandelt sich in Schnee: Der Blick auf die Wetterkarte zeigt, für Autofahrer ist es längst an der Zeit, die Winterreifen aufzuziehen. Ein perfekter Zeitpunkt, die Hersteller der Pneus genauer unter die Lupe zu nehmen. Die beiden grössten Produzenten in Europa sind Michelin und Continental, wobei die Franzosen die unangefochtene Nummer eins sind. Anders als Michelin ist Continental aber nicht nur auf den schwarzen Gummi fixiert, das Unternehmen ist auch in Zukunftstechnologien wie E-Mobilität und autonomes Fahren tätig. Bei Michelin wiederum hat beim Autoreifen der Zukunft neben der Energieeffizienz vor allem die Laufruhe höchste Priorität. Anleger können sich die beiden innovativen Autozulieferer nun mit nur einem Investment ins Depot holen. Der in Zeichnung stehende Early Redemption (ER) Worst of Kick-In GOAL (Symbol: KCVYDU) auf Continental und Michelin bietet ansehnliche Konditionen: Bleibt die Barriere von 59 Prozent der Startkurse unversehrt, wirft das Produkt spätestens in zwei Jahren die Höchstrendite von 7.00 Prozent p.a. ab.
 
Der Mix aus Reifengeschäft und neuer Automobiltechnik sorgte bei Continental in den vergangenen Jahren für Wachstum. 2018 wird zwar ein Übergangsjahr werden, unter anderem aufgrund der Umstellung auf neue Abgasvorschriften wurde bereits zwei Mal die Prognose gekürzt, doch ist Vorstandschef Elmar Degenhart optimistisch. „Unser Umsatzwachstum und unser Auftragseingang für Automobilelektronik sind angesichts des schwachen Marktumfeldes ein gutes Zeichen“, sagte er bei der jüngsten Zahlenvorlage. Der profitabelste Bereich in den ersten neun Monaten war erneut die Reifensparte mit einer operativen Rendite von 16.3 Prozent.„Unter anderem aufgrund der hohen Performance unserer Winterreifen rechnen wir damit, das Rekordabsatzniveau in Europa aus dem letzten Jahr in 2018 noch einmal übertreffen zu können“, zeigt sich Finanzchef Wolfgang Schäfer zuversichtlich. (Quelle: Continental Pressemitteilung, 08.11.2018) Für UBS CIO WM Research ist Continental das derzeit bevorzugte Unternehmen in dem Sektor. Aber auch beim Konkurrenten Michelin fällt das Analystenurteil auf «Buy». (Quelle: UBS CIO WM Research, 13.11.2018)
 

Chancen:
An der Börse sind Continental und Michelin derzeit auf Bodensuche. Um den neuen ER Worst of Kick-In GOAL (Symbol: KCVYDU) gewinnbringend ins Ziel zu bringen, muss den beiden Titeln keine Wende gelingen. Das Produkt gibt den Basiswerten einen Spielraum von knapp 41 Prozent nach unten, ohne dass die maximale Gewinnchance von 7 Prozent p.a. ausgebremst wird. Die Höchstlaufzeit von zwei Jahren kann aufgrund der Early-Redemption-Funktion um ein Jahr verkürzt werden.

Risiken:
Das vorgestellte Produkt ist nicht kapitalgeschützt. Notiert einer der Basiswerte während der Laufzeit einmal auf oder unter dem jeweiligen Kick-In Level (Barriere) und kommt zudem des Early Redemption Feature nicht zum tragen, kann die Rückzahlung am Verfalltag durch Bartilgung entsprechend der (vom Strike aus) schwächsten Performance aus dem Duo erfolgen (höchstens jedoch zum Nominalwert zuzüglich Coupon). In diesem Fall sind Verluste wahrscheinlich. Zudem trägt der Anleger bei strukturierten Produkten das Emittentenrisiko, so dass das eingesetzte Kapital – unabhängig von der Entwicklung des Basiswertes – im Falle einer Insolvenz der UBS AG verloren gehen kann.
Weitere UBS Produkte sowie Informationen zu Chancen und Risiken finden Sie unter ubs.com/keyinvest.
 
Continental vs. Michelin (5 Jahre)¹
Quelle: UBS AGStand: 21.11.2018

 
7.00% p.a. ER Kick-In GOAL auf Continental, Michelin
Symbol KCVYDU
SVSP Name Barrier Reverse Convertible
SPVSP Code 1230 (Auto-Callable)
Basiswerte Continental, Michelin
Handelswährung EUR
Coupon  7.00% p.a.
Kick-In Level (Barriere)
59%
Verfall 30.11.2020
Emittentin UBS AG, London
Zeichnung bis 28.11.2018, 15:00 Uhr
 

Termsheet Weitere Produkte sowie Informationen zu Chancen und Risiken finden Sie unter: ubs.com/keyinvest   Quelle: UBS AG Stand: 21.11.2018

 
¹) Bitte beachten Sie, dass vergangene Wertentwicklungen keine Indikationen für künftige Wertentwicklungen sind.


Die in diesem Dokument enthaltenen Informationen werden ausschliesslich zu Informations- und Werbezwecken zur Verfügung gestellt und stellen weder Empfehlungen noch Anlageberatung von UBS AG, einer ihrer Tochtergesellschaften oder verbundenen Unternehmen («UBS») dar. Dieses Dokument wird nicht von einer UBS Research Abteilung ausgegeben und ist deshalb nicht als unabhängige Anlageforschung zu erachten. Es stellt weder einen Verkaufsprospekt, noch ein Angebot oder eine Einladung zur Offertenstellung dar, irgendeine Art von Anlage zu tätigen. Beachten Sie bitte, dass die Anlagebeispiele die Ansichten von UBS Research möglicherweise nicht vollständig wiedergeben. Dieses Dokument und die darin beschriebenen Produkte und Dienstleistungen sind allgemeiner Natur und beziehen sich weder auf die persönlichen Anlageziele noch die finanzielle Situation oder besonderen Bedürfnisse eines spezifischen Empfängers. Anlageentscheide sollten stets im Portfoliokontext getroffen werden und Ihre persönliche Situation und Ihre entsprechende Risikobereitschaft und Risikofähigkeit berücksichtigen. Sie werden hiermit auf diese Risiken (die mitunter erheblich sein können) hingewiesen. Bevor Sie einen Anlageentscheid treffen, lesen Sie bitte die spezifischen Produkteinformationen und die Broschüre «Besondere Risiken im Effektenhandel». Bitte kontaktieren Sie Ihren Kundenberater, der Sie gerne bei Ihren Anlageideen unterstützt und Ihnen die spezifischen Produktinformationen zur Verfügung stellt. UBS übernimmt diesbezüglich keinerlei Haftung für das Verhalten von Dritten. Wir weisen Sie darauf hin, dass sich UBS das Recht vorbehält, Dienstleistungen, Produkte und Preise jederzeit ohne vorhergehende Ankündigung zu ändern, und dass sich die wiedergegebenen Informationen und Meinungen jederzeit ändern können. Es wird weder eine ausdrückliche noch stillschweigende Gewährleistung oder Garantie in Bezug auf die Richtigkeit, Vollständigkeit oder Verlässlichkeit der wiedergegebenen Informationen abgegeben, es sei denn, es handelt sich um Informationen, die sich auf die UBS AG beziehen. Zudem stellt dieses Dokument keine umfassende Beschreibung oder Zusammenfassung der genannten Märkte und Entwicklungen dar. Gewisse Zahlen beziehen sich auf vergangene Wertentwicklungen oder stellen simulierte Wertentwicklungen dar und sind somit keine zuverlässigen Indikatoren für künftige Ergebnisse. Bei einigen Zahlen handelt es sich möglicherweise lediglich um Prognosen, und Prognosen sind kein zuverlässiger Indikator für zukünftige Entwicklungen. Gewisse Diagramme und/oder Darstellungen von Wertentwicklungen basieren möglicherweise nicht auf 12-Monate-Perioden, was ihre Vergleichbarkeit und Aussagekraft reduziert. Wechselkurse können sich negativ auf den Wert, den Preis oder die Einnahmen von Produkten und Dienstleistungen auswirken, die in den Materialien genannt werden. Gebühren sind möglicherweise nicht enthalten und reduzieren die Wertentwicklung entsprechend. Die steuerliche Behandlung hängt von den individuellen Umständen jedes Kunden ab und kann sich in Zukunft ändern. UBS erbringt keine Rechts- oder Steuerberatungsdienste und gibt weder allgemeine noch auf die spezifischen Umstände und Bedürfnisse eines Kunden bezogene Erklärungen im Hinblick auf die steuerliche Behandlung von Anlagen oder der damit verbundenen Anlagerenditen ab. Die Empfänger sollten eine unabhängige rechtliche und steuerliche Beratung im Hinblick auf die Auswirkungen der Produkte/Dienstleistungen in der jeweiligen Rechtsordnung sowie die Eignung der Produkte und Dienstleistungen in Anspruch nehmen. UBS, ihre Verwaltungsräte, Geschäftsführer und Mitarbeiter oder Kunden halten oder hielten möglicherweise Anteile oder Hausse- und Baisse-Positionen («Longoder Short-Positionen») an den hierin genannten Wertpapieren oder sonstigen Finanzinstrumenten und können jederzeit als Auftraggeber oder Beauftrage Käufe und/oder Verkäufe tätigen. UBS fungiert oder fungierte möglicherweise als Marktmacher («Market-Maker») bei den Wertpapieren oder sonstigen Finanzinstrumenten. Des Weiteren unterhält oder unterhielt UBS möglicherweise eine Geschäftsbeziehung mit oder erbringt oder erbrachte Investmentbanking-, Kapitalmarktdienstleistungen und/oder sonstige Finanzdienstleistungen für die jeweiligen Unternehmen. Dieses Dokument und die darin enthaltenen Informationen sind ausschliesslich für Personen mit Domizil Schweiz gedacht. Sie dürfen unter keinen Umständen in Rechtsordnungen verbreitet werden, in denen eine solche Verbreitung gegen geltende Gesetze oder Regulierungen verstösst. Sie dürfen insbesondere nicht in den USA und/oder an USPersonen oder in Rechtsordnungen verteilt werden, in denen der Vertrieb durch uns eingeschränkt ist.Die im Dokument enthaltenen Informationen stammen, sofern nicht anders angegeben, von UBS. UBS übernimmt keine Gewährleistung (weder ausdrücklich noch stillschweigend) für Richtigkeit, Vollständigkeit und Aktualität der Informationen. Sie können jederzeit und ohne vorherige Ankündigung geändert werden. UBS ist nicht verpflichtet, die hierin enthaltenen Informationen zu aktualisieren oder auf dem neuesten Stand zu halten.Das vorliegende Material beinhaltet Daten, welche aus dem Backtesting von Daten resultieren, und wurde von UBS in gutem Glauben und unter Anwendung standardisierter Methoden erstellt. Diese Methoden basieren auf eigenen Modellen, empirischen Daten, Annahmen und anderen Informationen, die wir für korrekt und angemessen erachten. Gewisse Links führen zu Websites Dritter. Diese sind dem Einfluss der UBS vollständig entzogen, weshalb UBS für Richtigkeit, Vollständigkeit und Rechtmässigkeit des Inhalts solcher Websites sowie für darauf enthaltene Angebote und (Dienst-) Leistungen keinerlei Verantwortung übernimmt.Für gewisse Dienstleistungen und Produkte gelten gesetzliche Bestimmungen. Diese Dienstleistungen und Produkte können daher nicht weltweit uneingeschränkt angeboten werden.Hinweise zu den Grafiken: Nur für Illustrationszwecke. Vergangene Performance ist kein zuverlässiger Indikator für die künftige Performance. © UBS 2017. Das Schlüsselsymbol und UBS gehören zu den eingetragenen und nicht eingetragenen Markenzeichen von UBS. Alle Rechte bleiben vorbehalten.  Der SMI™ Index sowie entsprechende Marken und der SLI™ Index sowie entsprechende Marken und der der Swiss Performance Index™ Index (SPITM) sowie entsprechende Marken und der VSMI™ sowie entsprechende Marken sind Eigentum der SIX Swiss Exchange AG. Alle Rechte vorbehalten. Der S&P 500™ Index sowie entsprechende Marken und der S&P 500 Industrials Index™ sowie entsprechende Marken sind Eigentum der Standard & Poor›s Financial Services LLC. Alle Rechte vorbehalten. Der Euro STOXX 50™ Index sowie entsprechende Marken und der STOXX Europe 600 Banks Index sowie entsprechende Marken sind Eigentum der Stoxx AG. Alle Rechte vorbehalten. Der CMCI™ Composite Index sowie entsprechende Marken sind Eigentum der UBS AG. Alle Rechte vorbehalten. Der DAX™ Index sowie entsprechende Marken sind Eigentum der Deutsche Börse AG. Alle Rechte vorbehalten. Der JPM™ German Government Bond Index sowie entsprechende Marken sind Eigentum der JPM International Limited. Alle Rechte vorbehalten. Der NIKKEI 225™ Index sowie entsprechende Marken sind Eigentum der Nihon Keizai Shimbun Incorporation. Alle Rechte vorbehalten. Der EPRA Index™ sowie entsprechende Marken sind Eigentum der European Public Real Estate Association. Alle Rechte vorbehalten. Der FTSE™ Index sowie entsprechende Marken sind Eigentum der London Stock Exchange Group Holdings Limited. Alle Rechte vorbehalten. Der MSCI™ World Index sowie entsprechende Marken sind Eigentum der MSCI Incorporation. Alle Rechte vorbehalten. Der KOSPI™ Index sowie entsprechende Marken sind Eigentum der Korea Exchange Incorporation. Alle Rechte vorbehalten. Der HSCEI™ Index, der Hang Seng China EnterprisesTM Index sowie entsprechende Marken sind Eigentum der Hang Seng Data Services Limited. Alle Rechte vorbehalten.

Weekly-Hits Ausgabe vom 22.11.20182018-11-23T12:31:31+01:00

Weekly-Hits édition de 16.11.2018

KeyInvest Weekly Hits

Vendredi, 16.11.2018

keyinvest Norwegen
  • Thème 1: Norvège - Relance dans le grand Nord
  • Thème 2: General Motors / Ford - Les constructeurs automobiles présentent des résultats solides

Norvège
Relance dans le grand Nord

Le secteur pétrolier participe fortement à la reprise actuelle en Norvège. Dans le même temps, ce pays scandinave profite d’affaires florissantes dans l’industrie de la pêche. Globalement, selon les prévisions actuelles du Fonds monétaire international (FMI), le produit intérieur brut norvégien pourrait croître de plus de 2% en 2018, une première depuis 2012. L’ETT (symbole : ETLNO) sur le MSCI™ Daily TR Net Norway Index permet un positionnement diversifié sur le marché des actions de cette petite économie. Avec le PERLES (symbole : REUFIU) sur le Norway Fish Equity Basket, les investisseurs peuvent miser de manière ciblée sur le deuxième secteur d’exportation du pays.

Des fiords impressionnants, des glaciers gigantesques, des villages pittoresques et des villes modernes. C’est avec des attractions de ce type que la Norvège attire des millions de touristes chaque année. Pour les investisseurs également, ce pays du grand Nord a son charme. Jusqu’à présent en 2018, le MSCI™ Daily TR Net Norway Index affiche une hausse de 2,2%. La bourse d’Oslo se démarque ainsi du marché européen des actions dominé par des signes inquiétants.¹ La surperformance de la Norvège a été portée par l’industrie pétrolière. Equinor, la plus grande entreprise du pays, appartient à ce secteur. La multinationale active dans plus de 30 pays vient de publier ses résultats pour les neufs premiers mois de 2018. Le rapport intermédiaire montre comment la hausse des prix du pétrole durant cette période se répercute positivement sur le résultat. Avec plus de 13,4 milliards de dollars US, le résultat opérationnel de janvier à septembre est de 56% supérieur à la valeur de l’année précédente. S’agissant du cash-flow opérationnel, au bout de neuf mois, Equinor avait déjà dépassé, avec 15,5 milliards de dollars US, la valeur de l’année 2017 dans son ensemble. (Source : Rapport financier Equinor, 3e trimestre 2018)

Enfin, l’industrie norvégienne de la pêche a également réalisé d’excellentes affaires. Le deuxième secteur d’exportation le plus important du pays profite d’un comportement alimentaire en pleine évolution. En particulier le saumon d’élevage est apprécié par des consommateurs toujours plus nombreux. Rien qu’au mois d’août, la Norvège a exporté 100 000 tonnes de ce poisson à la chair rose typique. Un nouveau record pour le mois d’été. Au cours des huit premiers mois de l’année, les Scandinaves ont augmenté de 11% à 1,8 million de tonnes le volume de fruits de mer exportés. (Source : Norwegian Seafood Council communiqué de presse, 18.10.2018). Dans ce contexte, il n’est pas étonnant que l’action de Marine Harvest soit cotée à un niveau record.¹ D’autant plus que le plus grand éleveur de saumons du monde a dépassé tant en volume qu’en résultat les attentes au troisième trimestre. (Source : Thomson Reuters, revue de presse, 15.10.2018).

Opportunités: Equinor et Marine Harvest comptent parmi les poids lourds du MSCI Daily TR Net Norway Index. Outre le duo que nous venons de présenter, l’indice de référence comprend huit autres actions. Cet indicateur couvre ainsi, selon les indications du fournisseur d’indice MSCI, quelque 85M de la capitalisation boursière ajustée à flottance libre du pays scandinave. L’ETT (symbole : ETLNO) suit l’indice dans un rapport de 100:1. Typiquement pour ce type de structure de produit, il n’y a pas de commission de gestion.² Les dividendes des entreprises sous-jacentes sont réinvestis net dans l’indice. En juin 2017, UBS a lancé le PERLES (symbole : REUFIU) sur le Norway Fish Equity Basket. Entretemps, ce produit de participation libellé en couronne norvégienne est coté à 65% au-dessus du prix d’émission. Le panier comprend le numéro 1 de la branche Marine Harvest et six autres actions de pêcheries norvégiennes.

Risques: il n’existe aucune protection du capital pour les produits présentés. Une évolution négative de la valeur de base génère des pertes correspondantes pour l’ETT et le PERLES. Par ailleurs, avec les produits structurés, l’investisseur supporte le risque d’émetteur. Cela signifie qu’en cas d’insolvabilité d’UBS SA, le capital investi peut être perdu, indépendamment de l’évolution du sous-jacent.

Vous trouverez davantage de produits UBS et des informations sur les opportunités et les risques à l’adresse ubs.com/keyinvest.

MSCI™ Daily TR Net Norway USD Index 5 ans¹

Depuis début 2016, le MSCI™ Daily Norway Index connaît une tendance à la hausse très importante. Fin septembre, l’indice de référence a grimpé à son niveau le plus haut depuis environ quatre ans.

Source: UBS AG, Bloomberg

Valeurs du: 14.11.2018

Marine Harvest vs. SalMar vs. Leroy Seafood 5 ans¹

Si l’on se base sur leur valeur boursière, Marine Harvest, SalMar et Leroy Seafood sont les trois membres les plus importants du Norway Fish Equity Basket. Ces dernières années, le trio a enregistré de coquets bénéfices sur les cours.

Source: UBS AG, Bloomberg

Valeurs du: 14.11.2018

¹) La performance passée n’indique pas les résultats futures.
²) Les condition des ETTs sont vérifiés annuellement et peuvent être ajustées avec un délai de 13 mois après la publication.

ETT sur MSCI™ Daily TR Net Norway USD Index

Symbol ETLNO
SVSP Name Tracker Certifikat
SPVSP Code 1300
Sous-jacent MSCI™ Daily TR Net Norway USD Index 
Devise USD
Rapport de souscription 100:1
Frais de gestion 0.00% p.a.²
Participation 100%
Echéance Open End
Émetteur UBS AG, London
Bid/Ask USD 85.00 / 85.45
 

PERLES auf den Norway Fish Equity Basket

Symbol REUFIU
SVSP Name Tracker Certifikat
SPVSP Code 1300
Sous-jacent Norway Fish Equity Basket
Devise NOK
Rapport de souscription 1:1
Participation 100%
Echéance 03.06.2019
Émetteur UBS AG, London
Bid/Ask NOK 1’569.00 / 1’585.00 
 

Vous trouverez davantage de produits UBS et des informations sur les opportunités et les risques à l’adresse ubs.com/keyinvest.

Source: UBS AG, Bloomberg

Valeurs du: 14.11.2018

Apérçu du marché

Index Citation Semaine¹
SMI™ 8’931.20 -1.3%
SLI™ 1’392.78 -2.3%
S&P 500™ 2’701.58 -4.0%
Euro STOXX 50™ 3’205.36 -1.3%
S&P™ BRIC 40 3’812.92 -3.6%
CMCI™ Compos. 907.58 -2.2%
Gold (once troy) 1’210.10 USD -1.5%

¹ Changement basé sur le cours de clôture du jour précédent par rapport au cours de clôture de la semaine dernière.

SMI™ vs. VSMI™ 1 année
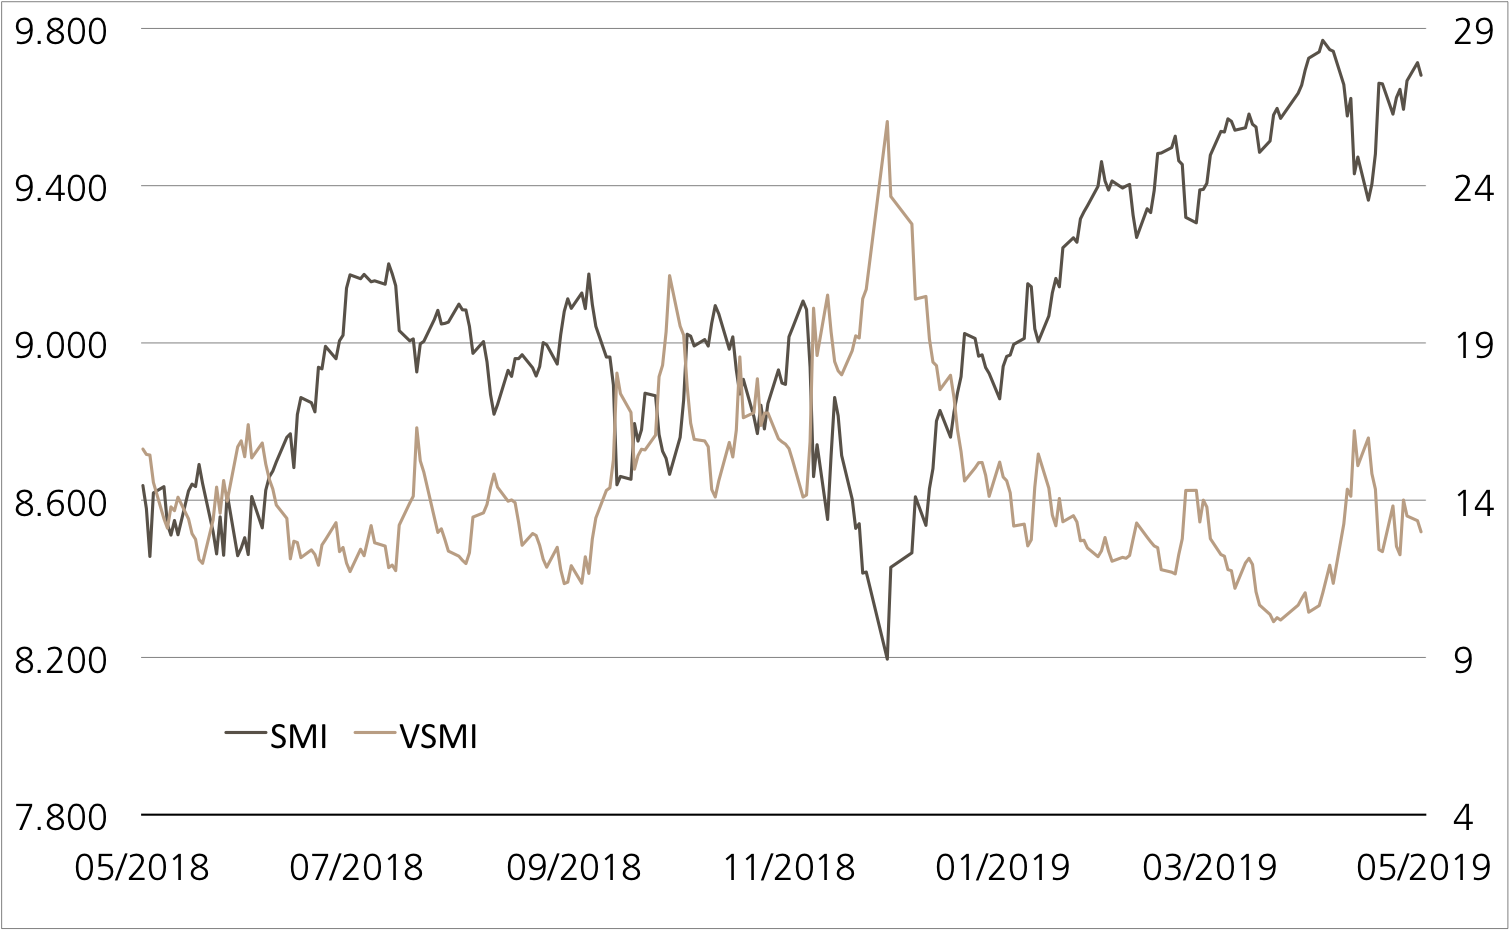
L’index VSMI™ est calculé depuis 2005. Il affiche la volatilité des actions inclus dans le SMI™ index. Pour la calculation, un portefeuille est utilisé qui ne réagit qu’au variations de la volatilité au lieu des variations des prix. En le faisant, la méthodologie du VSMI™ utilise la volatilité carré, connu sous le terme variance, des options sur le SMI avec 30 jours jusqu’à l’échéance négociées à la Bourse Eurex.

Source: UBS AG, Bloomberg

Valeurs du: 14.11.2018

General Motors / Ford
Les constructeurs automobiles présentent des résultats solides

Actuellement, dans l’univers automobile, les véhicules tout terrain mènent la danse. Ceci ressort des immatriculations pour octobre aux Etats-Unis. Par exemple pour Ford : alors que les limousines ont enclenché la marche arrière, les SUV ont enregistré une croissance à deux chiffres des ventes, et la Série F a dépassé pour le huitième mois consécutif le seuil des 70 000 véhicules vendus. Chez General Motors (GM) également, les affaires sont florissantes grâce aux SUV. Les modèles haut de gamme ont permis au troisième trimestre un bond de 25% des bénéfices opérationnels. Les boursiers applaudissent : au cours des quatre dernières semaines, les deux actions ont progressé d’un pourcentage à deux chiffres.¹ Le nouveau Worst of Kick-In GOAL (symbole : KCVNDU) sur le duo automobile s’en sort sans accélération de cours supplémentaire. En cas d’évolution latérale, le produit dispose d’un coupon de 10,00% p.a. ainsi que d’une marge de sécurité de 40%.

Si GM a gagné plus que prévu au troisième trimestre, le constructeur automobile a restreint ses objectifs annuels. Désormais, en 2018, l’extrémité supérieure de la fourchette de 5,80 à 6,20 dollars US devrait être atteinte pour le résultat consolidé avant impôts par actions. Pour que le moteur des bénéfices tourne à haut régime également à l’avenir, le groupe procède à des coupes budgétaires. 18 000 collaborateurs sur 50 000 en Amérique du Nord ont récemment reçu une offre d’indemnisation. Ford a également dépassé les prévisions du marché dans son dernier rapport intermédiaire. Si la société est encore en pleine transformation, celle-ci devrait bientôt s’avérer payante. Le responsable financier Bob Shanks a confirmé l’objectif d’une marge avant impôts de 8% lors de la présentation des résultats trimestriels. Toutefois, ceci ne se produira probablement pas d’ici 2020 comme annoncé. Par ailleurs, la société développe ses pistes en ce qui concerne la « voiture de demain ». Selon un rapport de presse, Ford négocie actuellement avec VW afin d’établir une collaboration pour le développement onéreux de la technique de conduite autonome et de l’e-voiture. Rien n’est décidé pour l’instant, mais le porte-parole de Ford a expliqué que l’accord prévu entre le groupe américain et VW comprend des négociations sur de possibles coopération dans toute une série de domaines. (Source : Thomson Reuters, revue de presse, mercredi 31 octobre 2018).

Opportunités: afin d’arriver au terme de manière profitable avec le Worst of Kick-In GOAL (symbole : KCVNDU), une évolution latérale de Ford et GM sera suffisante. Le produit en souscription génère un coupon de 10.00% p.a. indépendamment de l’évolution du cours. En revanche, le remboursement du nominal est couplé aux sous-jacents. Aucune baisse n’est à craindre tant qu’aucune action n’ait atteint ou ne passe en-dessous de la barrière de 60% du niveau initial.

Risques: les Kick-In GOALS ne bénéficient d’aucune protection du capital. Si, pendant la durée de l’investissement, l’un des sous-jacents atteint une seule fois la barrière respective (« Kick-In Level ») ou est inférieur à celle-ci, l’amortissement par remboursement en espèces à l’échéance est basé sur la performance la plus faible (base Strike) du duo (au maximum toutefois à la valeur nominale majorée du coupon). Dans un tel cas, des pertes sont probables. Par ailleurs, avec les produits structurés, l’investisseur supporte le risque d’émetteur. Cela signifie qu’en cas d’insolvabilité d’UBS SA, le capital investi peut être perdu, indépendamment de l’évolution du sous-jacent.

Vous trouverez davantage de produits UBS et des informations sur les opportunités et les risques à l’adresse ubs.com/keyinvest.

General Motors vs. Ford Motor 5 ans¹

Source: UBS AG, Bloomberg

Valeurs du: 14.11.2018

10.00% p.a. Worst of Kick-In GOAL sur General Motors / Ford

Symbol KCVNDU
SVSP Name Barrier Reverse Convertible
SPVSP Code 1230
Sous-jacent General Motors / Ford
Devise USD
Coupon 10.00% p.a.
Kick-In Level 60.00%
Echéance 21.11.2019
Émetteur UBS AG, London
Date de fixation du prix 21.11.2018, 15:00 h
 

Vous trouverez davantage de produits UBS et des informations sur les opportunités et les risques à l’adresse ubs.com/keyinvest.

Source: UBS AG, Bloomberg

Valeurs du: 14.11.2018

¹) La performance passée n’indique pas les résultats futures.
²) Les condition des ETTs sont vérifiés annuellement et peuvent être ajustées avec un délai de 13 mois après la publication.

This material has been prepared by UBS AG or one of its affiliates («UBS»). This material is for distribution only as permitted by law. It is not prepared for the needs of any specific recipient. It is published solely for information and is not a solicitation or offer to buy or sell any securities or related financial instruments (“Instruments”). UBS makes no representation or warranty, either express or implied, on the completeness or reliability of the information contained in this document (“Information”) except that concerning UBS AG and its affiliates. The Information should not be regarded by recipients as a substitute for using their own judgment. Any opinions expressed in this material may change without notice and may be contrary to opinions expressed by other business areas of UBS as a result of using different assumptions or criteria. UBS is under no obligation to update the Information. UBS, its officers, employees or clients may have or have had an interest in the Instruments and may at any time transact in them. UBS may have or have had a relationship with entities referred to in the Information. Neither UBS nor any of its affiliates, or their officers or employees, accepts any liability for any loss arising from use of the Information. This presentation is not a basis for entering into a transaction. Any transaction between you and UBS will be subject to the detailed provisions of the term sheet, confirmation or electronic matching systems relating to that transaction. Clients wishing to effect transactions should contact their local sales representative.
This information is communicated by UBS AG and/or its affiliates («UBS»). * (see below) UBS may from time to time, as principal or agent, have positions in, or may buy or sell, or make a market in any securities, currencies, financial instruments or other assets underlying the product to which this website relates (the «Structured Product»). UBS may provide investment banking and other services to and/or have officers who serve as directors of the companies referred to in this website. UBS’s trading and/or hedging activities related to the Structured Product may have an impact on the price of the underlying asset and may affect the likelihood that any relevant barrier or relevant trigger event is crossed or triggered. UBS has policies and procedures designed to minimise the risk that officers and employees are influenced by any conflicting interest or duty and that confidential information is improperly disclosed or made available. UBS may pay or receive brokerage or retrocession fees in connection with the Structured Product described herein. In respect of any Structured Product that is a security, UBS may, in certain circumstances, sell the Structured Product to dealers and other financial institutions at a discount to the issue price or rebate to them for their own account some proportion of the issue price. Further information is available on request. Structured Products are complex and may involve a high risk of loss. Prior to purchasing the Structured Product you should consult with your own legal, regulatory, tax, financial and accounting advisors to the extent you consider it necessary, and make your own investment, hedging and trading decisions (including decisions regarding the suitability of the Structured Product) based upon your own judgement and advice from those advisers you consider necessary. Save as otherwise expressly agreed in writing, UBS is not acting as your financial adviser or fiduciary in relation to the Product. UBS generally hedges its exposure to Structured Products, although it may elect not to hedge or to partially hedge any Structured Product. UBS’s hedging activity may be conducted through transactions in the underlying asset, index or instrument or in options, futures or other derivatives related to the underlying asset, index or instrument on publicly traded markets or otherwise, and may have an impact on the price of the under-lying asset. If a transaction is cash settled, UBS will generally unwind or offset any hedge it has for such Structured Product in close proximity to the relevant valuation time or period. In some cases, this activity may affect the value of the Structured Product. Unless stated otherwise in this document, (i) this document is for information purposes only and should not be construed as an offer, personal recommendation or solicitation to purchase the Structured Product and should not be treated as giving investment advice, and (ii) the terms of any investment in the Structured Product will be exclusively subject to the detailed provisions, including risk considerations, contained in the more detailed legal documentation that relates to the Structured Product (being the confirmation, information memorandum, prospectus or other issuer documentation as relevant). UBS makes no representation or warranty relating to any information herein which is derived from independent sources. This document shall not be copied or reproduced without UBS’s prior written permission. In respect of any Structured Product that is a security, no action has been or will be taken in any jurisdiction that would permit a public offering of the Product, save where explicitly stated in the issuer documentation. The Structured Product must be sold in accordance with all applicable selling restrictions in the jurisdictions in which it is sold.
© UBS 2018. All rights reserved. UBS prohibits the forwarding of this information without the approval of UBS.
Weekly-Hits édition de 16.11.20182018-11-16T09:20:45+01:00

Weekly-Hits edition of 16.11.2018

KeyInvest Weekly Hits

Friday, 16.11.2018

keyinvest Norwegen
  • Topic 1: Norway - Upswing in the far north
  • Topic 2: General Motors / Ford - Car manufacturers with strong figures

Norway
Upswing in the far north

The oil sector has been the main driving force behind the current upswing being enjoyed in Norway. At the same time, the Scandinavian country is benefitting from the flourishing business of the fishing industry. According to the current forecasts of the International Monetary Fund (IMF), Norway’s gross domestic product in 2018 could on the whole grow by more than 2% for the first time since 2012. The ETT (symbol: ETLNO) on the MSCI™ Daily TR Net Norway Index allows investors to take up a diversified position on the equity market of this small economy. With the PERLES (symbol: REUFIU) on the Norway Fish Equity Basket, investors can focus on the country’s second largest export sector.

While Norway attracts millions of tourists every year with its breathtaking fjords, huge glaciers, picturesque villages and modern cities, the country in the far north is also proving attractive for investors. Over the past year, the MSCI™ Daily TR Net Norway Index has recorded positive growth of 2.2%. This sets the Oslo Stock Exchange apart from the European stock market, which is dominated by negative performances.¹ Norway’s outperformance was driven by the oil industry, which is home to Equinor, by far the largest company in the country. The energy multinational, which has operations in more than 30 countries, has just published its figures for the first nine months of 2018. Its quarterly report illustrates how the rise in oil prices during this period had a positive impact on earnings. Standing at USD 13.4 billion, operating earnings for the period from January to September were up 56% on the previous year. Equinor’s operating cash flow after nine months totaled USD 15.5 billion, which means that it has already surpassed the figure recorded in 2017 as a whole. (Source: Equinor Financial Report Q3 2018)

The Norwegian fishing industry has also been flourishing lately. The country’s second most important export sector is benefitting from changing dietary habits among the world’s population, with farm-raised salmon in particular appealing to the taste buds of an ever-increasing number of consumers. In August alone, Norway exported 100,000 tons of the typically pink fish – a new record for the summer month. In the first eight months of the year, the Scandinavians increased total seafood exports by 11% to 1.8 million tons. (Source: Norwegian Seafood Council press release, October 18, 2018) In light of this, it is not surprising that Marine Harvest’s share is trading at record levels.¹ Especially as the world’s largest salmon farmer exceeded expectations in the third quarter in terms of both volume and earnings. (Source: Thomson Reuters media report, October 15, 2018)

Opportunities: Equinor and Marine Harvest are among the heavyweights in the MSCI Daily TR Net Norway Index. In addition to the aforementioned duo, eight other shares are included in the benchmark. According to index provider MSCI, the benchmark thus covers around 85% of the free-float-adjusted market capitalization of the Scandinavian country. The ETT (symbol: ETLNO) tracks the index at a subscription ratio of 100:1. There are usually no ongoing management fees for this product structure.² The dividend payments made by the included companies are reinvested net in the index. In June 2017, UBS launched the PERLES (symbol: REUFIU) on the Norway Fish Equity Basket. The participation product denominated in Norwegian kroner is now trading at 65% above the issue price. The basket includes the industry leader Marine Harvest together with six other shares in Norwegian fisheries.

Risks: The aforementioned products do not have capital protection. Should the underlying assets deliver a negative performance, the ETT and PERLES will incur commensurate losses. Investors in structured products are also exposed to issuer risk, which means that the capital invested may be lost if UBS AG becomes insolvent, regardless of the performance of the underlying.

More UBS products and further information on the risks and opportunities are available at ubs.com/keyinvest.

MSCI™ Daily TR Net Norway USD Index 5 years¹

The MSCI™ Daily Norway Index has been trending upwards since the beginning of 2016. At the end of September, the benchmark climbed to its highest level in around four years.

Source: UBS AG, Bloomberg

As of 14.11.2018

Marine Harvest vs. SalMar vs. Leroy Seafood 5 years¹

Marine Harvest, SalMar and Leroy Seafood are the three largest members of the Norway Fish Equity Basket in terms of market value. In recent years, the trio has made impressive gains.

Source: UBS AG, Bloomberg

As of: 14.11.2018

¹) Please be aware that past performance does not indicate future results.
²) The conditions of ETTs are reviewed on a yearly basis and can be adjusted with a deadline of 13 months after the announcement.

ETT on MSCI™ Daily TR Net Norway USD Index

Symbol ETLNO
SVSP Name Tracker Certifikat
SPVSP Code 1300
Underlying MSCI™ Daily TR Net Norway USD Index 
Currency USD
Ratio 100:1
Administration fee 0.00% p.a.²
Participation 100%
Expiry Open End
Issuer UBS AG, London
Bid/Ask USD 85.00 / 85.45
 

PERLES on Norway Fish Equity Basket

Symbol REUFIU
SVSP Name Tracker Certifikat
SPVSP Code 1300
Underlying Norway Fish Equity Basket
Currency NOK
Ratio 1:1
Participation 100%
Expiry 03.06.2019
Issuer UBS AG, London
Bid/Ask NOK 1’569.00 / 1’585.00 
 

More UBS products and further information on the risks and opportunities are available at ubs.com/keyinvest.

Source: UBS AG, Bloomberg

As of: 14.11.2018

Market overview

Index Quotation Week¹
SMI™ 8’931.20 -1.3%
SLI™ 1’392.78 -2.3%
S&P 500™ 2’701.58 -4.0%
Euro STOXX 50™ 3’205.36 -1.3%
S&P™ BRIC 40 3’812.92 -3.6%
CMCI™ Compos. 907.58 -2.2%
Gold (troy ounce) 1’210.10 USD -1.5%

¹ Change based on the closing price of the previous day compared to the closing price a week ago.

SMI™ vs. VSMI™ 1 year

smi vs vsmi

The VSMI™ Index is calculated since 2005. It shows the volatility of the stocks within the SMI™ index. A portfolio which reacts only to changes in volatility instead of volatility itself is relevant for the calculation. Thereby, the VSMI™ methodology uses the squared volatility, known as variance, of the SMI options with remaining time to expiry of 30 days traded at the Eurex.

Source: UBS AG, Bloomberg

As of: 14.11.2018

General Motors / Ford
Car manufacturers with strong figures

In the car world, off-road vehicles are currently all the rage. This can also be seen in the US registration figures for October. Let’s take Ford as an example – while sales of sedans seemed to be reversing out of the parking lot, SUVs recorded double-digit sales growth and over 70,000 F-Series vehicles were sold for the eighth month in a row. Business at General Motors (GM) is also flourishing thanks to SUVs. In the third quarter, the high-priced models caused operating profits to jump by 25%. Stock exchange speculators are clapping their hands with glee at the moment, as both shares have achieved double-digit percentage growth in the past four weeks.¹ The new Worst of Kick-In GOAL (symbol: KCVNDU) on the two automotive companies does not require the growth in share prices to pick up any further. The product offers an annual coupon of 10% and a risk buffer of 40% should the prices move sideways.

Not only did GM record greater earnings than expected in the third quarter, but the car manufacturer also narrowed its annual targets. The upper end of the USD 5.80 to 6.20 range for adjusted pre-tax earnings per share is now expected to be achieved in 2018. To ensure that the Group can continue making such high profits in the future, cuts are being made, with 18,000 of the 50,000 employees in North America having recently received a severance offer. As revealed in Ford’s latest quarterly report, the car manufacturer has also outperformed market forecasts. The company is still in the midst of a corporate restructuring, but this should pay off soon. Chief Financial Officer Bob Shanks confirmed the pre-tax margin target of 8% when presenting the quarterly figures. However, this will probably not be possible by 2020 as was announced. In addition, the company is investigating the opportunities presented by “the car of the future”. According to a media report, Ford is currently in discussions with VW to work together on the costly development of autonomous driving technology and electric cars. Although nothing has yet been decided, a Ford spokesman stated that the US group’s letter of intent with VW included discussions on potential collaborations in a number of areas. (Source: Thomson Reuters media report, October 31, 2018).

Opportunities: In order to generate a profit with the Worst of Kick-In GOAL (Symbol: KCVNDU), the share prices of Ford and GM only need to trend sideways. The product in subscription pays an annual coupon of 10% regardless of price performance. The repayment of the nominal is, however, linked to the underlyings. If none of the shares fall level with or below the barrier of 60% of the initial fixings, investors will remain safe from losses.

Risks: Worst-of Kick-In GOALs do not have capital protection. If the underlyings of the Kick-In GOAL touch or fall below the respective Kick-In Level (barrier), the amount repaid on the maturity date is reflecting the worst performance of the underlyings (but not more than notional value plus coupon). In this case, it is likely that losses will be incurred. Investors in structured products are also exposed to issuer risk, which means that the capital invested may be lost if UBS AG becomes insolvent, regardless of the performance of the underlying.

More UBS products and further information on the risks and opportunities are available at ubs.com/keyinvest.

General Motors vs. Ford Motor 5 years¹

Source: UBS AG, Bloomberg

As of: 14.11.2018

10.00% p.a. Worst of Kick-In GOAL on General Motors / Ford

Symbol KCVNDU
SVSP Name Barrier Reverse Convertible
SPVSP Code 1230
Underlyings General Motors / Ford
Currency USD
Coupon 10.00% p.a.
Kick-In Level 60.00%
Expiry 21.11.2019
Issuer UBS AG, London
Subscription until 21.11.2018, 15:00 h
 

More UBS products and further information on the risks and opportunities are available at ubs.com/keyinvest.

Source: UBS AG, Bloomberg

As of: 14.11.2018

¹) Please be aware that past performance does not indicate future results.
²) The conditions of ETTs are reviewed on a yearly basis and can be adjusted with a deadline of 13 months after the announcement.

This material has been prepared by UBS AG or one of its affiliates («UBS»). This material is for distribution only as permitted by law. It is not prepared for the needs of any specific recipient. It is published solely for information and is not a solicitation or offer to buy or sell any securities or related financial instruments (“Instruments”). UBS makes no representation or warranty, either express or implied, on the completeness or reliability of the information contained in this document (“Information”) except that concerning UBS AG and its affiliates. The Information should not be regarded by recipients as a substitute for using their own judgment. Any opinions expressed in this material may change without notice and may be contrary to opinions expressed by other business areas of UBS as a result of using different assumptions or criteria. UBS is under no obligation to update the Information. UBS, its officers, employees or clients may have or have had an interest in the Instruments and may at any time transact in them. UBS may have or have had a relationship with entities referred to in the Information. Neither UBS nor any of its affiliates, or their officers or employees, accepts any liability for any loss arising from use of the Information. This presentation is not a basis for entering into a transaction. Any transaction between you and UBS will be subject to the detailed provisions of the term sheet, confirmation or electronic matching systems relating to that transaction. Clients wishing to effect transactions should contact their local sales representative.
This information is communicated by UBS AG and/or its affiliates («UBS»). * (see below) UBS may from time to time, as principal or agent, have positions in, or may buy or sell, or make a market in any securities, currencies, financial instruments or other assets underlying the product to which this website relates (the «Structured Product»). UBS may provide investment banking and other services to and/or have officers who serve as directors of the companies referred to in this website. UBS’s trading and/or hedging activities related to the Structured Product may have an impact on the price of the underlying asset and may affect the likelihood that any relevant barrier or relevant trigger event is crossed or triggered. UBS has policies and procedures designed to minimise the risk that officers and employees are influenced by any conflicting interest or duty and that confidential information is improperly disclosed or made available. UBS may pay or receive brokerage or retrocession fees in connection with the Structured Product described herein. In respect of any Structured Product that is a security, UBS may, in certain circumstances, sell the Structured Product to dealers and other financial institutions at a discount to the issue price or rebate to them for their own account some proportion of the issue price. Further information is available on request. Structured Products are complex and may involve a high risk of loss. Prior to purchasing the Structured Product you should consult with your own legal, regulatory, tax, financial and accounting advisors to the extent you consider it necessary, and make your own investment, hedging and trading decisions (including decisions regarding the suitability of the Structured Product) based upon your own judgement and advice from those advisers you consider necessary. Save as otherwise expressly agreed in writing, UBS is not acting as your financial adviser or fiduciary in relation to the Product. UBS generally hedges its exposure to Structured Products, although it may elect not to hedge or to partially hedge any Structured Product. UBS’s hedging activity may be conducted through transactions in the underlying asset, index or instrument or in options, futures or other derivatives related to the underlying asset, index or instrument on publicly traded markets or otherwise, and may have an impact on the price of the under-lying asset. If a transaction is cash settled, UBS will generally unwind or offset any hedge it has for such Structured Product in close proximity to the relevant valuation time or period. In some cases, this activity may affect the value of the Structured Product. Unless stated otherwise in this document, (i) this document is for information purposes only and should not be construed as an offer, personal recommendation or solicitation to purchase the Structured Product and should not be treated as giving investment advice, and (ii) the terms of any investment in the Structured Product will be exclusively subject to the detailed provisions, including risk considerations, contained in the more detailed legal documentation that relates to the Structured Product (being the confirmation, information memorandum, prospectus or other issuer documentation as relevant). UBS makes no representation or warranty relating to any information herein which is derived from independent sources. This document shall not be copied or reproduced without UBS’s prior written permission. In respect of any Structured Product that is a security, no action has been or will be taken in any jurisdiction that would permit a public offering of the Product, save where explicitly stated in the issuer documentation. The Structured Product must be sold in accordance with all applicable selling restrictions in the jurisdictions in which it is sold.
© UBS 2018. All rights reserved. UBS prohibits the forwarding of this information without the approval of UBS.
Weekly-Hits edition of 16.11.20182018-11-16T09:00:48+01:00

Weekly-Hits Ausgabe vom 15.11.2018


KeyInvest Weekly Hits
Donnerstag, 15.11.2018
  • Thema 1: Norwegen – Aufschwung im hohen Norden
  • Thema 2: General Motors / Ford – Autobauer mit starken Zahlen

Norwegen
Aufschwung im hohen Norden

Der Ölsektor hat einen massgeblichen Anteil am derzeitigen Aufschwung in Norwegen. Gleichzeitig profitiert das skandinavische Land von florierenden Geschäften der Fischereiindustrie. Alles in allem könnte das Bruttoinlandsprodukt in Norwegen laut den aktuellen Prognosen des Internationalen Währungsfonds (IWF) 2018 zum ersten Mal seit 2012 um mehr als zwei Prozent wachsen. Der ETT (Symbol: ETLNO) auf den MSCI™ Daily TR Net Norway Index macht eine diversifizierte Aktienmarkt-Positionierung in dieser kleinen Volkswirtschaft möglich. Mit PERLES (Symbol: REUFIU) auf das Norway Fish Equity Basket können Anleger gezielt auf den zweitgrössten Exportsektor des Landes setzen.

Atemberaubende Fjorde, riesige Gletscher, malerische Dörfer und moderne Städte – mit solchen Sehenswürdigkeiten lockt Norwegen Jahr für Jahr Millionen Touristen. Auch für Investoren hat das Land im hohen Norden seinen Reiz. Zwar trat der MSCI™ Daily TR Net Norway Index im bisherigen Jahresverlauf mehr oder weniger auf der Stelle. Damit hebt sich die Osloer Börse jedoch deutlich von einem von roten Vorzeichen dominierten europäischen Aktienmarkt ab.¹ Getragen wurde die Outperformance Norwegens von der Ölindustrie. In diesem Sektor ist mit Equinor das mit Abstand grösste Unternehmen des Landes beheimatet. Gerade hat der in mehr als 30 Ländern aktive Energiemulti die Zahlen für die ersten neun Monate 2018 publiziert. Der Zwischenbericht zeigt, wie die in diesem Zeitraum gestiegenen Ölpreise positiv auf das Ergebnis durchschlagen. Mit 13.4 Milliarden US-Dollar lag das operative Ergebnis von Januar bis September um 56 Prozent über dem Vorjahreswert. Beim operativen Cashflow hatte Equinor nach neun Monaten mit 15.5 Milliarden US-Dollar bereits den Wert des Gesamtjahres 2017 übertroffen. (Quelle: Equinor Finanzbericht 3. Quartal 2018)
 
Florierende Geschäfte erlebte zuletzt auch die norwegische Fischereiindustrie. Der zweitwichtigste Exportsektor des Landes profitiert von einem sich wandelnden Ernährungsverhalten. Vor allem der Zuchtlachs trifft den Geschmack von immer mehr Konsumenten. Allein im August exportierte Norwegen 100’000 Tonnen des Fisches mit dem typisch rosafarbenen Fleisch – ein neuer Rekord für den Sommermonat. In den ersten acht Monaten des Jahres steigerten die Skandinavier das Volumen der insgesamt exportierten Meeresfrüchte um elf Prozent auf 1.8 Millionen Tonnen. (Quelle: Norwegian Seafood Council Medienmitteilung, 18.10.2018) Vor diesem Hintergrund überrascht es nicht, dass die Aktie von Marine Harvest auf Rekordniveau notiert.¹ Zumal der weltgrösste Lachszüchter die Erwartungen im dritten Quartal sowohl bei den Volumen als auch dem Ergebnis übertroffen hat. (Quelle: Thomson Reuters, Medienbericht, 15.10.2018)    


Chancen:
Equinor und Marine Harvest zählen zu den Schwergewichten im MSCI Daily TR Net Norway Index. Neben dem vorgestellten Duo sind acht weitere Aktien in der Benchmark enthalten. Damit deckt der Gradmesser nach Angaben des Indexanbieters MSCI rund 85 Prozent der freefloat-adjustieren Marktkapitalisierung des skandinavischen Landes ab. Der ETT (Symbol: ETLNO) folgt dem Index im Bezugsverhältnis 100:1. Typisch für diese Produktstruktur fallen keine laufenden Verwaltungsgebühren an.² Dividendenzahlungen der enthaltenen Unternehmen werden netto in den Index reinvestiert. Im Juni 2017 hat UBS den PERLES (Symbol: REUFIU) auf den Norway Fish Equity Basket lanciert. Mittlerweile notiert das auf Norwegische Kronen lautende Partizipationsprodukt 63 Prozent über dem Emissionspreis. Im Basket ist der Branchenprimus Marine Harvest zusammen mit sechs weiteren Fischereiaktien aus Norwegen enthalten.

Risiken:
Die vorgestellten Produkte sind nicht kapitalgeschützt. Eine negative Entwicklung beim Basiswert führt zu entsprechenden Verlusten bei ETT und PERLES. Zudem trägt der Anleger bei strukturierten Produkten das Emittentenrisiko, so dass das eingesetzte Kapital – unabhängig von der Entwicklung des Basiswertes – im Falle einer Insolvenz der UBS AG verloren gehen kann.

Weitere UBS Produkte sowie Informationen zu Chancen und Risiken finden Sie unter ubs.com/keyinvest.
 
 
MSCI™ Daily TR Net Norway USD Index 5 Jahre¹
Seit Anfang 2016 bewegt sich der MSCI™ Daily Norway Index in einem übergeordneten Aufwärtstrend. Ende September kletterte der Benchmark dabei auf das höchste Niveau seit rund vier Jahren.
 
Quelle: UBS AG, Bloomberg
Stand: 14.11.2018

Marine Harvest vs. SalMar vs. Leroy Seafood 5 Jahre¹
Gemessen am Börsenwert sind Marine Harvest, SalMar und Leroy Seafood die drei grössten Mitglieder im Norway Fish Equity Basket. In den vergangenen Jahren verbuchte das Trio stattliche Kursgewinne.
 
Quelle: UBS AG, Bloomberg
Stand: 14.11.2018

 
¹) Bitte beachten Sie, dass vergangene Wertentwicklungen keine Indikationen für künftige Wertentwicklungen sind.
²) Die Konditionen der ETTs werden jährlich überprüft und können mit einer Frist von 13 Monaten nach Bekanntgabe angepasst werden
 
ETT auf den MSCI™ Daily TR Net Norway USD Index

Symbol ETLNO
SVSP Name Tracker-Zertifikat
SPVSP Code 1300
Basiswert MSCI™ Daily TR Net Norway USD Index 
Bezugsverhältnis 100:1
Handelswährung USD
Verwaltungsgebühr 0.00% p.a.²
Partizipation 100%
Verfall Open End
Emittentin UBS AG, London
Geld-/Briefkurs USD 85.00 / 85.45
 

PERLES auf den Norway Fish Equity Basket

Symbol REUFIU
SVSP Name Tracker-Zertifikat
SPVSP Code 1300
Basiswerte Norway Fish Equity Basket
Bezugsverhältnis 1:1
Handelswährung NOK
Partizipation 100%
Verfall 03.06.2019
Emittentin UBS AG, London
Geld-/Briefkurs NOK 1’569.00 / 1’585.00 
 

Weitere Produkte sowie Informationen zu Chancen und Risiken finden Sie unter: ubs.com/keyinvest Quelle: UBS AG, Bloomberg Stand: 14.11.2018
 
Marktübersicht
Index Stand Woche¹
SMI™ 8’931.20 Pkt. -1.3%
SLI™ 1’392.78 Pkt. -2.3%
S&P 500™ 2’701.58 Pkt. -4.0%
EURO STOXX 50™ 3’205.36 Pkt. -1.3%
S&P™ BRIC 40 3’812.92 Pkt. -3.6%
CMCI™ Compos. 907.58 Pkt. -2.2%
Gold (Feinunze) 1’210.10 USD -1.5%

SMI™ vs. VSMI™ 1 Jahr

 
¹ Veränderung auf Basis des Schlusskurses des Vortages im Vergleich zum Schlusskurs vor einer Woche.
Der VSMI™ Index wird seit 2005 berechnet. Er zeigt die Volatilität der im SMI™ Index enthaltenen Aktien. Massgeblich für die Berechnung ist ein Portfolio, welches nicht auf Preisschwankungen, sondern ausschliesslich auf Veränderungen der Volatilität reagiert. Dabei greift die VSMI™ Methodik auf die quadrierten Volatilitäten, im Fachjargon „Varianzen“, der an der Eurex gehandelten SMI-Optionen mit einer konstanten Restlaufzeit von 30 Tagen zurück.


General Motors / Ford
Autobauer mit starken Zahlen

 
In der Autowelt geben derzeit die Geländewagen den Ton an. Dies lässt sich auch an den US-Zulassungszahlen für den Oktober ablesen. Zum Beispiel bei Ford: Während die Limousinen den Rückwärtsgang einlegten, verzeichneten die sogenannten SUVs ein zweistelliges Absatzwachstum und die F-Serie überschritt den achten Monat in Folge die Marke von 70’000 verkauften Fahrzeugen. Auch bei General Motors (GM) florieren dank der SUVs die Geschäfte. Die hochpreisigen Modelle sorgten im dritten Quartal für einen operativen Gewinnsprung um ein Viertel. Börsianer klatschen Beifall: Beide Aktien legten in den vergangenen vier Wochen prozentual zweistellig zu.¹ Der neue Worst of Kick-In GOAL (Symbol: KCVNDU) auf das Auto-Duo kommt ohne weitere Kursbeschleunigungen aus. Das Produkt bietet bei einer Seitwärtsfahrt einen Coupon von 10.00 Prozent p.a. sowie einen Risikopuffer von 40 Prozent.
 
Nicht nur, dass GM im dritten Quartal mehr verdiente als erwartet, auch engte der Autobauer seine Jahresziele ein. 2018 soll nun das obere Ende der Spanne von 5.80 bis 6.20 US-Dollar beim bereinigten Vorsteuerergebnis je Aktie erreicht werden. Damit der Gewinnmotor auch in Zukunft hoch dreht, setzt der Konzern den Rotstift an. 18’000 von 50’000 Mitarbeitern in Nordamerika flatterte jüngst ein Abfindungsangebot ins Haus. Auch Ford konnte mit seinem jüngsten Zwischenbericht die Marktprognosen übertreffen. Noch steckt die Firma zwar inmitten eines Konzern-Umbaus, doch soll sich dieser bald bezahlt machen. Finanzchef Bob Shanks bekräftigte bei der Vorlage der Quartalszahlen das Ziel einer Vorsteuer-Marge von acht Prozent. Allerdings wird dies wohl nicht wie angekündigt bereits bis 2020 gelingen. Zudem streckt die Firma ihre Fühler in Richtung «Auto der Zukunft» aus. Einem Medienbericht zufolge spricht Ford derzeit mit VW, um bei der kostspieligen Entwicklung autonomer Fahrtechnik und E-Autos zusammenzuarbeiten. Noch ist zwar nichts entschieden, doch erklärte ein Ford-Sprecher, dass die Absichtsvereinbarung des US-Konzerns mit VW Gespräche über mögliche Kooperationen in einer Reihe von Bereichen umfasse. (Quelle: Thomson Reuters Medienbericht, 31. Oktober 2018)
 

Chancen:
Um mit dem Worst of Kick-In GOAL (Symbol: KCVNDU) gewinnbringend ans Ziel zu kommen, reicht eine Seitwärtsfahrt von Ford und GM aus. Das in Zeichnung stehende Produkt wirft – unabhängig vom Kursverlauf – einen Coupon von 10.00 Prozent p.a. ab. Die Rückzahlung des Nominal ist dagegen an die Basiswerte gekoppelt. Solange keine Aktie auf oder unter die Barriere von 60 Prozent des Startniveaus fällt, sind keine Abschläge zu befürchten.

Risiken:
Kick-In GOALs sind nicht kapitalgeschützt. Notiert einer der Basiswerte während der Laufzeit einmal auf oder unter dem jeweiligen Kick-In Level (Barriere), kann die Tilgung am Verfalltag durch Bartilgung entsprechend der (vom Strike aus) schwächsten Performance aus dem Duo erfolgen (höchstens jedoch zum Nominalwert zuzüglich Coupon). In diesem Fall sind Verluste wahrscheinlich. Zudem trägt der Anleger bei Strukturierten Produkten das Emittentenrisiko, so dass das eingesetzte Kapital – unabhängig von der Entwicklung des Basiswertes – im Falle einer Insolvenz der UBS AG verloren gehen kann.
Weitere UBS Produkte sowie Informationen zu Chancen und Risiken finden Sie unter ubs.com/keyinvest.
 
General Motors vs. Ford Motor 5 Jahre¹
Quelle: UBS AGStand: 14.11.2018

 
10.00% p.a. Worst of Kick-In GOAL auf General Motors / Ford
Symbol KCVNDU
SVSP Name Barrier Reverse Convertible
SPVSP Code 1230
Basiswerte General Motors / Ford
Handelswährung USD
Coupon 10.00% p.a.
Kick-In Level (Barriere) 60.00%
Verfall 21.11.2019
Emittentin UBS AG, London
Zeichnung bis 21.11.2018, 15:00 Uhr
 

Termsheet Weitere Produkte sowie Informationen zu Chancen und Risiken finden Sie unter: ubs.com/keyinvest   Quelle: UBS AG Stand: 14.11.2018

 
¹) Bitte beachten Sie, dass vergangene Wertentwicklungen keine Indikationen für künftige Wertentwicklungen sind.
²) Die Konditionen der ETTs werden jährlich überprüft und können mit einer Frist von 13 Monaten nach Bekanntgabe angepasst werden


Die in diesem Dokument enthaltenen Informationen werden ausschliesslich zu Informations- und Werbezwecken zur Verfügung gestellt und stellen weder Empfehlungen noch Anlageberatung von UBS AG, einer ihrer Tochtergesellschaften oder verbundenen Unternehmen («UBS») dar. Dieses Dokument wird nicht von einer UBS Research Abteilung ausgegeben und ist deshalb nicht als unabhängige Anlageforschung zu erachten. Es stellt weder einen Verkaufsprospekt, noch ein Angebot oder eine Einladung zur Offertenstellung dar, irgendeine Art von Anlage zu tätigen. Beachten Sie bitte, dass die Anlagebeispiele die Ansichten von UBS Research möglicherweise nicht vollständig wiedergeben. Dieses Dokument und die darin beschriebenen Produkte und Dienstleistungen sind allgemeiner Natur und beziehen sich weder auf die persönlichen Anlageziele noch die finanzielle Situation oder besonderen Bedürfnisse eines spezifischen Empfängers. Anlageentscheide sollten stets im Portfoliokontext getroffen werden und Ihre persönliche Situation und Ihre entsprechende Risikobereitschaft und Risikofähigkeit berücksichtigen. Sie werden hiermit auf diese Risiken (die mitunter erheblich sein können) hingewiesen. Bevor Sie einen Anlageentscheid treffen, lesen Sie bitte die spezifischen Produkteinformationen und die Broschüre «Besondere Risiken im Effektenhandel». Bitte kontaktieren Sie Ihren Kundenberater, der Sie gerne bei Ihren Anlageideen unterstützt und Ihnen die spezifischen Produktinformationen zur Verfügung stellt. UBS übernimmt diesbezüglich keinerlei Haftung für das Verhalten von Dritten. Wir weisen Sie darauf hin, dass sich UBS das Recht vorbehält, Dienstleistungen, Produkte und Preise jederzeit ohne vorhergehende Ankündigung zu ändern, und dass sich die wiedergegebenen Informationen und Meinungen jederzeit ändern können. Es wird weder eine ausdrückliche noch stillschweigende Gewährleistung oder Garantie in Bezug auf die Richtigkeit, Vollständigkeit oder Verlässlichkeit der wiedergegebenen Informationen abgegeben, es sei denn, es handelt sich um Informationen, die sich auf die UBS AG beziehen. Zudem stellt dieses Dokument keine umfassende Beschreibung oder Zusammenfassung der genannten Märkte und Entwicklungen dar. Gewisse Zahlen beziehen sich auf vergangene Wertentwicklungen oder stellen simulierte Wertentwicklungen dar und sind somit keine zuverlässigen Indikatoren für künftige Ergebnisse. Bei einigen Zahlen handelt es sich möglicherweise lediglich um Prognosen, und Prognosen sind kein zuverlässiger Indikator für zukünftige Entwicklungen. Gewisse Diagramme und/oder Darstellungen von Wertentwicklungen basieren möglicherweise nicht auf 12-Monate-Perioden, was ihre Vergleichbarkeit und Aussagekraft reduziert. Wechselkurse können sich negativ auf den Wert, den Preis oder die Einnahmen von Produkten und Dienstleistungen auswirken, die in den Materialien genannt werden. Gebühren sind möglicherweise nicht enthalten und reduzieren die Wertentwicklung entsprechend. Die steuerliche Behandlung hängt von den individuellen Umständen jedes Kunden ab und kann sich in Zukunft ändern. UBS erbringt keine Rechts- oder Steuerberatungsdienste und gibt weder allgemeine noch auf die spezifischen Umstände und Bedürfnisse eines Kunden bezogene Erklärungen im Hinblick auf die steuerliche Behandlung von Anlagen oder der damit verbundenen Anlagerenditen ab. Die Empfänger sollten eine unabhängige rechtliche und steuerliche Beratung im Hinblick auf die Auswirkungen der Produkte/Dienstleistungen in der jeweiligen Rechtsordnung sowie die Eignung der Produkte und Dienstleistungen in Anspruch nehmen. UBS, ihre Verwaltungsräte, Geschäftsführer und Mitarbeiter oder Kunden halten oder hielten möglicherweise Anteile oder Hausse- und Baisse-Positionen («Longoder Short-Positionen») an den hierin genannten Wertpapieren oder sonstigen Finanzinstrumenten und können jederzeit als Auftraggeber oder Beauftrage Käufe und/oder Verkäufe tätigen. UBS fungiert oder fungierte möglicherweise als Marktmacher («Market-Maker») bei den Wertpapieren oder sonstigen Finanzinstrumenten. Des Weiteren unterhält oder unterhielt UBS möglicherweise eine Geschäftsbeziehung mit oder erbringt oder erbrachte Investmentbanking-, Kapitalmarktdienstleistungen und/oder sonstige Finanzdienstleistungen für die jeweiligen Unternehmen. Dieses Dokument und die darin enthaltenen Informationen sind ausschliesslich für Personen mit Domizil Schweiz gedacht. Sie dürfen unter keinen Umständen in Rechtsordnungen verbreitet werden, in denen eine solche Verbreitung gegen geltende Gesetze oder Regulierungen verstösst. Sie dürfen insbesondere nicht in den USA und/oder an USPersonen oder in Rechtsordnungen verteilt werden, in denen der Vertrieb durch uns eingeschränkt ist.Die im Dokument enthaltenen Informationen stammen, sofern nicht anders angegeben, von UBS. UBS übernimmt keine Gewährleistung (weder ausdrücklich noch stillschweigend) für Richtigkeit, Vollständigkeit und Aktualität der Informationen. Sie können jederzeit und ohne vorherige Ankündigung geändert werden. UBS ist nicht verpflichtet, die hierin enthaltenen Informationen zu aktualisieren oder auf dem neuesten Stand zu halten.Das vorliegende Material beinhaltet Daten, welche aus dem Backtesting von Daten resultieren, und wurde von UBS in gutem Glauben und unter Anwendung standardisierter Methoden erstellt. Diese Methoden basieren auf eigenen Modellen, empirischen Daten, Annahmen und anderen Informationen, die wir für korrekt und angemessen erachten. Gewisse Links führen zu Websites Dritter. Diese sind dem Einfluss der UBS vollständig entzogen, weshalb UBS für Richtigkeit, Vollständigkeit und Rechtmässigkeit des Inhalts solcher Websites sowie für darauf enthaltene Angebote und (Dienst-) Leistungen keinerlei Verantwortung übernimmt.Für gewisse Dienstleistungen und Produkte gelten gesetzliche Bestimmungen. Diese Dienstleistungen und Produkte können daher nicht weltweit uneingeschränkt angeboten werden.Hinweise zu den Grafiken: Nur für Illustrationszwecke. Vergangene Performance ist kein zuverlässiger Indikator für die künftige Performance. © UBS 2017. Das Schlüsselsymbol und UBS gehören zu den eingetragenen und nicht eingetragenen Markenzeichen von UBS. Alle Rechte bleiben vorbehalten.  Der SMI™ Index sowie entsprechende Marken und der SLI™ Index sowie entsprechende Marken und der der Swiss Performance Index™ Index (SPITM) sowie entsprechende Marken und der VSMI™ sowie entsprechende Marken sind Eigentum der SIX Swiss Exchange AG. Alle Rechte vorbehalten. Der S&P 500™ Index sowie entsprechende Marken und der S&P 500 Industrials Index™ sowie entsprechende Marken sind Eigentum der Standard & Poor›s Financial Services LLC. Alle Rechte vorbehalten. Der Euro STOXX 50™ Index sowie entsprechende Marken und der STOXX Europe 600 Banks Index sowie entsprechende Marken sind Eigentum der Stoxx AG. Alle Rechte vorbehalten. Der CMCI™ Composite Index sowie entsprechende Marken sind Eigentum der UBS AG. Alle Rechte vorbehalten. Der DAX™ Index sowie entsprechende Marken sind Eigentum der Deutsche Börse AG. Alle Rechte vorbehalten. Der JPM™ German Government Bond Index sowie entsprechende Marken sind Eigentum der JPM International Limited. Alle Rechte vorbehalten. Der NIKKEI 225™ Index sowie entsprechende Marken sind Eigentum der Nihon Keizai Shimbun Incorporation. Alle Rechte vorbehalten. Der EPRA Index™ sowie entsprechende Marken sind Eigentum der European Public Real Estate Association. Alle Rechte vorbehalten. Der FTSE™ Index sowie entsprechende Marken sind Eigentum der London Stock Exchange Group Holdings Limited. Alle Rechte vorbehalten. Der MSCI™ World Index sowie entsprechende Marken sind Eigentum der MSCI Incorporation. Alle Rechte vorbehalten. Der KOSPI™ Index sowie entsprechende Marken sind Eigentum der Korea Exchange Incorporation. Alle Rechte vorbehalten. Der HSCEI™ Index, der Hang Seng China EnterprisesTM Index sowie entsprechende Marken sind Eigentum der Hang Seng Data Services Limited. Alle Rechte vorbehalten.

Weekly-Hits Ausgabe vom 15.11.20182018-11-15T08:59:07+01:00

Weekly-Hits édition de 09.11.2018

KeyInvest Weekly Hits

Vendredi, 09.11.2018

  • Thème 1: Titres industriels européens - Un secteur aux multiples facettes
  • Thème 2: Henkel / Beiersdorf / L’Oréal - Au pouls des consommateurs

Titres industriels européens
Un secteur aux multiples facettes

UBS CIO GWM estime que les facteurs d’insécurité géopolitiques sont les principaux responsables de la faiblesse actuelle de l’évolution sur les marchés d’actions de l’Union monétaire européenne (UME). Considérant l’avenir, les experts conseillent une pondération neutre au sein des pays de la zone euro. S’agissant de l’allocation sectorielle, les actions industrielles sont surpondérées. L’ETT (symbole : ETIND) sur le STOXX™ Europe 600 Industrial Goods & Services permet l’orientation correspondante. Ce produit Open End participe intégralement à l’évolution de l’indice des secteurs. En revanche, l’Early Redemption (ER) Worst of Kick-In GOAL (symbole : KCUGDU) vise une évolution relativement stable d’Alstom, Siemens et thyssenkrupp. Tant qu’aucune des trois valeurs industrielles n’atteindra ou ne passera en-dessous de la barrière de 59% des cours initiaux, les investisseurs toucheront un rendement maximal de 7.00% p.a. à l’échéance.

Bert Jansen, stratège chez UBS CIO GWM, constate que le dynamisme sectoriel a toujours, par le passé, été le principal moteur des marchés d’actions de la zone euro. Il aurait été plus important que les facteurs nationaux. Bert Jansen souligne que l’Italie fait exception à cette règle. A en croire le stratège, le marché d’actions de ce pays du sud de l’Europe est fortement orienté sur le secteur financier. En conséquence, le retour à une discipline budgétaire relativement laxiste pèse sur les cours. Dans la mesure où, désormais, beaucoup de l’ambiance négative a été intégré dans les cours, l’Italie se voit pondérer de manière neutre, tout comme les autres membres de l’euro dans l’allocation des pays. S’agissant des secteurs CIP GWM maintient pour la zone euro un mélange équilibré entre les secteurs cycliques et non cycliques. Les secteurs de l’énergie et de l’industrie sont surpondérés. (Source : UBS CIO GWM, UBS House View Weekly, Regional View Europe, 29.10.2018)

Bien naturellement, le secteur de l’industrie est particulièrement exposé au conflit commercial, facteur d’insécurité central dans l’année boursière 2018. Cela ne surprend donc pas que l’indice STOXX™ Europe 600 Industrial Goods & Services ait subi la vague de ventes en octobre. En revanche, fondamentalement, le secteur est encore sur le cours de la croissance. En dépit d’une tendance faiblissante, l’indice des directeurs d’achat établi par Markit par exemple s’est maintenu au-dessus du seuil d’expansion de 50 pour l’industrie en septembre. Outre la conjoncture mondiale solide, des mégatendances telles que la robotique et l’automatisation, l’efficience énergétique ou l’augmentation du trafic aérien devraient avantager le secteur.

Opportunités: avec l’Exchange Traded Tracker (ETT) (symbole : ETIND), les investisseurs peuvent se positionner de manière diversifiée. L’indice STOXX™ Europe 600 Industrial Goods & Services sous-jacent contient actuellement 100 entreprises. Pour la pondération, Siemens est en tête. Outre le groupe allemand, on trouve aussi Alstom sur la liste des « Most-Preferred » de CIO GWM pour les actions européennes. Avec thyssenkrupp, le duo constitue la base d’un nouveau ER Worst of Kick-In GOAL (symbole : KCUGDU). Les investisseurs peuvent compter sur un coupon ferme de 7.00% p.a. pour cette émission. L’opportunité de rendement est couplée à une marge de sécurité de 41%. Avec la fonction Early Redemption, les sous-jacents seront examinés pour la première fois le 14 novembre 2019. Si à cette date ou à l’un des autres jours d’observation trimestriels fixés le trio atteint ou dépasse la cours initial, les investisseurs se verront rembourser le nominal et le coupon correspondant par anticipation.

Risques: il n’existe aucune protection du capital pour les produits présentés. Une évolution négative de la valeur de base génère des pertes correspondantes pour l’ETT. Si, pendant la durée de l’investissement, un des sous-jacents du Worst of Kick-In GOAL atteint une seule fois sa barrière respective («Kick-In Level») ou est inférieur à celle-ci, et que la fonction de remboursement anticipé ne s’applique pas, le montant remboursé en espèces à maturité par amortissement est basé sur la performance la plus faible (base Strike) du trio (au maximum toutefois à la valeur nominale majorée du coupon). Dans un tel cas, des pertes sont probables. Par ailleurs, avec les produits structurés, l’investisseur supporte le risque d’émetteur. Cela signifie qu’en cas d’insolvabilité d’UBS SA, le capital investi peut être perdu, indépendamment de l’évolution du sous-jacent.

Vous trouverez davantage de produits UBS et des informations sur les opportunités et les risques à l’adresse ubs.com/keyinvest.

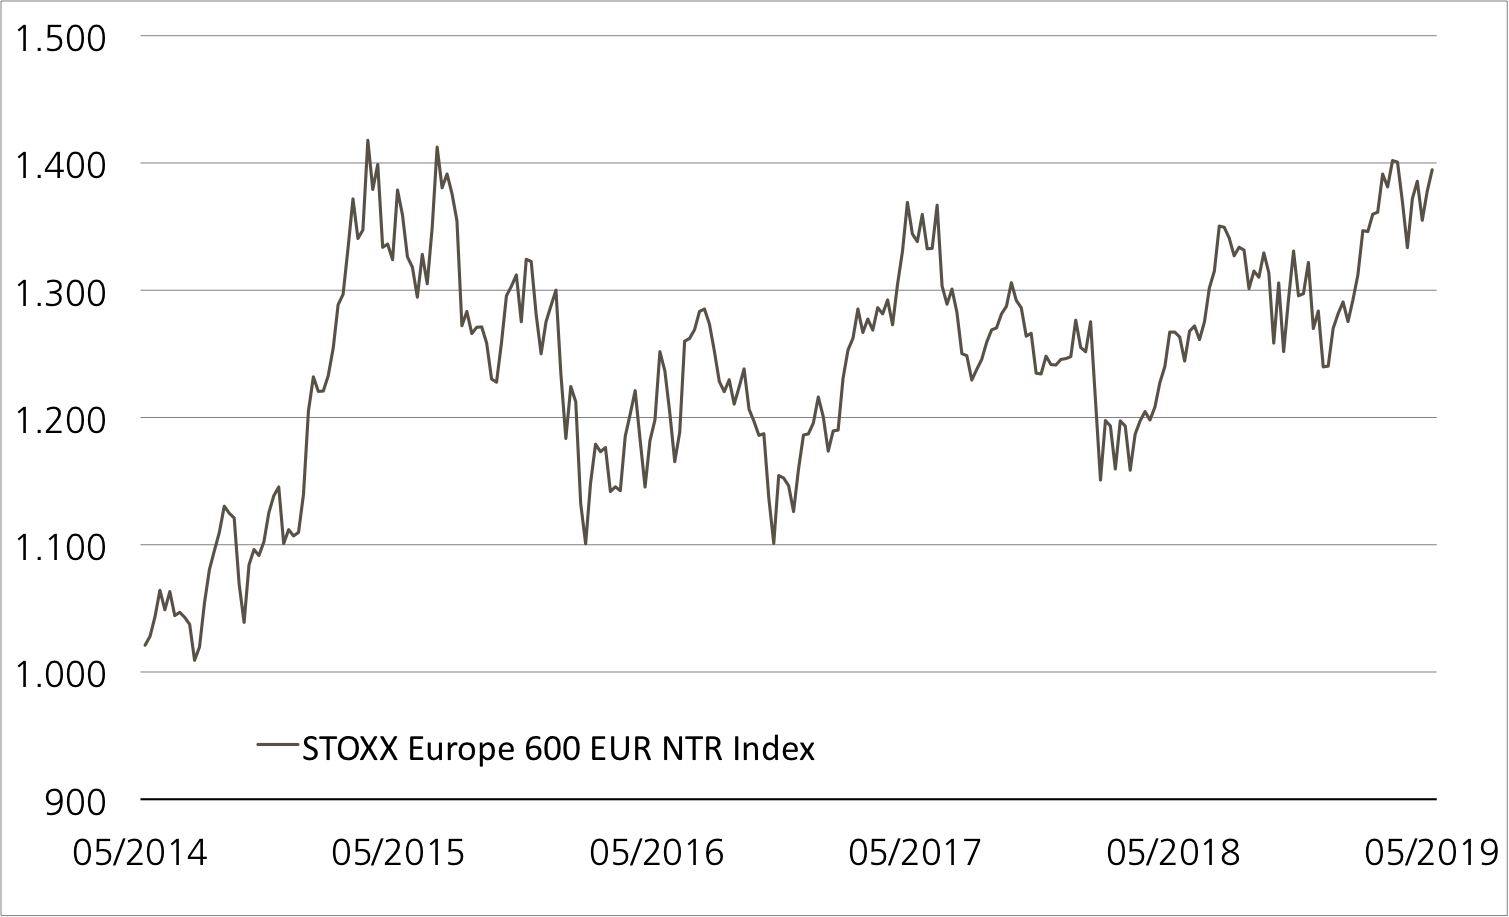
STOXX™ Europe 600 Industrial Goods & Services Index vs. STOXX™ Europe 600 Index 5 ans¹

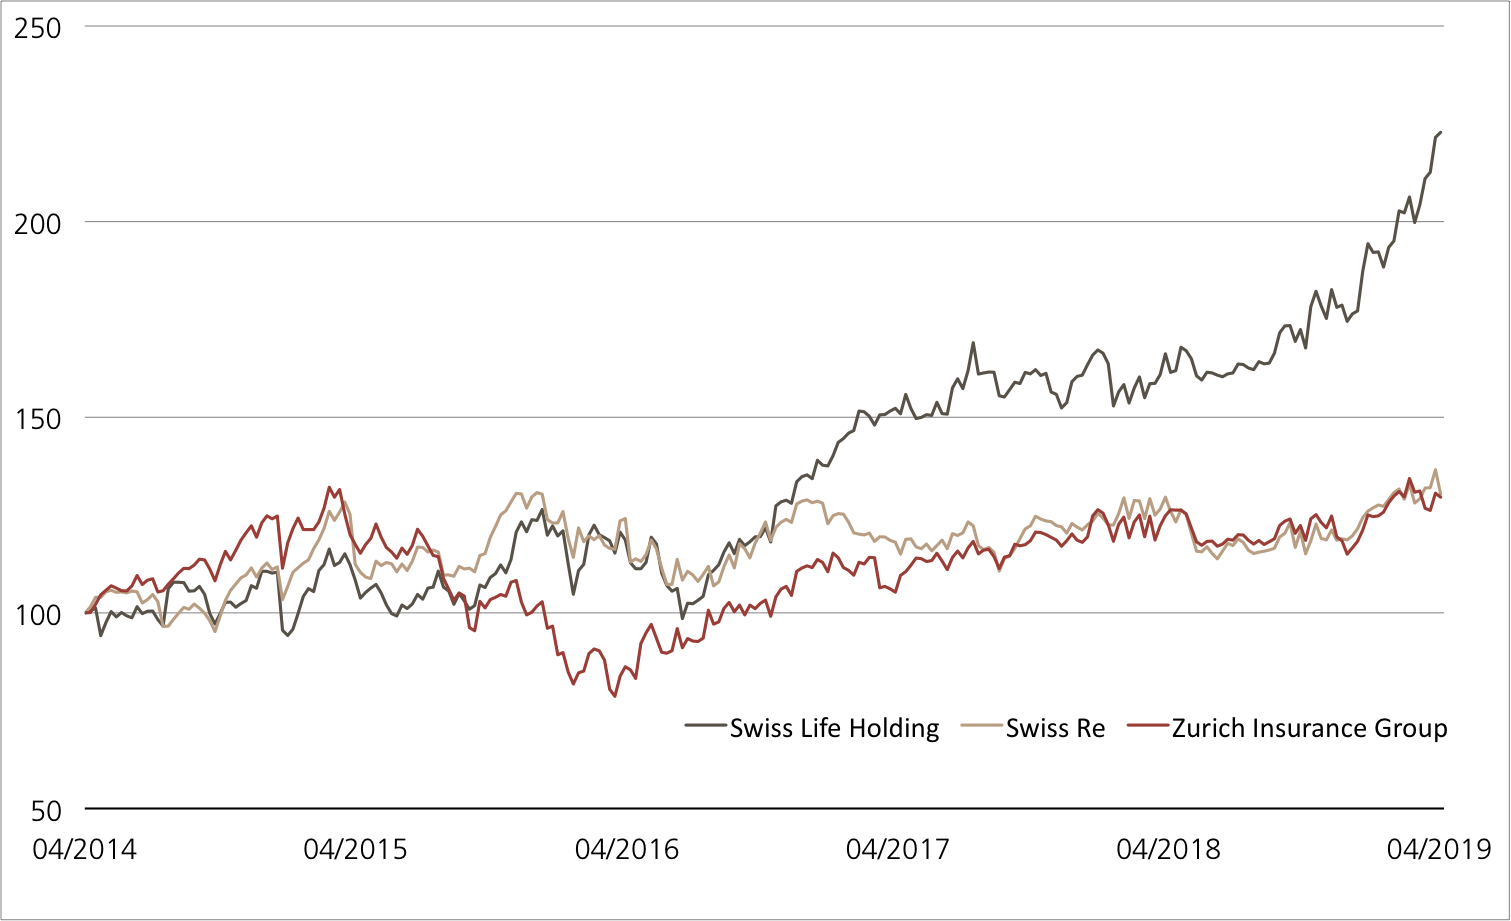
Après le récent recul, les actions industrielles européennes ont tout d’abord échoué à reprendre une hausse depuis leur évolution latérale. Toutefois, par rapport au marché en général, le secteur garde une longueur d’avance.

Source: UBS AG, Bloomberg

Valeurs du: 08.11.2018

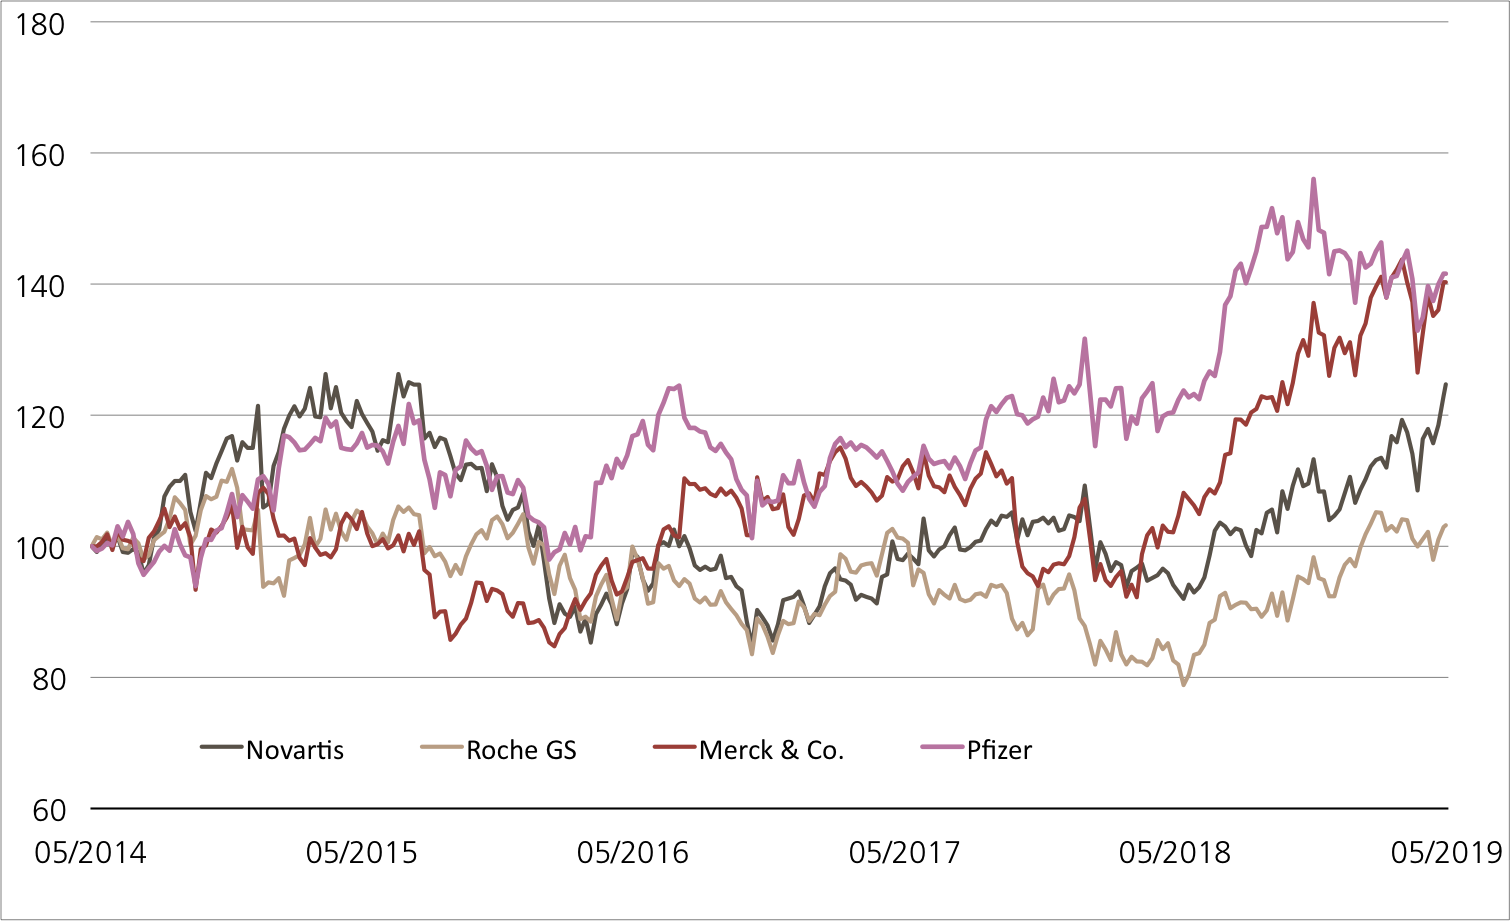
Alstom vs. Siemens vs. thyssenkrupp 5 ans¹

Alstom défie l’environnement boursier difficile. Grâce à sa récente surperformance, le titre industriel français a dépassé (évaluation sur cinq ans) les deux large caps allemandes Siemens et thyssenkrupp.

Source: UBS AG, Bloomberg

Valeurs du: 08.11.2018

¹) La performance passée n’indique pas les résultats futures.
²) Les condition des ETTs sont vérifiés annuellement et peuvent être ajustées avec un délai de 13 mois après la publication.
ETT sur STOXX™ Europe 600 Industrial Goods & Services NR Index

Symbol ETIND
SVSP Name Tracker Certifikat
SPVSP Code 1300
Sous-jacent STOXX™ Europe 600 Industrial Goods & Services Net Return Index
Devise EUR
Rapport de souscription 1:1
Frais de gestion 0.00% p.a.²
Participation 100%
Echéance Open End
Émetteur UBS AG, London
Bid/Ask EUR 922.50 / 927.50
 

7.00% p.a. ER Worst of Kick-In GOAL sur Alstom / Siemens / thyssenkrupp

Symbol KCUGDU)
SVSP Name Barrier Reverse Convertible
SPVSP Code 1230 (Auto-Callable)
Sous-jacent Alstom / Siemens / thyssenkrupp
Devise EUR
Coupon 7.00% p.a.
Kick-In Level 59.00%
Echéance 15.05.2020
Émetteur UBS AG, London
Date de fixation du prix 14.11.2018, 15:00 h
 

Vous trouverez davantage de produits UBS et des informations sur les opportunités et les risques à l’adresse ubs.com/keyinvest.

Source: UBS AG, Bloomberg

Valeurs du: 08.11.2018

Apérçu du marché

Index Citation Semaine¹
SMI™ 9’050.53 0.3%
SLI™ 1’425.81 0.4%
S&P 500™ 2’813.89 3.8%
Euro STOXX 50™ 3’246.66 1.5%
S&P™ BRIC 40 3’954.66 4.4%
CMCI™ Compos. 928.33 0.0%
Gold (once troy) 1’228.70 USD 1.1%

¹ Changement basé sur le cours de clôture du jour précédent par rapport au cours de clôture de la semaine dernière.

SMI™ vs. VSMI™ 1 année

L’index VSMI™ est calculé depuis 2005. Il affiche la volatilité des actions inclus dans le SMI™ index. Pour la calculation, un portefeuille est utilisé qui ne réagit qu’au variations de la volatilité au lieu des variations des prix. En le faisant, la méthodologie du VSMI™ utilise la volatilité carré, connu sous le terme variance, des options sur le SMI avec 30 jours jusqu’à l’échéance négociées à la Bourse Eurex.

Source: UBS AG, Bloomberg

Valeurs du: 08.11.2018

Henkel / Beiersdorf / L’Oréal
Au pouls des consommateurs

Quelques semaines à peine avant les ventes de Noël, les consommateurs du monde entier affichent des envies d’achat. Aux Etats-Unis, le moral des consommateurs a même atteint récemment son niveau le plus haut depuis le changement de siècle. Les indicateurs actuels devraient parfaitement convenir à Henkel, Beiersdorf et L’Oréal. UBS réunit ces trois fabricants renommés de biens de consommation comme sous-jacents pour une nouvelle émission. Le Callable Worst of Kick-In GOAL (symbole : KCUDDU) est doté d’un coupon de 6.00% p.a., alors que les barrières sont fixées à 60% des cours initiaux.

Les récents résultats de l’Oréal montrent qu’actuellement l’Asie est tout à fait en mode achat. Au deuxième trimestre 2018, le fabricant français de cosmétiques a enregistré une croissance similaire des chiffres d’affaires de 7.5%. L’entreprise a ainsi dépassé les attentes moyennes des analystes. En Asie, la demande a porté surtout sur des produits pour la peau, par exemple des crèmes anti-âge. Selon Jean-Paul Agon, CEO, le groupe connaît une rapide croissance, en particulier en Chine. Au Royaume de Milieu, le boom des produits de luxe se poursuit. L’Oréal est représenté dans cet important segment, notamment avec les produits de maquillage d’Yves Saint Laurent.

Le même jour que le Français, Beiersdorf a publié son rapport intermédiaire. Le groupe cosmétique a augmenté son chiffre d’affaires organique de 6% au cours des neuf premiers mois de l’année. Pour l’Allemand du nord également, le segment du luxe a été florissant, les chiffres de la marque La Prairie ont connu une poussée de 46,7% à la hausse. De plus, Beiersdorf a connu une nette croissance dans le secteur des adhésifs de la marque tesa. (Sources: Thomson Reuters, rapports de presse, 30.10.2018) Les produits adhésifs et d’étanchement font également partie des compétences clé de Henkel. En outre, cette entreprise du DAX™ est aussi active dans le domaine des soins corporels ainsi que des produits de lessive et de nettoyage. Les investisseurs découvriront le 15 novembre l’évolution des affaires de Henkel.

Opportunités: une évolution de cours globalement stable pour Henkel, Beiersdorf et L’Oréal suffit pour que le calcul d’investissement du Callable Worst of Kick-In GOAL (symbole : KCUDDU) fonctionne. Il est déterminant qu’aucune action du trio ne tombe au niveau de la barrière (basse) de 60% du cours initial ou ne passe en-dessous. Dans la mesure où le coupon de 6.00% p.a. sera versé quelle que soit la situation, à l’échéance, le rendement maximum sera alors atteint. Nous attirons votre attention sur le fait que l’émettrice dispose d’un droit de résiliation. Si elle en fait usage à l’une des dates prévues à cet effet, outre le nominal, le coupon au pro rata sera remboursé par anticipation.

Risques: les Worst of Kick-In GOALS ne bénéficient d’aucune protection du capital. Si, pendant la durée de l’investissement, l’un des sous-jacents atteint une seule fois la barrière respective («Kick-In Level») ou est inférieur à celle-ci, et que la fonction de Callable ne s’applique pas, le remboursement à l’échéance par remboursement en espèces est basé sur la performance la plus faible (base Strike) du trio (au maximum toutefois à la valeur nominale majorée du coupon). Dans un tel cas, des pertes sont probables. Par ailleurs, avec les produits structurés, l’investisseur supporte le risque d’émetteur. Cela signifie qu’en cas d’insolvabilité d’UBS SA, le capital investi peut être perdu, indépendamment de l’évolution des sous-jacents.

Vous trouverez davantage de produits UBS et des informations sur les opportunités et les risques à l’adresse ubs.com/keyinvest.

Henkel vs. Beiersdorf vs. Loréal 5 ans¹

Source: UBS AG, Bloomberg

Valeurs du: 08.11.2018

6.00% p.a. Callable Worst of Kick-In GOAL sur Henkel / Beiersdorf / L’Oréal

Symbol KCUDDU
SVSP Name Barrier Reverse Convertible
SPVSP Code 1230 (Callable)
Sous-jacent Henkel / Beiersdorf / L’Oréal
Devise EUR
Coupon 6.00% p.a.
Kick-In Level 60.00%
Echéance 16.11.2020
Émetteur UBS AG, London
Date de fixation du prix 14.11.2018, 15:00 h
 

Vous trouverez davantage de produits UBS et des informations sur les opportunités et les risques à l’adresse ubs.com/keyinvest.

Source: UBS AG, Bloomberg

Valeurs du: 08.11.2018

¹) La performance passée n’indique pas les résultats futures.
²) Les condition des ETTs sont vérifiés annuellement et peuvent être ajustées avec un délai de 13 mois après la publication.
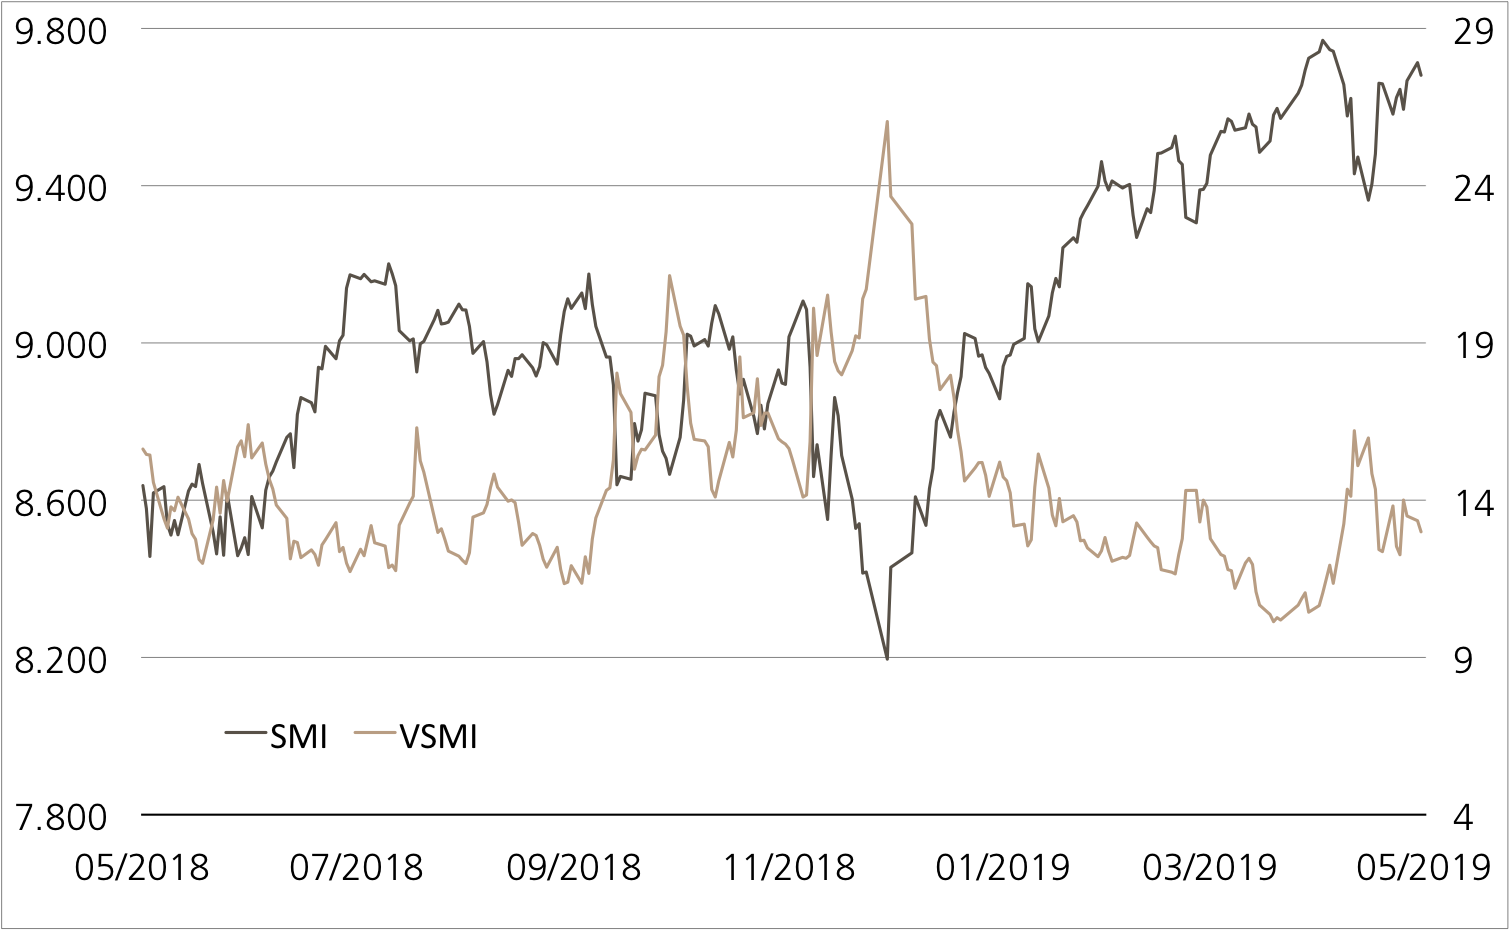
This material has been prepared by UBS AG or one of its affiliates («UBS»). This material is for distribution only as permitted by law. It is not prepared for the needs of any specific recipient. It is published solely for information and is not a solicitation or offer to buy or sell any securities or related financial instruments (“Instruments”). UBS makes no representation or warranty, either express or implied, on the completeness or reliability of the information contained in this document (“Information”) except that concerning UBS AG and its affiliates. The Information should not be regarded by recipients as a substitute for using their own judgment. Any opinions expressed in this material may change without notice and may be contrary to opinions expressed by other business areas of UBS as a result of using different assumptions or criteria. UBS is under no obligation to update the Information. UBS, its officers, employees or clients may have or have had an interest in the Instruments and may at any time transact in them. UBS may have or have had a relationship with entities referred to in the Information. Neither UBS nor any of its affiliates, or their officers or employees, accepts any liability for any loss arising from use of the Information. This presentation is not a basis for entering into a transaction. Any transaction between you and UBS will be subject to the detailed provisions of the term sheet, confirmation or electronic matching systems relating to that transaction. Clients wishing to effect transactions should contact their local sales representative.
This information is communicated by UBS AG and/or its affiliates («UBS»). * (see below) UBS may from time to time, as principal or agent, have positions in, or may buy or sell, or make a market in any securities, currencies, financial instruments or other assets underlying the product to which this website relates (the «Structured Product»). UBS may provide investment banking and other services to and/or have officers who serve as directors of the companies referred to in this website. UBS’s trading and/or hedging activities related to the Structured Product may have an impact on the price of the underlying asset and may affect the likelihood that any relevant barrier or relevant trigger event is crossed or triggered. UBS has policies and procedures designed to minimise the risk that officers and employees are influenced by any conflicting interest or duty and that confidential information is improperly disclosed or made available. UBS may pay or receive brokerage or retrocession fees in connection with the Structured Product described herein. In respect of any Structured Product that is a security, UBS may, in certain circumstances, sell the Structured Product to dealers and other financial institutions at a discount to the issue price or rebate to them for their own account some proportion of the issue price. Further information is available on request. Structured Products are complex and may involve a high risk of loss. Prior to purchasing the Structured Product you should consult with your own legal, regulatory, tax, financial and accounting advisors to the extent you consider it necessary, and make your own investment, hedging and trading decisions (including decisions regarding the suitability of the Structured Product) based upon your own judgement and advice from those advisers you consider necessary. Save as otherwise expressly agreed in writing, UBS is not acting as your financial adviser or fiduciary in relation to the Product. UBS generally hedges its exposure to Structured Products, although it may elect not to hedge or to partially hedge any Structured Product. UBS’s hedging activity may be conducted through transactions in the underlying asset, index or instrument or in options, futures or other derivatives related to the underlying asset, index or instrument on publicly traded markets or otherwise, and may have an impact on the price of the under-lying asset. If a transaction is cash settled, UBS will generally unwind or offset any hedge it has for such Structured Product in close proximity to the relevant valuation time or period. In some cases, this activity may affect the value of the Structured Product. Unless stated otherwise in this document, (i) this document is for information purposes only and should not be construed as an offer, personal recommendation or solicitation to purchase the Structured Product and should not be treated as giving investment advice, and (ii) the terms of any investment in the Structured Product will be exclusively subject to the detailed provisions, including risk considerations, contained in the more detailed legal documentation that relates to the Structured Product (being the confirmation, information memorandum, prospectus or other issuer documentation as relevant). UBS makes no representation or warranty relating to any information herein which is derived from independent sources. This document shall not be copied or reproduced without UBS’s prior written permission. In respect of any Structured Product that is a security, no action has been or will be taken in any jurisdiction that would permit a public offering of the Product, save where explicitly stated in the issuer documentation. The Structured Product must be sold in accordance with all applicable selling restrictions in the jurisdictions in which it is sold.
© UBS 2018. All rights reserved. UBS prohibits the forwarding of this information without the approval of UBS.
Weekly-Hits édition de 09.11.20182018-11-09T13:49:36+01:00

Weekly-Hits edition of 09.11.2018

KeyInvest Weekly Hits

Friday, 09.11.2018

  • Topic 1: European industrials - A multifaceted sector
  • Topic 2: Henkel/Beiersdorf/L’Oréal - Staying in step with consumers

European industrials
A multifaceted sector

UBS CIO GWM identifies the geopolitical uncertainty factors mainly responsible for the current weak performance of the stock markets in the European Monetary Union (EMU). Looking to the future, experts recommend a neutral weighting within the eurozone countries. Industrial equities are overweight in terms of sector allocation. The ETT (symbol: ETIND) on the STOXX™ Europe 600 Industrial Goods & Services Index allows for a corresponding weighting, as the open end product tracks the performance of the industry benchmark. In contrast, the Early Redemption (ER) Worst of Kick-In GOAL (symbol: KCUGDU) is geared towards the Alstom, Siemens and thyssenkrupp equities delivering a relatively stable performance. Provided none of the industrials touch or fall below the barrier of 59% of their respective initial prices, investors will receive a maximum return of 7% upon maturity.

Bert Jansen, Strategist at UBS CIO GWM, notes that sector momentum has always been the main driver for eurozone equity markets in the past. He attests that it has always been more important than country-specific factors. According to Jansen, however, an exception to this rule is Italy, as the equity market in the southern European country is strongly geared to the financial sector. The country’s rather lax budgetary discipline is negatively impacting share prices accordingly. Since a large part of the negative sentiment is now likely to be priced in, Italy – like other EU members – will receive a neutral weighting in the country allocation. In terms of sectors, CIO GWM is pursuing a largely balanced mix of cyclical and non-cyclical sectors for the eurozone. An overweight is being maintained in the energy and industry sectors. (Source: UBS CIO GWM, UBS House View Weekly, Regional View Europe, October 29, 2018)

Naturally, the second sector has been particularly exposed to the trade dispute that has prevailed as one of the main factors for market uncertainty in 2018. It is therefore not surprising that the STOXX™ Europe 600 Industrial Goods & Services Index was included in the wave of sales in October. Fundamentally, however, the sector continues to grow. Despite a downward trend, the Purchasing Managers› Index for industry calculated by Markit, for example, remained above the expansionary threshold of 50 in September. In addition to the robust global economy, megatrends such as robotics and automation, energy efficiency and growing air traffic should play into the hands of the sector.

Opportunities: The Exchange Traded Tracker (ETT) (symbol: ETIND) allows investors to diversify their positions. The underlying STOXX™ Europe 600 Industrial Goods & Services Index currently comprises 100 companies. In terms of weighting, Siemens leads the way. Besides the German group, Alstom is also on CIO GWM’s current most preferred list for European industrials. Together with thyssenkrupp, the duo forms the basis for a new ER Worst of Kick-In GOAL (symbol: KCUGDU). Investors can expect a fixed coupon payment of 7% p.a. with this issue. This return opportunity comes with a 41% safety buffer. As part of the early redemption function, the underlyings will be put to the test for the first time on November 14, 2019. Should the three shares close at or above their respective initial prices on this date or one of the other quarterly observation days, investors will receive the nominal amount plus the pro rata coupon early.

Risks: The aforementioned products do not have capital protection. Should the underlying assets deliver a negative performance, the ETT will incur commensurate losses. If the underlyings of the Kick-In GOAL touch or fall below the respective Kick-In Level (barrier) and the early redemption feature does not apply, the amount repaid on the maturity date is reflecting the worst performance of the underlyings (but not more than notional value plus coupon). In this case, it is likely that losses will be incurred. Investors in structured products are also exposed to issuer risk, which means that the capital invested may be lost if UBS AG becomes insolvent, regardless of the performance of the underlying.

More UBS products and further information on the risks and opportunities are available at ubs.com/keyinvest.

STOXX™ Europe 600 Industrial Goods & Services Index vs. STOXX™ Europe 600 Index 5 years¹

After the recent setback, Europe’s industrials have been unable to break out of their current sideways trend. However, the sector is still ahead of the general market.

Source: UBS AG, Bloomberg

As of 08.11.2018

Alstom vs. Siemens vs. thyssenkrupp 5 years¹

Alstom is defying the difficult market environment. Thanks to its recent outperformance, the French industrial rocketed past the German large caps Siemens and thyssenkrupp in the five-year ranking.

Source: UBS AG, Bloomberg

As of: 08.11.2018

¹) Please be aware that past performance does not indicate future results.
²) The conditions of ETTs are reviewed on a yearly basis and can be adjusted with a deadline of 13 months after the announcement.

ETT on STOXX™ Europe 600 Industrial Goods & Services NR Index

Symbol ETIND
SVSP Name Tracker Certifikat
SPVSP Code 1300
Underlying STOXX™ Europe 600 Industrial Goods & Services Net Return Index
Currency EUR
Ratio 1:1
Administration fee 0.00% p.a.²
Participation 100%
Expiry Open End
Issuer UBS AG, London
Bid/Ask EUR 922.50 / 927.50
 

7.00% p.a. ER Worst of Kick-In GOAL on Alstom / Siemens / thyssenkrupp

Symbol KCUGDU
SVSP Name Barrier Reverse Convertible
SPVSP Code 1230 (Auto-Callable)
Underlying Alstom / Siemens / thyssenkrupp
Currency EUR
Coupon 7.00% p.a.
Kick-In Level 59.00%
Expiry 15.05.2020
Issuer UBS AG, London
Subscription until 14.11.2018, 15:00 h
 

More UBS products and further information on the risks and opportunities are available at ubs.com/keyinvest.

Source: UBS AG, Bloomberg

As of: 08.11.2018

Market overview

Index Quotation Week¹
SMI™ 9’050.53 0.3%
SLI™ 1’425.81 0.4%
S&P 500™ 2’813.89 3.8%
Euro STOXX 50™ 3’246.66 1.5%
S&P™ BRIC 40 3’954.66 4.4%
CMCI™ Compos. 928.33 0.0%
Gold (troy ounce) 1’228.70 USD 1.1%

¹ Change based on the closing price of the previous day compared to the closing price a week ago.

SMI™ vs. VSMI™ 1 year

smi vs vsmi

The VSMI™ Index is calculated since 2005. It shows the volatility of the stocks within the SMI™ index. A portfolio which reacts only to changes in volatility instead of volatility itself is relevant for the calculation. Thereby, the VSMI™ methodology uses the squared volatility, known as variance, of the SMI options with remaining time to expiry of 30 days traded at the Eurex.

Source: UBS AG, Bloomberg

As of: 08.11.2018

Henkel/Beiersdorf/L’Oréal
Staying in step with consumers

With just a few weeks to go before Christmas, consumers around the globe are in a spending mood – in the US, consumer sentiment has recently reached its highest level since the turn of the millennium. The current indicators are likely to delight Henkel, Beiersdorf and L’Oréal. UBS is using the shares of the three leading consumer goods manufacturers as the underlyings for a new issue. The Callable Worst of Kick-In GOAL (symbol: KCUDDU) has a 6% annual coupon, while the barriers are set at 60% of each of the initial share prices.

The latest figures from L’Oréal show that consumers in Asia are also really in the mood to buy. In the second quarter of 2018, the French cosmetics manufacturer recorded sales growth of 7.5% on a comparable basis, which resulted in the company exceeding the average analysts› expectations. In Asia, demand was particularly strong for skincare products such as anti-aging creams. According to CEO Jean-Paul Agon, the group is growing rapidly, especially in China where the boom in luxury products persists. In this key segment, L’Oréal is represented by Yves Saint Laurent’s make-up products, among other items.

Beiersdorf published its quarterly figures on the same day as the French company. The cosmetics group increased sales organically 6% over the first nine months of 2018. The North Germans also enjoyed flourishing growth in the luxury segment, with sales of the La Prairie brand skyrocketing by 46.7%. Beiersdorf also recorded significant growth in the adhesives segment with the Tesa brand. (Source: Thomson Reuters media reports, October 30, 2018) Adhesives and sealants are also among Henkel’s core competencies. The DAX™ company is also active in the body care segment, as well as in detergents and cleaning agents. On November 15, investors can find out how Henkel has performed recently.

Opportunities: Should the Henkel, Beiersdorf and L’Oréal share prices largely remain stable, this should prove sufficient for the investment in the Callable Worst of Kick-In GOAL (symbol: KCUDDU) to pay off. All that is required is that none of the three shares touch or fall below the low barrier of 60% of the respective initial prices. Since the annual coupon of 6% is paid out in any case, the corresponding maximum return would then be achieved upon maturity. Please note that the issuer has a call option. If it makes use of this call option on one of the dates provided for this purpose, the pro rata coupon will be repaid early in addition to the nominal value.

Risks: Worst-of Kick-In GOALs do not have capital protection. If the underlyings of the Kick-In GOAL touch or fall below the respective Kick-In Level (barrier) and the callable feature does not apply, the amount repaid on the maturity date is reflecting the worst performance of the underlyings (but not more than notional value plus coupon). In this case, it is likely that losses will be incurred. Investors in structured products are also exposed to issuer risk, which means that the capital invested may be lost if UBS AG becomes insolvent, regardless of the performance of the underlying.

More UBS products and further information on the risks and opportunities are available at ubs.com/keyinvest.

Henkel vs. Beiersdorf vs. Loréal five years¹

Source: UBS AG, Bloomberg

As of: 08.11.2018

6.00% p.a. Callable Worst of Kick-In GOAL on Henkel / Beiersdorf / L’Oréal

Symbol KCUDDU
SVSP Name Barrier Reverse Convertible
SPVSP Code 1230 (Callable)
Underlyings Henkel / Beiersdorf / L’Oréal
Currency EUR
Coupon 6.00% p.a.
Kick-In Level 60.00%
Expiry 16.11.2020
Issuer UBS AG, London
Subscription until 14.11.2018, 15:00 h
 

More UBS products and further information on the risks and opportunities are available at ubs.com/keyinvest.

Source: UBS AG, Bloomberg

As of: 08.11.2018

¹) Please be aware that past performance does not indicate future results.
²) The conditions of ETTs are reviewed on a yearly basis and can be adjusted with a deadline of 13 months after the announcement.

This material has been prepared by UBS AG or one of its affiliates («UBS»). This material is for distribution only as permitted by law. It is not prepared for the needs of any specific recipient. It is published solely for information and is not a solicitation or offer to buy or sell any securities or related financial instruments (“Instruments”). UBS makes no representation or warranty, either express or implied, on the completeness or reliability of the information contained in this document (“Information”) except that concerning UBS AG and its affiliates. The Information should not be regarded by recipients as a substitute for using their own judgment. Any opinions expressed in this material may change without notice and may be contrary to opinions expressed by other business areas of UBS as a result of using different assumptions or criteria. UBS is under no obligation to update the Information. UBS, its officers, employees or clients may have or have had an interest in the Instruments and may at any time transact in them. UBS may have or have had a relationship with entities referred to in the Information. Neither UBS nor any of its affiliates, or their officers or employees, accepts any liability for any loss arising from use of the Information. This presentation is not a basis for entering into a transaction. Any transaction between you and UBS will be subject to the detailed provisions of the term sheet, confirmation or electronic matching systems relating to that transaction. Clients wishing to effect transactions should contact their local sales representative.
This information is communicated by UBS AG and/or its affiliates («UBS»). * (see below) UBS may from time to time, as principal or agent, have positions in, or may buy or sell, or make a market in any securities, currencies, financial instruments or other assets underlying the product to which this website relates (the «Structured Product»). UBS may provide investment banking and other services to and/or have officers who serve as directors of the companies referred to in this website. UBS’s trading and/or hedging activities related to the Structured Product may have an impact on the price of the underlying asset and may affect the likelihood that any relevant barrier or relevant trigger event is crossed or triggered. UBS has policies and procedures designed to minimise the risk that officers and employees are influenced by any conflicting interest or duty and that confidential information is improperly disclosed or made available. UBS may pay or receive brokerage or retrocession fees in connection with the Structured Product described herein. In respect of any Structured Product that is a security, UBS may, in certain circumstances, sell the Structured Product to dealers and other financial institutions at a discount to the issue price or rebate to them for their own account some proportion of the issue price. Further information is available on request. Structured Products are complex and may involve a high risk of loss. Prior to purchasing the Structured Product you should consult with your own legal, regulatory, tax, financial and accounting advisors to the extent you consider it necessary, and make your own investment, hedging and trading decisions (including decisions regarding the suitability of the Structured Product) based upon your own judgement and advice from those advisers you consider necessary. Save as otherwise expressly agreed in writing, UBS is not acting as your financial adviser or fiduciary in relation to the Product. UBS generally hedges its exposure to Structured Products, although it may elect not to hedge or to partially hedge any Structured Product. UBS’s hedging activity may be conducted through transactions in the underlying asset, index or instrument or in options, futures or other derivatives related to the underlying asset, index or instrument on publicly traded markets or otherwise, and may have an impact on the price of the under-lying asset. If a transaction is cash settled, UBS will generally unwind or offset any hedge it has for such Structured Product in close proximity to the relevant valuation time or period. In some cases, this activity may affect the value of the Structured Product. Unless stated otherwise in this document, (i) this document is for information purposes only and should not be construed as an offer, personal recommendation or solicitation to purchase the Structured Product and should not be treated as giving investment advice, and (ii) the terms of any investment in the Structured Product will be exclusively subject to the detailed provisions, including risk considerations, contained in the more detailed legal documentation that relates to the Structured Product (being the confirmation, information memorandum, prospectus or other issuer documentation as relevant). UBS makes no representation or warranty relating to any information herein which is derived from independent sources. This document shall not be copied or reproduced without UBS’s prior written permission. In respect of any Structured Product that is a security, no action has been or will be taken in any jurisdiction that would permit a public offering of the Product, save where explicitly stated in the issuer documentation. The Structured Product must be sold in accordance with all applicable selling restrictions in the jurisdictions in which it is sold.
© UBS 2018. All rights reserved. UBS prohibits the forwarding of this information without the approval of UBS.
Weekly-Hits edition of 09.11.20182018-11-09T13:21:10+01:00

Weekly-Hits Ausgabe vom 08.11.2018


KeyInvest Weekly Hits
Donnerstag, 08.11.2018
  • Thema 1: Europäische Industriewerte – Sektor mit vielen Facetten
  • Thema 2: Henkel / Beiersdorf / L’Óreal – Am Puls der Konsumenten
  • Thema 3: Rohstoffmonitor – Oktober 2018

Europäische Industriewerte
Sektor mit vielen Facetten

UBS CIO GWM bezeichnet die geopolitischen Unsicherheitsfaktoren als hauptverantwortlich für die derzeit schwache Entwicklung an den Aktienmärkten der Europäischen Währungsunion (EWU).  Mit Blick nach vorne raten die Experten innerhalb der Länder der Eurozone zu einer neutralen Gewichtung. In der Sektorallokation sind Industrieaktien übergewichtet. Eine entsprechende Ausrichtung macht der ETT (Symbol: ETIND) auf den STOXX™ Europe 600 Industrial Goods & Services möglich – das Open End-Produkt partizipiert 1:1 am Fortgang der Branchenbechmark. Dagegen zielt der Early Redemption (ER) Worst of Kick-In GOAL (Symbol: KCUGDU) auf eine relative stabile Entwicklung von Alstom, Siemens und thyssenkrupp ab. Solange keiner der drei Industriewerte auf oder unter die Barriere von 59 Prozent der Anfangskurse fällt, erzielen Anleger am Laufzeitende die Maximalrendite von 7.00 Prozent p.a. 

Bert Jansen, Stratege bei UBS CIO GWM, stellt fest, dass die Sektordynamik in der Vergangenheit stets der Haupttreiber für die Aktienmärkte der Eurozone war. Sie sei bedeutender gewesen als länderspezifische Faktoren. Als eine Ausnahme von dieser Regel bezeichnet Jansen Italien. Der Aktienmarkt des südeuropäischen Landes ist dem Strategen zufolge stark auf den Finanzsektor ausgerichtet. Entsprechend lastet der Rückfall zu einer eher laxen Haushaltsdisziplin auf den Kursen. Da mittlerweile ein Grossteil der negativen Stimmung eingepreist sein dürfte, erhält Italien wie die anderen Euro-Mitglieder in der Länderallokation eine neutrale Gewichtung. Was die Sektoren anbelangt, verfolgt CIO GWM für die Eurozone ein weitgehend ausgewogene Mischung zwischen zyklischen und nicht-zyklischen Branchen. Eine Übergewichtung erhalten die Bereiche Energie und Industrie. (Quelle: UBS CIO GWM, UBS House View Weekly, Regional View Europe, 29.10.2018)
 
Naturgemäss ist der zweitgenannte Sektor dem Handelsstreit als zentralem Unsicherheitsfaktor im Börsenjahr 2018 in besonderem Masse ausgesetzt. Insofern überrascht es nicht, dass der STOXX™ Europe 600 Industrial Goods & Services Index von der Verkaufswelle im Oktober erfasst wurde. Fundamental befindet sich der Sektor dagegen noch auf Wachstumskurs. Trotz einer rückläufigen Tendenz hielt sich beispielsweise der von Markit ermittelte Einkaufsmanagerindex für die Industrie im September über der Expansionsschwelle von 50. Neben der robusten Weltkonjunktur sollten dem Sektor Megatrends wie beispielsweise Robotik und Automation, Energieeffizienz oder wachsender Flugverkehr in die Hände spielen. 


Chancen:
Mit dem Exchange Traded Tracker (ETT) (Symbol: ETIND) können sich Anleger diversifiziert positionieren. Im zugrunde liegenden STOXX™ Europe 600 Industrial Goods & Services Index sind momentan 100 Unternehmen enthalten. In punkto Gewichtung steht dabei Siemens an der Spitze. Neben dem deutschen Konzern ist auch Alstom auf der aktuellen Most-Preferred-Liste von CIO GWM für europäische Industrieaktien zu finden. Zusammen mit  thyssenkrupp bildet das Duo die Basis für einen neuen ER Worst of Kick-In GOAL (Symbol: KCUGDU). Anleger können bei dieser Emission fest mit einer Couponzahlung von 7.00 Prozent p.a. rechnen. Die Renditechance ist an ein Sicherheitspolster von 41 Prozent gekoppelt. Im Zuge der Early-Redemption-Funktion kommen die Basiswerte erstmals am 14. November 2019 auf den Prüfstand. Steht das Trio an diesem oder einem der weiteren vierteljährlichen Beobachtungstage geschlossen auf oder über der jeweiligen Anfangsfixierung, erhalten Anleger das Nominal mitsamt dem anteiligen Coupon vorzeitig zurückbezahlt.

Risiken:
Die vorgestellten Produkte sind nicht kapitalgeschützt. Eine negative Entwicklung des Basiswerts führt beim ETT zu entsprechenden Verlusten. Notiert einer der Basiswerte beim Worst of Kick-In GOAL während der Laufzeit einmal auf oder unter dem jeweiligen Kick-In Level (Barriere) und kommt zudem des Early-Redemption-Feature nicht zum tragen, kann die Rückzahlung am Verfalltag durch Bartilgung entsprechend der (vom Strike aus) schwächsten Performance aus dem Trio erfolgen (höchstens jedoch zum Nominalwert zuzüglich Coupon). In diesem Fall sind Verluste wahrscheinlich. Zudem trägt der Anleger bei Strukturierten Produkten das Emittentenrisiko, so dass das eingesetzte Kapital – unabhängig von der Entwicklung des Basiswertes – im Falle einer Insolvenz der UBS AG verloren gehen kann.

Weitere UBS Produkte sowie Informationen zu Chancen und Risiken finden Sie unter ubs.com/keyinvest.
 
 
STOXX™ Europe 600 Industrial Goods & Services Index vs. STOXX™ Europe 600 Index 5 Jahre¹
Nach dem jüngsten Rücksetzer sind Europas Industrieaktien vorerst am Ausbruch nach oben aus einer Seitwärtsbewegung gescheitert. Gegenüber dem breiten Markt hat der Sektor die Nase aber weiterhin vorne.
 
Quelle: UBS AG, Bloomberg
Stand: 07.11.2018

Alstom vs. Siemens vs. thyssenkrupp 5 Jahre¹
Alstom trotzt dem schwierigen Börsenumfeld. Dank der jüngsten Outperformance konnte der französische Industrietitel in der Fünf-Jahres-Wertung an dem deutschen Duo Siemens und thyssenkrupp vorbeiziehen.
 
Quelle: UBS AG, Bloomberg
Stand: 07.11.2018

 
¹) Bitte beachten Sie, dass vergangene Wertentwicklungen keine Indikationen für künftige Wertentwicklungen sind.
²) Die Konditionen der ETTs werden jährlich überprüft und können mit einer Frist von 13 Monaten nach Bekanntgabe angepasst werden
 
ETT auf den STOXX™ Europe 600 Industrial Goods & Services NR Index

Symbol ETIND
SVSP Name Tracker-Zertifikat
SPVSP Code 1300
Basiswert STOXX™ Europe 600 Industrial Goods & Services Net Return Index
Bezugsverhältnis 1:1
Handelswährung EUR
Verwaltungsgebühr 0.0% p.a.²
Partizipation 100%
Verfall Open End
Emittentin UBS AG, London
Geld-/Briefkurs EUR 922.50 / 927.50
 

7.00% p.a. ER Worst of Kick-In GOAL auf Alstom / Siemens / thyssenkrupp

Symbol KCUGDU
SVSP Name Barrier Reverse Convertible
SPVSP Code 1230 (Auto-Callable)
Basiswerte Alstom / Siemens / thyssenkrupp
Handelswährung EUR
Coupon 7.00% p.a.
Kick-In Level (Barriere) 59.00%
Verfall 15.05.2020
Emittentin UBS AG, London
Zeichnung bis 14.11.2018, 15:00 Uhr
 

Weitere Produkte sowie Informationen zu Chancen und Risiken finden Sie unter: ubs.com/keyinvest Quelle: UBS AG, Bloomberg Stand: 07.11.2018
 
Marktübersicht
Index Stand Woche¹
SMI™ 9’050.53 Pkt. 0.3%
SLI™ 1’425.81 Pkt. 0.4%
S&P 500™ 2’813.89 Pkt. 3.8%
EURO STOXX 50™ 3’246.66 Pkt. 1.5%
S&P™ BRIC 40 3’954.66 Pkt. 4.4%
CMCI™ Compos. 928.33 Pkt. 0.0%
Gold (Feinunze) 1’228.70 USD 1.1%

SMI™ vs. VSMI™ 1 Jahr

 
¹ Veränderung auf Basis des Schlusskurses des Vortages im Vergleich zum Schlusskurs vor einer Woche.
Der VSMI™ Index wird seit 2005 berechnet. Er zeigt die Volatilität der im SMI™ Index enthaltenen Aktien. Massgeblich für die Berechnung ist ein Portfolio, welches nicht auf Preisschwankungen, sondern ausschliesslich auf Veränderungen der Volatilität reagiert. Dabei greift die VSMI™ Methodik auf die quadrierten Volatilitäten, im Fachjargon „Varianzen“, der an der Eurex gehandelten SMI-Optionen mit einer konstanten Restlaufzeit von 30 Tagen zurück.


Henkel / Beiersdorf / L’Oréal
Am Puls der Konsumenten

 
Wenige Wochen vor dem Weihnachtsgeschäft zeigen sich die Verbraucher rund um den Globus in Spendierlaune – in den USA hat die Konsumentenstimmung zuletzt sogar das höchste Niveau seit der Jahrtausendwende erreicht. Die aktuellen Indikatoren dürften ganz nach dem Geschmack von Henkel, Beiersdorf und L’Oréal sein. UBS setzt die drei namhaften Konsumgüterhersteller als Basiswerte für eine laufende Neuemission ein. Der Callable Worst of Kick-In GOAL (Symbol: KCUDDU) ist mit einem Coupon in Höhe von 6.00 Prozent p.a. ausgestattet, während die Barrieren bei jeweils 60 Prozent der Anfangskurse fixiert werden.


Die jüngsten Zahlen von L’Oréal zeigen, dass derzeit auch in Asien eine ausgeprägte Kauflaune vorherrscht. Im zweiten Quartal 2018 verbuchte der französische Kosmetik-Hersteller auf vergleichbarer Basis ein Umsatzwachstum von 7.5 Prozent. Damit übertraf das Unternehmen die durchschnittlichen Analystenerwartungen. In Asien waren vor allem Hautpflegeprodukte, wie beispielsweise Anti-Aging-Cremes, gefragt. Laut CEO Jean-Paul Agon wächst der Konzern insbesondere in China rapide – im Reich der Mitte halte der Boom bei Luxusprodukten an. L’Oréal ist in diesem wichtigen Segment unter anderem mit den Make-ups von Yves Saint Laurent vertreten.
 
Am selben Tag wie die Franzosen publizierte Beiersdorf den Zwischenbericht. Der Kosmetikkonzern hat den Umsatz in den ersten neun Monaten 2018 organisch um sechs Prozent erhöht. Auch bei den Norddeutschen florierte vor allem das Luxussegment, die Umsätze mit der Marke La Prairie schnellten um 46.7 Prozent nach oben. Deutliches Wachstum verzeichnete Beiersdorf zudem in der Klebstoffsparte um die Marke Tesa. (Quellen: Thomson Reuters, Medienberichte, 30.10.2018) Kleb- und Dichststoffe zählen auch zu den Kernkompetenzen von Henkel. Darüber hinaus ist das DAX™-Unternehmen auf dem Gebiet der Körperpflege sowie bei den Wasch- und Reinigungsmitteln aktiv. Wie die Geschäfte von Henkel zuletzt gelaufen sind, erfahren Anleger am 15. November.
 

Chancen:
Eine weitestgehend stabile Kursentwicklung von Henkel, Beiersdorf und L’Oréal reicht, damit dass Investmentkalkül des Callable Worst of Kick-In GOAL (Symbol: KCUDDU) aufgeht. Entscheidend ist, dass keine Aktie aus dem Trio auf oder unter die Barriere bei tiefen 60 Prozent der Anfangsfixierung fällt. Da der Coupon in Höhe von 6.00 Prozent p.a. in jedem Fall zur Auszahlung kommt, würde dann per Laufzeitende die dementsprechende Maximalrendite erreicht. Bitte beachten Sie, dass die Emittentin über ein Kündigungsrecht verfügt. Macht sie davon an einem der dafür vorgesehenen Termine Gebrauch, wird neben dem Nominal der anteilige Coupon vorzeitig zurückbezahlt.

Risiken:
Worst-of Kick-In GOALs sind nicht kapitalgeschützt. Notiert einer der Basiswerte während der Laufzeit einmal auf oder unter dem jeweiligen Kick-In Level (Barriere) und kommt zudem das Callable-Feature nicht zum tragen, kann die Rückzahlung am Verfalltag durch Bartilgung entsprechend der (vom Strike aus) schwächsten Performance aus dem Trio erfolgen (höchstens jedoch zum Nominalwert zuzüglich Coupon). In diesem Fall sind Verluste wahrscheinlich. Zudem trägt der Anleger bei Strukturierten Produkten das Emittentenrisiko, so dass das eingesetzte Kapital – unabhängig von der Entwicklung der Basiswerte – im Falle einer Insolvenz der UBS AG verloren gehen kann.
Weitere UBS Produkte sowie Informationen zu Chancen und Risiken finden Sie unter ubs.com/keyinvest.
 
Henkel vs. Beiersdorf vs. Loréal 5 Jahre¹
Quelle: UBS AGStand: 07.11.2018

 
6.00% p.a. Callable Worst of Kick-In GOAL auf Henkel / Beiersdorf / L’Oréal
Symbol KCUDDU
SVSP Name Barrier Reverse Convertible
SPVSP Code 1230 (Callable)
Basiswerte Henkel / Beiersdorf / L’Oréal
Handelswährung EUR
Coupon 6.00% p.a.
Kick-In Level (Barriere) 60.00%
Verfall 16.11.2020
Emittentin UBS AG, London
Zeichnung bis 14.11.2018, 15:00 Uhr
 

Termsheet Weitere Produkte sowie Informationen zu Chancen und Risiken finden Sie unter: ubs.com/keyinvest   Quelle: UBS AG Stand: 07.11.2018

 
¹) Bitte beachten Sie, dass vergangene Wertentwicklungen keine Indikationen für künftige Wertentwicklungen sind.
²) Die Konditionen der ETTs werden jährlich überprüft und können mit einer Frist von 13 Monaten nach Bekanntgabe angepasst werden


Rohstoffmonitor Oktober 2018

Performance Einzelrohstoffe:An den Ölmärkten ist die Stimmung im Oktober gekippt. Noch Anfang Monat bestimmten die Sorgen vor einem Engpass auf der Angebotsseite das Geschehen. Später führte nicht zuletzt der andauernde Handelskonflikt dazu, dass die Zweifel am Wachstum der Nachfrage zunahmen. Die Folge: Mit Benzin sowie den beiden Rohölgattungen WTI und Brent stehen drei Energieträger am unter Ende des Performancerankings. Dagegen führt Zucker die Wertung für Oktober an. Beim weissen Kristall erwarten Experten neuerdings anstelle eines Überschusses in der Erntesaison 2018/19 ein weltweites Angebotsdefizit. Prozentual zweistellige Zugewinne verbuchten im Berichtsmonat auch Kakao und Kaffee.

Monatsperformance Einzelrohstoffe im Oktober 2018 (USD)¹

Total-Return-Performance der UBS Bloomberg CMCI Einzelrohstoff-Indizes im Oktober 2018 in US-Dollar.


Stand: 31.10.2018Quelle: UBS AG

CMCI™ Sektor-Indizes:Angeschoben von den drei «Soft Commoditites» verbuchte das Segment der Agrarrohstoffe im Oktober einen Zugewinn von mehr als drei Prozent.  Gefragt waren zudem Edelmetalle – der entsprechende Sektorindex verteuerte sich um 1.5 Prozent. Der Ausverkauf an den Aktienmärkten hat Gold im Oktober zurück in den Fokus der Investoren gebracht. Dagegen verzeichnete der Sektor Energie die mit Abstand grössten Verluste.
 
Rohstoff-Index-Vergleich seit CMCI™-Lancierung im Januar 2007 (USD)¹
Performance ausgesuchter Rohstoff-Indizes im Vergleich zum UBS Bloomberg CMCI™ Composite Index seit dessen Lancierung im Januar 2007. 
Quelle: UBS AG
Stand: 31.10.2018

Performance UBS Bloomberg CMCI™ Sektor-Indizes (USD)¹
Total-Return-Performance der einzelnen UBS Bloomberg CMCI™ Sektor-Indizes im Oktober 2018.
Quelle: UBS AG
Stand: 31.10.2018

 
Meistgehandelte UBS ETC auf CMCI™:
Gleichwohl dominierten im Oktober auf Öl basierende Produkte den Handel mit UBS ETCs. Während die vier aktivsten Papiere die Korrektur beim schwarzen Gold deutlich zu spüren bekamen, münzte ein Short-Zertifikat (Symbol: OIL2S) den Rücksetzer von WTI mit Hebel in Gewinne um. Das Agrarsegment ist mit einem ETC auf Kaffee sowie dem CMCI Sektorindex in der Spitzengruppe vertreten.
 
Meistgehandelte UBS ETCs auf UBS Bloomberg CMCI™ Indizes im Oktober 2018

Produkt Symbol Währung Monatsperformance¹ Anteil am Gesamtvolumen
UBS ETC on CMCI Brent Crude TCOCI USD -5.1% 34.9%
UBS ETC on CMCI WTI Crude Oil ECLCI EUR -6.7% 10.9%
UBS ETC on CMCI WTI Crude Oil CCLCIU CHF -7.2% 7.3%
UBS ETC on CMCI WTI Crude Oil TCLCI USD -7.0% 6.2%
UBS ETC on CMCI 2X SH CMCI WTI 3-M OIL2S USD 19.3% 5.3%
UBS ETC on CMCI Coffee USD TR Index TKCCIU USD 10.3% 4,4%
UBS ETC on CMCI Composite TCMCI USD -1.8% 4.1%
UBS ETC on CMCI Agriculture USD TAGCIU USD 3.8% 3.3%
UBS ETC on CMCI Copper TLPCI USD -3.3% 2.4%
Prozentual meistgehandelte UBS ETCs im Vergleich zum Gesamtlvolumen aller UBS ETCs auf CMCI Indizes an der SIX Structured Products Exchange.
Quelle: UBS AG
Stand: 31.10.2018
 

Die in diesem Dokument enthaltenen Informationen werden ausschliesslich zu Informations- und Werbezwecken zur Verfügung gestellt und stellen weder Empfehlungen noch Anlageberatung von UBS AG, einer ihrer Tochtergesellschaften oder verbundenen Unternehmen («UBS») dar. Dieses Dokument wird nicht von einer UBS Research Abteilung ausgegeben und ist deshalb nicht als unabhängige Anlageforschung zu erachten. Es stellt weder einen Verkaufsprospekt, noch ein Angebot oder eine Einladung zur Offertenstellung dar, irgendeine Art von Anlage zu tätigen. Beachten Sie bitte, dass die Anlagebeispiele die Ansichten von UBS Research möglicherweise nicht vollständig wiedergeben. Dieses Dokument und die darin beschriebenen Produkte und Dienstleistungen sind allgemeiner Natur und beziehen sich weder auf die persönlichen Anlageziele noch die finanzielle Situation oder besonderen Bedürfnisse eines spezifischen Empfängers. Anlageentscheide sollten stets im Portfoliokontext getroffen werden und Ihre persönliche Situation und Ihre entsprechende Risikobereitschaft und Risikofähigkeit berücksichtigen. Sie werden hiermit auf diese Risiken (die mitunter erheblich sein können) hingewiesen. Bevor Sie einen Anlageentscheid treffen, lesen Sie bitte die spezifischen Produkteinformationen und die Broschüre «Besondere Risiken im Effektenhandel». Bitte kontaktieren Sie Ihren Kundenberater, der Sie gerne bei Ihren Anlageideen unterstützt und Ihnen die spezifischen Produktinformationen zur Verfügung stellt. UBS übernimmt diesbezüglich keinerlei Haftung für das Verhalten von Dritten. Wir weisen Sie darauf hin, dass sich UBS das Recht vorbehält, Dienstleistungen, Produkte und Preise jederzeit ohne vorhergehende Ankündigung zu ändern, und dass sich die wiedergegebenen Informationen und Meinungen jederzeit ändern können. Es wird weder eine ausdrückliche noch stillschweigende Gewährleistung oder Garantie in Bezug auf die Richtigkeit, Vollständigkeit oder Verlässlichkeit der wiedergegebenen Informationen abgegeben, es sei denn, es handelt sich um Informationen, die sich auf die UBS AG beziehen. Zudem stellt dieses Dokument keine umfassende Beschreibung oder Zusammenfassung der genannten Märkte und Entwicklungen dar. Gewisse Zahlen beziehen sich auf vergangene Wertentwicklungen oder stellen simulierte Wertentwicklungen dar und sind somit keine zuverlässigen Indikatoren für künftige Ergebnisse. Bei einigen Zahlen handelt es sich möglicherweise lediglich um Prognosen, und Prognosen sind kein zuverlässiger Indikator für zukünftige Entwicklungen. Gewisse Diagramme und/oder Darstellungen von Wertentwicklungen basieren möglicherweise nicht auf 12-Monate-Perioden, was ihre Vergleichbarkeit und Aussagekraft reduziert. Wechselkurse können sich negativ auf den Wert, den Preis oder die Einnahmen von Produkten und Dienstleistungen auswirken, die in den Materialien genannt werden. Gebühren sind möglicherweise nicht enthalten und reduzieren die Wertentwicklung entsprechend. Die steuerliche Behandlung hängt von den individuellen Umständen jedes Kunden ab und kann sich in Zukunft ändern. UBS erbringt keine Rechts- oder Steuerberatungsdienste und gibt weder allgemeine noch auf die spezifischen Umstände und Bedürfnisse eines Kunden bezogene Erklärungen im Hinblick auf die steuerliche Behandlung von Anlagen oder der damit verbundenen Anlagerenditen ab. Die Empfänger sollten eine unabhängige rechtliche und steuerliche Beratung im Hinblick auf die Auswirkungen der Produkte/Dienstleistungen in der jeweiligen Rechtsordnung sowie die Eignung der Produkte und Dienstleistungen in Anspruch nehmen. UBS, ihre Verwaltungsräte, Geschäftsführer und Mitarbeiter oder Kunden halten oder hielten möglicherweise Anteile oder Hausse- und Baisse-Positionen («Longoder Short-Positionen») an den hierin genannten Wertpapieren oder sonstigen Finanzinstrumenten und können jederzeit als Auftraggeber oder Beauftrage Käufe und/oder Verkäufe tätigen. UBS fungiert oder fungierte möglicherweise als Marktmacher («Market-Maker») bei den Wertpapieren oder sonstigen Finanzinstrumenten. Des Weiteren unterhält oder unterhielt UBS möglicherweise eine Geschäftsbeziehung mit oder erbringt oder erbrachte Investmentbanking-, Kapitalmarktdienstleistungen und/oder sonstige Finanzdienstleistungen für die jeweiligen Unternehmen. Dieses Dokument und die darin enthaltenen Informationen sind ausschliesslich für Personen mit Domizil Schweiz gedacht. Sie dürfen unter keinen Umständen in Rechtsordnungen verbreitet werden, in denen eine solche Verbreitung gegen geltende Gesetze oder Regulierungen verstösst. Sie dürfen insbesondere nicht in den USA und/oder an USPersonen oder in Rechtsordnungen verteilt werden, in denen der Vertrieb durch uns eingeschränkt ist.Die im Dokument enthaltenen Informationen stammen, sofern nicht anders angegeben, von UBS. UBS übernimmt keine Gewährleistung (weder ausdrücklich noch stillschweigend) für Richtigkeit, Vollständigkeit und Aktualität der Informationen. Sie können jederzeit und ohne vorherige Ankündigung geändert werden. UBS ist nicht verpflichtet, die hierin enthaltenen Informationen zu aktualisieren oder auf dem neuesten Stand zu halten.Das vorliegende Material beinhaltet Daten, welche aus dem Backtesting von Daten resultieren, und wurde von UBS in gutem Glauben und unter Anwendung standardisierter Methoden erstellt. Diese Methoden basieren auf eigenen Modellen, empirischen Daten, Annahmen und anderen Informationen, die wir für korrekt und angemessen erachten. Gewisse Links führen zu Websites Dritter. Diese sind dem Einfluss der UBS vollständig entzogen, weshalb UBS für Richtigkeit, Vollständigkeit und Rechtmässigkeit des Inhalts solcher Websites sowie für darauf enthaltene Angebote und (Dienst-) Leistungen keinerlei Verantwortung übernimmt.Für gewisse Dienstleistungen und Produkte gelten gesetzliche Bestimmungen. Diese Dienstleistungen und Produkte können daher nicht weltweit uneingeschränkt angeboten werden.Hinweise zu den Grafiken: Nur für Illustrationszwecke. Vergangene Performance ist kein zuverlässiger Indikator für die künftige Performance. © UBS 2017. Das Schlüsselsymbol und UBS gehören zu den eingetragenen und nicht eingetragenen Markenzeichen von UBS. Alle Rechte bleiben vorbehalten.  Der SMI™ Index sowie entsprechende Marken und der SLI™ Index sowie entsprechende Marken und der der Swiss Performance Index™ Index (SPITM) sowie entsprechende Marken und der VSMI™ sowie entsprechende Marken sind Eigentum der SIX Swiss Exchange AG. Alle Rechte vorbehalten. Der S&P 500™ Index sowie entsprechende Marken und der S&P 500 Industrials Index™ sowie entsprechende Marken sind Eigentum der Standard & Poor›s Financial Services LLC. Alle Rechte vorbehalten. Der Euro STOXX 50™ Index sowie entsprechende Marken und der STOXX Europe 600 Banks Index sowie entsprechende Marken sind Eigentum der Stoxx AG. Alle Rechte vorbehalten. Der CMCI™ Composite Index sowie entsprechende Marken sind Eigentum der UBS AG. Alle Rechte vorbehalten. Der DAX™ Index sowie entsprechende Marken sind Eigentum der Deutsche Börse AG. Alle Rechte vorbehalten. Der JPM™ German Government Bond Index sowie entsprechende Marken sind Eigentum der JPM International Limited. Alle Rechte vorbehalten. Der NIKKEI 225™ Index sowie entsprechende Marken sind Eigentum der Nihon Keizai Shimbun Incorporation. Alle Rechte vorbehalten. Der EPRA Index™ sowie entsprechende Marken sind Eigentum der European Public Real Estate Association. Alle Rechte vorbehalten. Der FTSE™ Index sowie entsprechende Marken sind Eigentum der London Stock Exchange Group Holdings Limited. Alle Rechte vorbehalten. Der MSCI™ World Index sowie entsprechende Marken sind Eigentum der MSCI Incorporation. Alle Rechte vorbehalten. Der KOSPI™ Index sowie entsprechende Marken sind Eigentum der Korea Exchange Incorporation. Alle Rechte vorbehalten. Der HSCEI™ Index, der Hang Seng China EnterprisesTM Index sowie entsprechende Marken sind Eigentum der Hang Seng Data Services Limited. Alle Rechte vorbehalten.

Weekly-Hits Ausgabe vom 08.11.20182018-11-08T08:14:37+01:00

Weekly-Hits édition de 02.11.2018

KeyInvest Weekly Hits

Vendredi, 02.11.2018

  • Thème 1: US-Information Technology - L’heure de vérité
  • Thème 2: Métaux industriels - Un trio d’acier

US-Information Technology
L’heure de vérité

Traduction du 1 Novembre 2018: La saison sous revue bat son plein à Wall Street. Hier, le rapport intermédiaire d’Apple (après la clôture boursière US) constitue le paroxysme du flux de chiffres courant. Même si les résultats déjà disponibles pour le secteur technologique US ont pour la plupart dépassé les attentes, les cours ont récemment subi des pressions. Par rapport aux sommets absolus atteints en début de mois, l’indice S&P 500™ Information Technology a cédé 10.9%.¹ Les investisseurs qui voient dans ce recul une opportunité d’entrer peuvent choisir un ETT (symbole : ETINFU). Ce produit de participation reproduit l’indice S&P 500™ Information Technology sans limitation de durée et sans commissions de gestion². L’Early Redemption (ER) Worst of Kick-In GOAL sur Alphabet, Microsoft et Apple offre une alternative à l’investissement 1:1 dans le secteur US IT. Le produit en souscription est doté d’un coupon de 9,50% p.a. Les barrières sont basses, 60% du cours initial du trio sectoriel.

Peu de temps après que la cloche a sonné ce soir la fin de l’activité à Wall Street, un communiqué d’Apple passera dans les téléscripteurs. Le plus grand groupe boursier du monde publiera ses résultats du quatrième trimestre de l’exercice 2017/18 (au 30 septembre). De plus, la direction réunie autour du CEO Tim Cook tiendra dès 22h00 (Europe centrale) une téléconférence où elle prendra position de manière détaillée sur la récente marche des affaires et fera connaître ses prévisions pour l’important trimestre de Noël. Ne serait-ce qu’à cause de la taille du fabricant d’iPhones, le rapport intermédiaire est d’une importance extrême pour Wall Street.

Selon Factset, les bénéfices présentés jusqu’à présent par les entreprises informatiques étaient en moyenne supérieurs de 10% aux prévisions moyennes des analystes. La technologie de l’information se classe donc, parmi tous les secteurs US, deuxième en ce qui concerne l’écart vers le haut. Lors de la semaine d’échanges qui s’est achevée le 26 octobre, le groupe a relevé la croissance des bénéfices prévue pour le troisième trimestre de 17.0 à 21.9%. Microsoft et Intel ont fortement influencé cette révision à la hausse. Le résultat par action annoncé par les deux groupes pour le trimestre écoulé était de 18.8 respectivement 21.7% supérieur aux attentes. (Source : Factest, « Earnings Insight », 26.10.2018)

Opportunités: l’Exchange Traded Tracker (ETT) (symbole : ETINFU) reproduit l’indice S&P 500™ Information Technology composé de 65 actions au total de manière passive. Avec ce produit liquide, les investisseurs peuvent miser sur un rebond de l’indice sectoriel. Une stratégie « Buy-and-Hold » à plus long terme est également possible. Avec Apple et Microsoft, Alphabet fonctionne comme sous-jacent pour un nouveau ER Worst of Kick-In GOAL (symbole : KCTKDU). Dans le cadre d’une réforme de l’indice, la mère de Google a récemment été retirée du secteur IT et attribuée au domaine « Communication Services ». Ceci ne modifie pas les opportunités du produit en souscription : tant qu’aucun sous-jacent n’atteint ou ne passe en-dessous de la barrière de 60%, l’investissement produira un rendement de 9.50% p.a. Avec la fonction «Early Redemption», un remboursement anticipé avec coupon au pro rata est possible. Condition : Alphabet, Apple et Microsoft atteignent ou dépassent ensemble le cours initial à l’un des jours d’observation trimestriel (première date : 7.11.2019)

Risques: il n’existe aucune protection du capital pour les produits présentés. Une évolution négative de la valeur de base génère des pertes correspondantes pour l’ETT. Si, pendant la durée de l’investissement, l’un des sous-jacents du Worst of Kick-In GOAL atteint une seule fois la barrière respective («Kick-In Level») ou est inférieur à celle-ci, et si de plus la fonction Early Redemtion ne s’applique pas, le remboursement par amortissement en espèces à l’échéance est basé sur la performance la plus faible (base Strike) du trio (au maximum toutefois à la valeur nominale majorée du coupon). Dans un tel cas, des pertes sont probables. Par ailleurs, avec les produits structurés, l’investisseur supporte le risque d’émetteur. Cela signifie qu’en cas d’insolvabilité d’UBS SA, le capital investi peut être perdu, indépendamment de l’évolution du sous-jacent.

Vous trouverez davantage de produits UBS et des informations sur les opportunités et les risques à l’adresse ubs.com/keyinvest.

S&P 500™ Information Technology Index vs. S&P 500™ Index 5 ans¹

Le secteur informatique a laissé derrière lui le marché d’actions américain général au cours des cinq dernières années. Le récent recul n’a pas changé grand chose à l’énorme surperformance.

Source: UBS AG, Bloomberg

Valeurs du: 01.11.2018

Alphabet A vs. Microsoft vs. Apple 5 ans¹

Microsoft suit son cours : dans le classement sur cinq ans, l’action logicielle s’en sort même mieux que celle d’Apple. La société Alphabet, mère de Google, n’arrive plus à suivre ce duo.

Source: UBS AG, Bloomberg

Valeurs du: 01.11.2018

¹) La performance passée n’indique pas les résultats futures.
²) Les condition des ETTs sont vérifiés annuellement et peuvent être ajustées avec un délai de 13 mois après la publication.
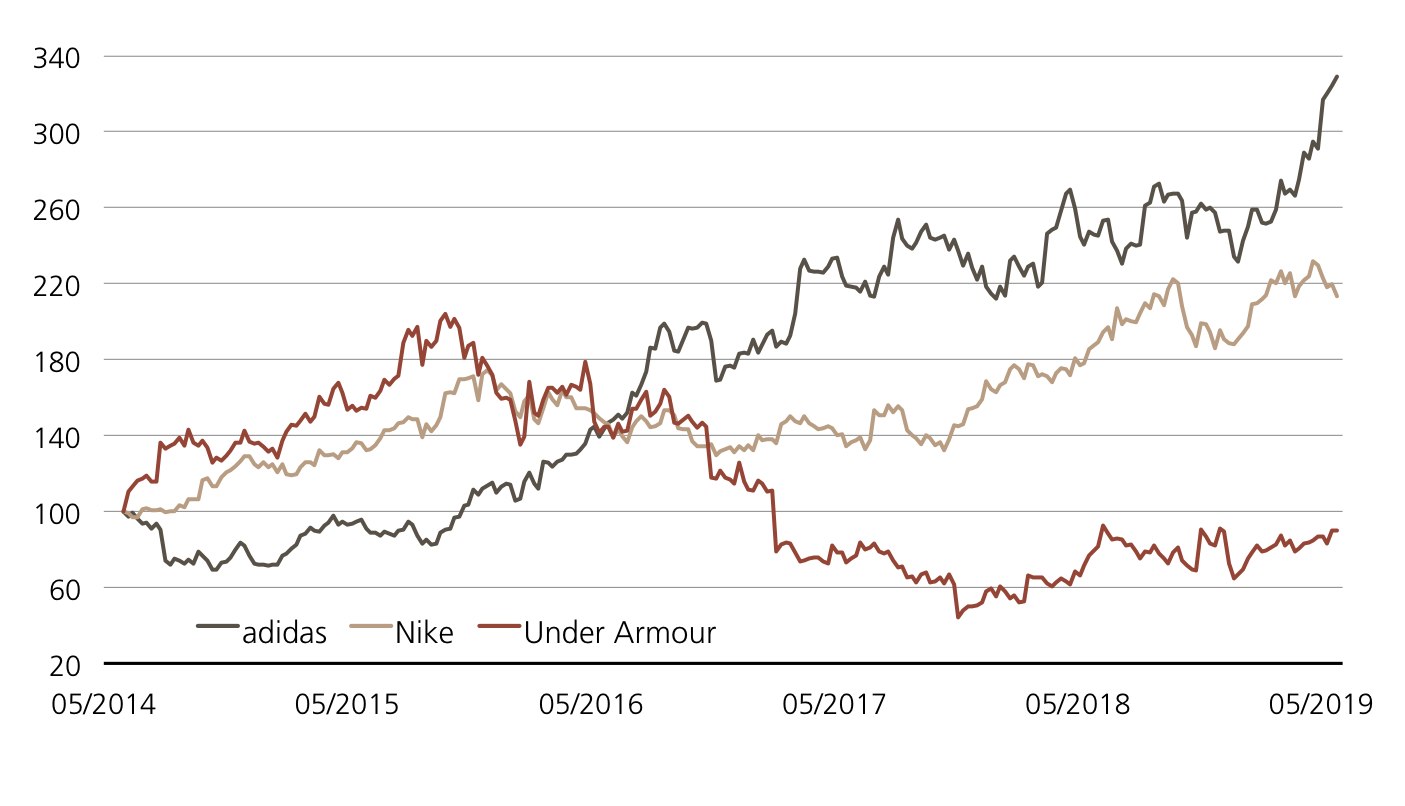
ETT sur S&P 500™ Information Technology Index

Symbol ETINFU
SVSP Name Tracker Certifikat
SPVSP Code 1300
Sous-jacent S&P 500™ Information Technology Index
Devise USD
Rapport de souscription 1:1
Frais de gestion 0.00% p.a.²
Participation 100%
Echéance Open End
Émetteur UBS AG, London
Bid/Ask USD 1’213.00 / 1’215.00
 

9.50% p.a. ER Worst of Kick-In GOAL sur Alphabet / Microsoft / Apple

Symbol KCTKDU
SVSP Name Barrier Reverse Convertible
SPVSP Code 1230 (Auto-Callable)
Sous-jacent Alphabet A / Microsoft / Apple 
Devise USD
Coupon 9.50% p.a.
Kick-In Level 60.00%
Echéance 23.10.2020
Émetteur UBS AG, London
Date de fixation du prix 07.11.2018, 15:00 h
 

Vous trouverez davantage de produits UBS et des informations sur les opportunités et les risques à l’adresse ubs.com/keyinvest.

Source: UBS AG, Bloomberg

Valeurs du: 01.11.2018

Apérçu du marché

Index Citation Semaine¹
SMI™ 9’022.16 3.4%
SLI™ 1’420.48 4.6%
S&P 500™ 2’711.74 2.1%
Euro STOXX 50™ 3’197.51 2.1%
S&P™ BRIC 40 3’787.34 1.1%
CMCI™ Compos. 928.22 -2.2%
Gold (once troy) 1’215.00 USD -1.3%

¹ Changement basé sur le cours de clôture du jour précédent par rapport au cours de clôture de la semaine dernière.

SMI™ vs. VSMI™ 1 année

L’index VSMI™ est calculé depuis 2005. Il affiche la volatilité des actions inclus dans le SMI™ index. Pour la calculation, un portefeuille est utilisé qui ne réagit qu’au variations de la volatilité au lieu des variations des prix. En le faisant, la méthodologie du VSMI™ utilise la volatilité carré, connu sous le terme variance, des options sur le SMI avec 30 jours jusqu’à l’échéance négociées à la Bourse Eurex.

Source: UBS AG, Bloomberg

Valeurs du: 01.11.2018

Métaux industriels
Un trio d’acier

Si, en tant que tout, le marchés des matières premières a connu un développement stable en 2018 jusqu’à ce jour, les signes précurseurs d’alerte dominent pour les métaux industriels. En particulier les inquiétudes au sujet d’un ralentissement conjoncturel, qui vont de pair avec le renforcement du conflit commercial pèsent sur le segment. Même si la demande de métal en soi reste robuste, les actions du secteur sont sous pression. Avec US Steel, ArcelorMittal et Rio Tinto, UBS réunit désormais trois représentants du secteur pour un Callable Worst of Kick-In GOAL (symbole : KCTUDU). Nonobstant l’évolution à venir des cours, le produit verse un coupon de 11.00% p.a. Cette opportunité est couplée à une marge de sécurité de 46%.

Le 16 octobre, la Worldsteel Association a publié ses perspectives de marché à court terme. L’association de banque y prévoit que la demande mondiale d’acier pour l’année en cours augmentera de 3.9% à 1 657,9 millions de tonnes. En 2019, le marché devrait progresser de 1.4 tonnes supplémentaires à 1 681.2 millions de tonnes. De manière peu surprenante, les perspectives prévoient la plus forte hausse de la demande pour 2018 dans les marchés émergents. La hausse attendue s’établit à 5.0% dans la région d’Asie-Océanie, plus forte demandeuse en raison des acquisitions de la Chine. Toutefois, la Worldsteel Association souligne aussi l’augmentation des risques. Outre les tensions commerciales renforcées, les experts évoquent aussi la volatilité des cours de change. (Source : Worldsteel Association, communiqué de presse, 16 octobre 2018)

Et ce sont ces facteurs qui freinent le secteur sur les places boursières. Exemple ArcelorMittal : le plus grand producteur mondial d’acier a perdu sur un mois 20% de sa capitalisation. Dans ce contexte, les analystes de Thomson Reuters prévoient une hausse de 22% des bénéfices du groupe pour l’année courante. On devrait savoir le 1er novembre (après clôture de la rédaction) si et dans quelle mesure cette prévision est réaliste. C’est à cette date qu’ArcelorMittal présentera ses résultats pour le troisième trimestre. Le vendredi 2 novembre, US Steel, un autre représentant important du secteur, publiera son rapport intermédiaire.

Opportunités: outre les deux producteurs d’acier, Rio Tinto a été sélectionné comme sous-jacent pour un nouveau Callable Worst of Kick-In GOAL (symbole : KCTUDU). Le groupe d’exploitation minière fournit notamment du minerai de fer, une matière première essentielle à la fabrication de l’acier. Tant qu’aucune des trois actions n’atteindra ou ne passeras en-dessous de la barrière (basse) de 54% des cours initiaux, le produit structuré produira à l’échéance le rendement maximal correspondant au coupon de 11% p.a. Important : l’émetteur dispose d’un droit de résiliation. S’il utilise la fonction Callable à l’une des deux dates possibles, les propriétaires du produit se verront rembourser le nominal avec le coupon au pro rata par anticipation.

Risques: les Worst of Kick-In GOALS ne bénéficient d’aucune protection du capital. Si, pendant la durée de l’investissement, l’un des sous-jacents atteint une seule fois la barrière respective (« Kick-In Level ») ou est inférieur à celle-ci, et que la fonction de Callable ne s’applique pas, le remboursement à l’échéance par remboursement en espèces est basé sur la performance la plus faible (base Strike) du quatuor (au maximum toutefois à la valeur nominale majorée du coupon). Dans un tel cas, des pertes sont probables. De plus, avec les produits structurés, l’investisseur supporte le risque d’émetteur. Cela signifie qu’en cas d’insolvabilité d’UBS SA, le capital investi peut être perdu, indépendamment de l’évolution des sous-jacents.

Vous trouverez davantage de produits UBS et des informations sur les opportunités et les risques à l’adresse ubs.com/keyinvest.

US Steel vs. ArcelorMittal vs. Rio Tinto 5 ans¹

Source: UBS AG, Bloomberg

Valeurs du: 01.11.2018

11.00% p.a. Callable Worst of Kick-In GOAL sur US Steel / ArcelorMittal / Rio Tinto

Symbol KCTUDU
SVSP Name Barrier Reverse Convertible
SPVSP Code 1230 (Callable)
Sous-jacent US Steel / ArcelorMittal / Rio Tinto
Devise EUR (Quanto)
Coupon 11.00% p.a.
Kick-In Level 54.00%
Echéance 31.10.2019
Émetteur UBS AG, London
Date de fixation du prix 07.11.2018, 15:00 h
 

Vous trouverez davantage de produits UBS et des informations sur les opportunités et les risques à l’adresse ubs.com/keyinvest.

Source: UBS AG, Bloomberg

Valeurs du: 01.11.2018

¹) La performance passée n’indique pas les résultats futures.
²) Les condition des ETTs sont vérifiés annuellement et peuvent être ajustées avec un délai de 13 mois après la publication.

This material has been prepared by UBS AG or one of its affiliates («UBS»). This material is for distribution only as permitted by law. It is not prepared for the needs of any specific recipient. It is published solely for information and is not a solicitation or offer to buy or sell any securities or related financial instruments (“Instruments”). UBS makes no representation or warranty, either express or implied, on the completeness or reliability of the information contained in this document (“Information”) except that concerning UBS AG and its affiliates. The Information should not be regarded by recipients as a substitute for using their own judgment. Any opinions expressed in this material may change without notice and may be contrary to opinions expressed by other business areas of UBS as a result of using different assumptions or criteria. UBS is under no obligation to update the Information. UBS, its officers, employees or clients may have or have had an interest in the Instruments and may at any time transact in them. UBS may have or have had a relationship with entities referred to in the Information. Neither UBS nor any of its affiliates, or their officers or employees, accepts any liability for any loss arising from use of the Information. This presentation is not a basis for entering into a transaction. Any transaction between you and UBS will be subject to the detailed provisions of the term sheet, confirmation or electronic matching systems relating to that transaction. Clients wishing to effect transactions should contact their local sales representative.
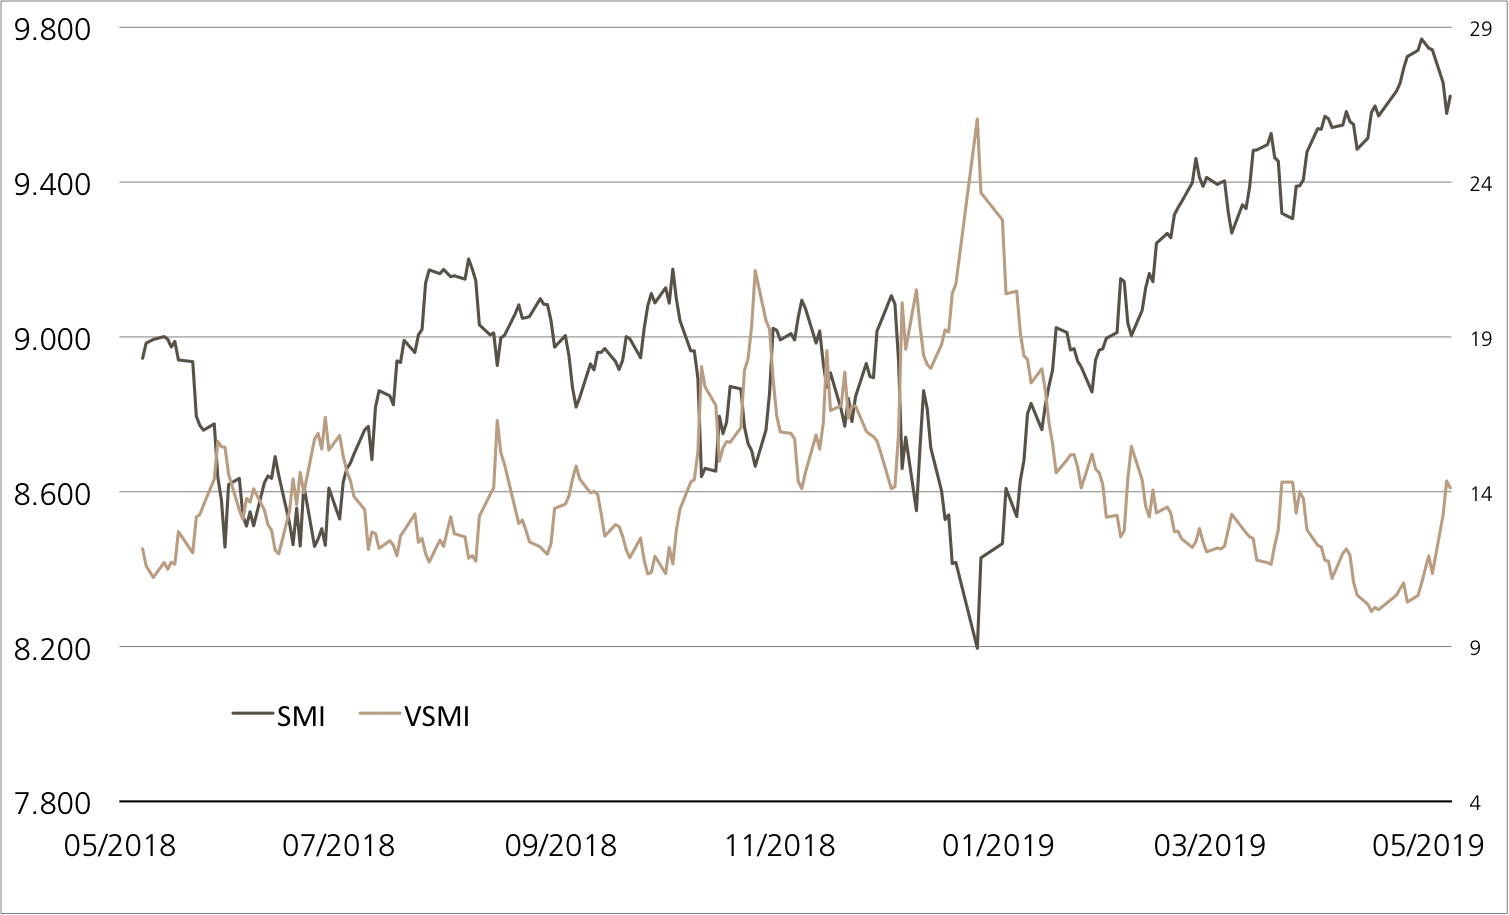
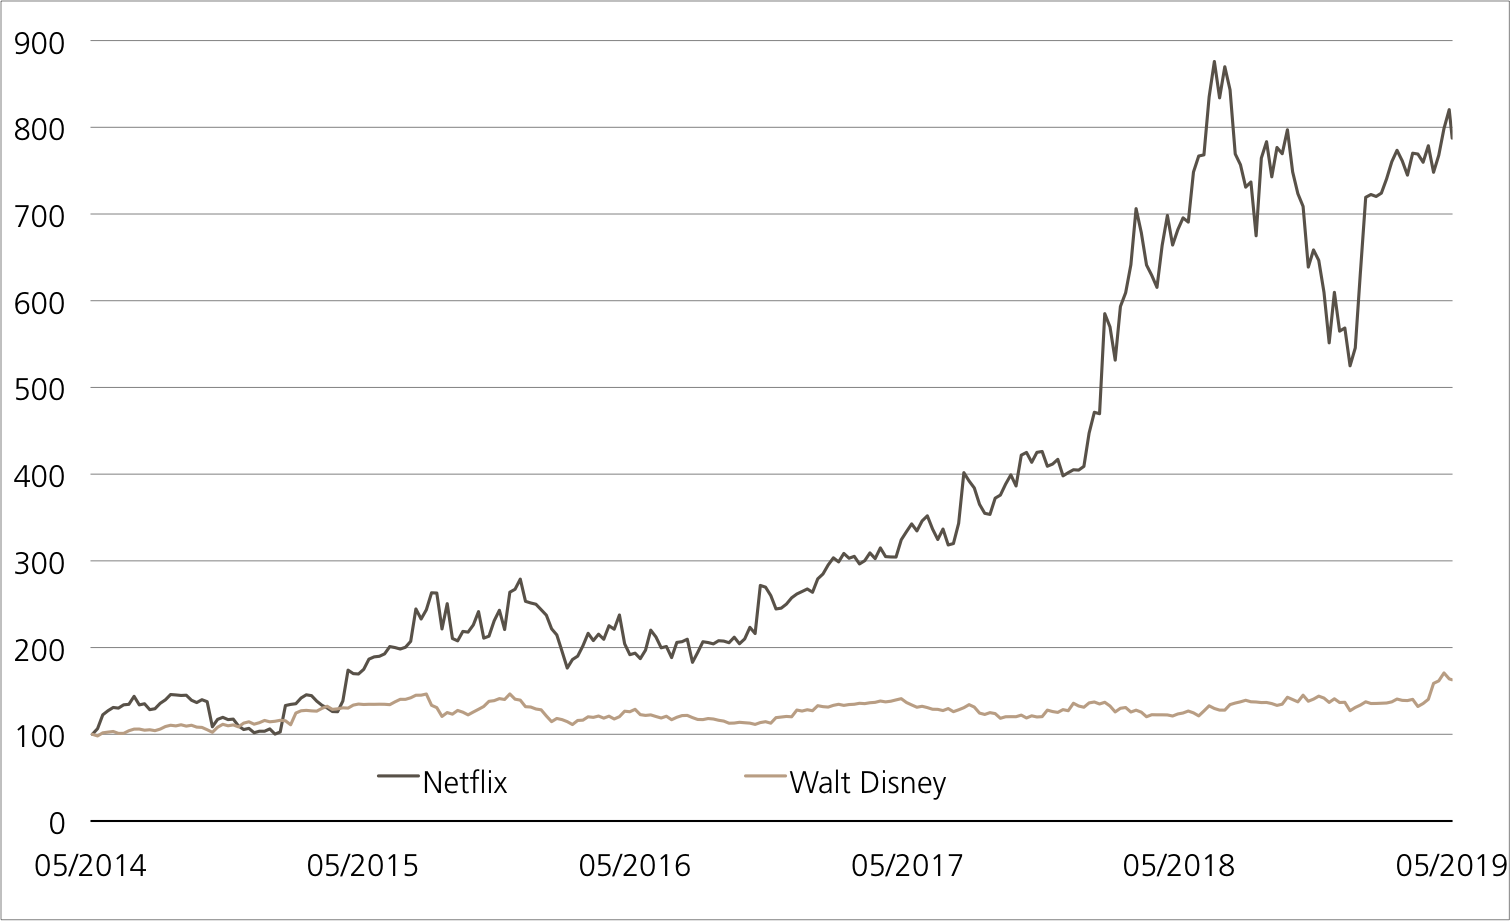
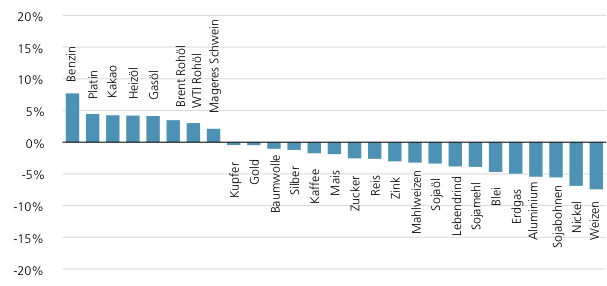
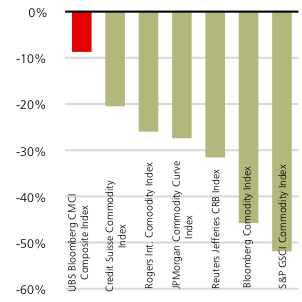
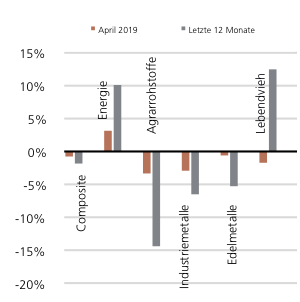
This information is communicated by UBS AG and/or its affiliates («UBS»). * (see below) UBS may from time to time, as principal or agent, have positions in, or may buy or sell, or make a market in any securities, currencies, financial instruments or other assets underlying the product to which this website relates (the «Structured Product»). UBS may provide investment banking and other services to and/or have officers who serve as directors of the companies referred to in this website. UBS’s trading and/or hedging activities related to the Structured Product may have an impact on the price of the underlying asset and may affect the likelihood that any relevant barrier or relevant trigger event is crossed or triggered. UBS has policies and procedures designed to minimise the risk that officers and employees are influenced by any conflicting interest or duty and that confidential information is improperly disclosed or made available. UBS may pay or receive brokerage or retrocession fees in connection with the Structured Product described herein. In respect of any Structured Product that is a security, UBS may, in certain circumstances, sell the Structured Product to dealers and other financial institutions at a discount to the issue price or rebate to them for their own account some proportion of the issue price. Further information is available on request. Structured Products are complex and may involve a high risk of loss. Prior to purchasing the Structured Product you should consult with your own legal, regulatory, tax, financial and accounting advisors to the extent you consider it necessary, and make your own investment, hedging and trading decisions (including decisions regarding the suitability of the Structured Product) based upon your own judgement and advice from those advisers you consider necessary. Save as otherwise expressly agreed in writing, UBS is not acting as your financial adviser or fiduciary in relation to the Product. UBS generally hedges its exposure to Structured Products, although it may elect not to hedge or to partially hedge any Structured Product. UBS’s hedging activity may be conducted through transactions in the underlying asset, index or instrument or in options, futures or other derivatives related to the underlying asset, index or instrument on publicly traded markets or otherwise, and may have an impact on the price of the under-lying asset. If a transaction is cash settled, UBS will generally unwind or offset any hedge it has for such Structured Product in close proximity to the relevant valuation time or period. In some cases, this activity may affect the value of the Structured Product. Unless stated otherwise in this document, (i) this document is for information purposes only and should not be construed as an offer, personal recommendation or solicitation to purchase the Structured Product and should not be treated as giving investment advice, and (ii) the terms of any investment in the Structured Product will be exclusively subject to the detailed provisions, including risk considerations, contained in the more detailed legal documentation that relates to the Structured Product (being the confirmation, information memorandum, prospectus or other issuer documentation as relevant). UBS makes no representation or warranty relating to any information herein which is derived from independent sources. This document shall not be copied or reproduced without UBS’s prior written permission. In respect of any Structured Product that is a security, no action has been or will be taken in any jurisdiction that would permit a public offering of the Product, save where explicitly stated in the issuer documentation. The Structured Product must be sold in accordance with all applicable selling restrictions in the jurisdictions in which it is sold.
© UBS 2018. All rights reserved. UBS prohibits the forwarding of this information without the approval of UBS.
Weekly-Hits édition de 02.11.20182018-11-02T10:38:50+01:00

Weekly-Hits edition of 02.11.2018

KeyInvest Weekly Hits

Friday, 02.11.2018

  • Topic 1: US Information Technology - The Moment of Truth
  • Topic 2: Industrial metals - A steely trio

US Information Technology
The Moment of Truth

The reporting season on Wall Street is in full swing. Quarterly results from Apple out this Thursday (after the US market closes) mark the high point of the current slew of numbers. Even though the figures we have already seen from the US tech sector have mostly been ahead of expectations, prices have been under pressure recently. The S&P 500™ Information Technology Index has fallen by 10.9% from all its all-time high at the start of the month.1 Investors who see this setback as a chance to get on board can use an ETT (symbol: ETINFU). The participation product replicates the S&P 500™ Information Technology Index with no time limitation and no management fees.2 An alternative to a 1:1 investment in the US IT sector is the Early Redemption (ER) Worst of Kick-In GOAL on Alphabet, Microsoft and Apple. The subscription product has a 9.5% annual coupon. The barriers are set at a low 60% of the initial prices of the sector trio.

Soon after the closing bell on Wall Street, on Thursday evening (after editorial deadline) a release from Apple will come over the ticker. The world’s largest listed company is announcing its results for the fourth quarter of its fiscal year 2017/2018 (to 30 September). CEO Tim Cook and his management team will also be holding a conference call at 10:00pm CET to talk in detail about recent business performance and the outlook for the key Christmas quarter. The sheer size alone of the iPhone manufacturer means the quarterly numbers are hugely important for Wall Street.

According to FactSet, profit announcements from IT companies in the earnings season so far have in general been one-tenth ahead of average analyst expectations. Of all sectors in the US, information technology has shown the second-largest beats. In the trading week to 26 October, consensus forecast earnings growth for the third quarter rose from 17.0% to 21.9%. Microsoft and Intel had a major influence on the upgrade. The two groups reported earnings per share for the past quarter 18.8% and 21.7% ahead of expectations respectively. (Source: FactSet, Earnings Insight, 26 October 2018.)

Opportunities: The exchange traded tracker (ETT) (symbol: ETINFU) passively replicates the 65 stocks in the S&P 500™ Information Technology Index. Investors can use the liquid product to anticipate a rebound in the sector benchmark. A longer-term buy and hold strategy is also possible. Alphabet, along with Apple and Microsoft, is one of the underlyings for a new ER Worst of Kick-In GOAL (symbol: KCTKDU). An index reshuffle recently removed the Google parent company from the IT sector and put it in communication services. This has no impact on the opportunities for the subscription product: as long as none of the underlyings touch or fall below the 60% barrier, the investment ends with an annual return of 9.50%. The early redemption feature means early repayment with pro rata coupon is possible. This is conditional on all of Alphabet, Apple and Microsoft closing at or above the starting level on one of the quarterly observation days (first date: 7 November 2019).

Risks: The aforementioned products do not have capital protection. Should the underlying assets deliver a negative performance; the ETT will incur commensurate losses. If the underlyings on the Kick-In GOAL touch or fall below the respective Kick-In Level (barrier) and the early redemption feature does not apply, the amount repaid on the maturity date is reflecting the worst performance of the underlyings (but not more than notional value plus coupon). In this case, it is likely that losses will be incurred. Investors in structured products are also exposed to issuer risk, which means that the capital invested may be lost if UBS AG becomes insolvent, regardless of the performance of the underlying.

More UBS products and further information on the risks and opportunities are available at ubs.com/keyinvest.

S&P 500™ Information Technology Index vs. S&P 500™ Index five years¹

Over the last five year, the IT sector has outperformed the broad US equity market by a considerable distance. The most recent correction has done little to reduce this massive differential.

Source: UBS AG, Bloomberg

As of 01.11.2018

Alphabet A vs. Microsoft vs. Apple five years¹

Microsoft enjoys a run: over five years the software stock has even done slightly better than Apple. Google
parent company Alphabet can no longer keep up with those two.

Source: UBS AG, Bloomberg

As of: 01.11.2018

¹) Please be aware that past performance does not indicate future results.
²) The conditions of ETTs are reviewed on a yearly basis and can be adjusted with a deadline of 13 months after the announcement.

ETT on S&P 500™ Information Technology Index

Symbol ETINFU
SVSP Name Tracker Certifikat
SPVSP Code 1300
Underlying S&P 500™ Information Technology Index
Currency USD
Ratio 1:1
Administration fee 0.00% p.a.²
Participation 100%
Expiry Open End
Issuer UBS AG, London
Bid/Ask USD 1’213.00 / 1’215.00
 

9.50% p.a. ER Worst of Kick-In GOAL auf Alphabet / Microsoft / Apple

Symbol KCTKDU
SVSP Name Barrier Reverse Convertible
SPVSP Code 1230 (Auto-Callable)
Underlying Alphabet A / Microsoft / Apple 
Currency USD
Coupon 9.50% p.a.
Kick-In Level 60.00%
Expiry 23.10.2020
Issuer UBS AG, London
Subscription until 07.11.2018, 15:00 h
 

More UBS products and further information on the risks and opportunities are available at ubs.com/keyinvest.

Source: UBS AG, Bloomberg

As of: 01.11.2018

Market overview

Index Quotation Week¹
SMI™ 9’022.16 3.4%
SLI™ 1’420.48 4.6%
S&P 500™ 2’711.74 2.1%
Euro STOXX 50™ 3197.51 2.1%
S&P™ BRIC 40 3’787.34 1.1%
CMCI™ Compos. 928.22 -2.2%
Gold (troy ounce) 1’215.00 USD -1.3%

¹ Change based on the closing price of the previous day compared to the closing price a week ago.

SMI™ vs. VSMI™ 1 year

smi vs vsmi

The VSMI™ Index is calculated since 2005. It shows the volatility of the stocks within the SMI™ index. A portfolio which reacts only to changes in volatility instead of volatility itself is relevant for the calculation. Thereby, the VSMI™ methodology uses the squared volatility, known as variance, of the SMI options with remaining time to expiry of 30 days traded at the Eurex.

Source: UBS AG, Bloomberg

As of: 01.11.2018

Industrial metals
A steely trio

The commodity market overall has been stable year to date, but industrial metals stocks are mostly down. The segment has been hit by concerns about an economic slowdown as a result of the burgeoning trade dispute. Although actual demand for metal continues to be robust, stocks in the sector are under pressure. UBS has combined three sector representatives (US Steel, ArcelorMittal and Rio Tinto) in a Callable Worst of Kick-In GOAL (symbol: KCTUDU). The product pays an annual coupon of 11.00% regardless of price performance. This opportunity comes with a 46% safety buffer.

On 16 October, the World Steel Association published its short-term market outlook. They assume that global demand for steel will rise by 3.9% to 1,657.9 million tonnes this year. In 2019, the market will grow a further 1.4% to 1,681.2 million tonnes. Not surprisingly, the 2018 forecast sees the largest increase in demand in emerging markets. Growth in Asia-Oceania, the largest market for sales due to Chinese demand, is expected to be 5.0%. However, the association also points out that risks have risen too, mentioning rising trade tensions and volatile exchange rates. (Source: World Steel Association, press release, 16 October 2018)

These are precisely the factors holding the sector back on the stock market. Take ArcelorMittal: the world’s largest steel producer lost 20% of its capitalization in a month. According to Thomson Reuters, analysts expect the group to boost profit by 22% this year. Whether and to what extent this is realistic will become clearer on 1 November (after our publication deadline). That is when the company releases its third quarter figures. On Friday 2 November US Steel, another major sector player, announces its quarterly earnings.

Opportunities: The two steel producers and Rio Tinto have been selected as the underlyings for a new Callable Worst of Kick-In GOAL (symbol: KCTUDU). One of the miner’s products is iron ore, a key input for making steel. Provided none of the three stocks touch or fall below the barrier at a low 54% of the initial prices, the structured product pays a maximal return in line with the 11.00% annual coupon on maturity. Important: The issuer has a call option. If it exercises the callable function on one of two possible dates, holders receive nominal plus the pro rata coupon.

Risks: Kick-In GOALs do not have capital protection. If the underlyings touch or fall below the respective Kick-In Level (barrier) and the callable feature does not apply, the amount repaid on the maturity date is reflecting the worst performance of the underlyings (but not more than notional value plus coupon). In this case, it is likely that losses will be incurred. Investors in structured products are also exposed to issuer risk, which means that the capital invested may be lost if UBS AG becomes insolvent, regardless of the performance of the underlying.

More UBS products and further information on the risks and opportunities are available at ubs.com/keyinvest.

US Steel vs. ArcelorMittal vs. Rio Tinto 5 years¹

Source: UBS AG, Bloomberg

As of: 01.11.2018

11.00% p.a. Callable Worst of Kick-In GOAL on US Steel / ArcelorMittal / Rio Tinto

Symbol KCTUDU
SVSP Name Barrier Reverse Convertible
SPVSP Code 1230 (Callable)
Underlyings US Steel / ArcelorMittal / Rio Tinto
Currency EUR (Quanto)
Coupon 11.00% p.a.
Kick-In Level 54.00%
Expiry 31.10.2019
Issuer UBS AG, London
Subscription until 07.11.2018, 15:00 h
 

More UBS products and further information on the risks and opportunities are available at ubs.com/keyinvest.

Source: UBS AG, Bloomberg

As of: 01.11.2018

¹) Please be aware that past performance does not indicate future results.
²) The conditions of ETTs are reviewed on a yearly basis and can be adjusted with a deadline of 13 months after the announcement.

This material has been prepared by UBS AG or one of its affiliates («UBS»). This material is for distribution only as permitted by law. It is not prepared for the needs of any specific recipient. It is published solely for information and is not a solicitation or offer to buy or sell any securities or related financial instruments (“Instruments”). UBS makes no representation or warranty, either express or implied, on the completeness or reliability of the information contained in this document (“Information”) except that concerning UBS AG and its affiliates. The Information should not be regarded by recipients as a substitute for using their own judgment. Any opinions expressed in this material may change without notice and may be contrary to opinions expressed by other business areas of UBS as a result of using different assumptions or criteria. UBS is under no obligation to update the Information. UBS, its officers, employees or clients may have or have had an interest in the Instruments and may at any time transact in them. UBS may have or have had a relationship with entities referred to in the Information. Neither UBS nor any of its affiliates, or their officers or employees, accepts any liability for any loss arising from use of the Information. This presentation is not a basis for entering into a transaction. Any transaction between you and UBS will be subject to the detailed provisions of the term sheet, confirmation or electronic matching systems relating to that transaction. Clients wishing to effect transactions should contact their local sales representative.
This information is communicated by UBS AG and/or its affiliates («UBS»). * (see below) UBS may from time to time, as principal or agent, have positions in, or may buy or sell, or make a market in any securities, currencies, financial instruments or other assets underlying the product to which this website relates (the «Structured Product»). UBS may provide investment banking and other services to and/or have officers who serve as directors of the companies referred to in this website. UBS’s trading and/or hedging activities related to the Structured Product may have an impact on the price of the underlying asset and may affect the likelihood that any relevant barrier or relevant trigger event is crossed or triggered. UBS has policies and procedures designed to minimise the risk that officers and employees are influenced by any conflicting interest or duty and that confidential information is improperly disclosed or made available. UBS may pay or receive brokerage or retrocession fees in connection with the Structured Product described herein. In respect of any Structured Product that is a security, UBS may, in certain circumstances, sell the Structured Product to dealers and other financial institutions at a discount to the issue price or rebate to them for their own account some proportion of the issue price. Further information is available on request. Structured Products are complex and may involve a high risk of loss. Prior to purchasing the Structured Product you should consult with your own legal, regulatory, tax, financial and accounting advisors to the extent you consider it necessary, and make your own investment, hedging and trading decisions (including decisions regarding the suitability of the Structured Product) based upon your own judgement and advice from those advisers you consider necessary. Save as otherwise expressly agreed in writing, UBS is not acting as your financial adviser or fiduciary in relation to the Product. UBS generally hedges its exposure to Structured Products, although it may elect not to hedge or to partially hedge any Structured Product. UBS’s hedging activity may be conducted through transactions in the underlying asset, index or instrument or in options, futures or other derivatives related to the underlying asset, index or instrument on publicly traded markets or otherwise, and may have an impact on the price of the under-lying asset. If a transaction is cash settled, UBS will generally unwind or offset any hedge it has for such Structured Product in close proximity to the relevant valuation time or period. In some cases, this activity may affect the value of the Structured Product. Unless stated otherwise in this document, (i) this document is for information purposes only and should not be construed as an offer, personal recommendation or solicitation to purchase the Structured Product and should not be treated as giving investment advice, and (ii) the terms of any investment in the Structured Product will be exclusively subject to the detailed provisions, including risk considerations, contained in the more detailed legal documentation that relates to the Structured Product (being the confirmation, information memorandum, prospectus or other issuer documentation as relevant). UBS makes no representation or warranty relating to any information herein which is derived from independent sources. This document shall not be copied or reproduced without UBS’s prior written permission. In respect of any Structured Product that is a security, no action has been or will be taken in any jurisdiction that would permit a public offering of the Product, save where explicitly stated in the issuer documentation. The Structured Product must be sold in accordance with all applicable selling restrictions in the jurisdictions in which it is sold.
© UBS 2018. All rights reserved. UBS prohibits the forwarding of this information without the approval of UBS.
Weekly-Hits edition of 02.11.20182018-11-02T09:49:19+01:00

Weekly-Hits Ausgabe vom 01.11.2018


KeyInvest Weekly Hits
Donnerstag, 01.11.2018
  • Thema 1: US-Information Technology – Die Zeit der Wahrheit
  • Thema 2: Industriemetalle – Ein stahlhartes Trio

US-Information Technology
Die Zeit der Wahrheit

An der Wall Street ist die Berichtssaison in vollem Gange. Mit dem Zwischenbericht von Apple steht am heutigen Donnerstag (nach US-Börsenschluss) ein absoluter Höhepunkt der laufenden Zahlenflut an. Obwohl die bereits vorliegenden Resultate aus dem US-Technologiesektor grösstenteils über den Erwartungen lagen, standen die Kurse zuletzt unter Druck. Gegenüber dem Anfang Monat erreichten Allzeithoch gab der S&P 500™ Information Technology Index um 8.8 Prozent nach.¹ Anleger, die in dem Rücksetzer eine Einstiegschance sehen, können zu einem ETT (Symbol: ETINFU) greifen. Das Partizipationsprodukt bildet den S&P 500™ Information Technology Index ohne Laufzeitbegrenzung und frei von Verwaltungsgebühren² ab. Eine Alternative zum 1:1-Investment in den US-IT-Sektor bietet der Early Redemption (ER) Worst of Kick-In GOAL auf Alphabet, Microsoft und Apple. Das Zeichnungsprodukt ist mit einem Coupon in Höhe von 9.50 Prozent p.a. ausgestattet. Die Barrieren werden bei tiefen 60 Prozent der Anfangsnotierungen des Branchentrios fixiert.

Kurz nachdem heute Abend die Schlussglocke an der Wall Street ertönt, wird eine Meldung von Apple über den Ticker laufen. Der grösste Börsenkonzern der Welt veröffentlicht die Resultate des vierten Quartals der Geschäftsperiode 2017/18 (per 30. September). Darüber hinaus wird das Management um CEO Tim Cook ab 22:00 Uhr Mitteleuropäischer Zeit in einer Telefonkonferenz ausführlich zum jüngsten Geschäftsgang sowie der Prognose für das wichtige Weihnachtsquartal Stellung nehmen. Allein aufgrund der schieren Grösse des iPhone-Herstellers ist der Zwischenbericht für die Wall Street von enormer Bedeutung.
 
Laut Factset lagen die in der bisherigen «Earnings Season» von den IT-Unternehmen präsentierten Gewinne im Schnitt um ein Zehntel über den durchschnittlichen Analystenschätzungen. Damit zeigt die Information Technology unter allen US-Sektoren die zweitgrösste Abweichung nach oben. In der am 26. Oktober zu Ende gegangenen Handelswoche nahm der Konsens für das im dritten Quartal erwartete Gewinnwachstum von 17.0 auf 21.9 Prozent zu. Microsoft und Intel hatten einen massgeblichen Einfluss an der Aufwärtsrevision. Das von den beiden Konzernen für das abgelaufene Vierteljahr gemeldete Ergebnis je Aktie lag um 18.8 respektiv 21.7 Prozent über den Erwartungen. (Quelle: Factest, «Earnings Insight», 26.10.2018)


Chancen:
Der Exchange Traded Tracker (ETT) (Symbol: ETINFU) bildet den mit insgesamt 65 Aktien bestückten S&P 500™ Information Technology Index passiv ab. Anleger können mit dem liquiden Produkt auf einen Rebound beim Sektorbenchmark setzen. Auch eine längerfristige «Buy-and-Hold»-Strategie ist möglich. Zusammen mit Apple und Microsoft fungiert Alphabet als Basiswert für einen neuen ER Worst of Kick-In GOAL (Symbol: KCTKDU). Im Rahmen einer Indexreform wurde die Google-Mutter kürzlich dem IT-Sektor entnommen und dafür dem Bereich «Communication Services» zugeordnet. Der Chance des Zeichnungsprodukts tut das keinen Abbruch: Solange kein Basiswert auf oder unter die Barriere von 60 Prozent fällt, endet das Investment mit einer Rendite von 9.50 Prozent p.a. Aufgrund der Early Redemption Funktion ist eine vorzeitige Tilgung samt anteiligen Coupon möglich. Voraussetzung: Alphabet, Apple und Microsoft schliessen an einem der vierteljährlichen Beobachtungstage (erster Termin: 7.11.2019) allesamt auf oder über dem Startniveau.

Risiken:
Die vorgestellten Produkte sind nicht kapitalgeschützt. Eine negative Entwicklung des Basiswerts führt beim ETT zu entsprechenden Verlusten. Notiert einer der Basiswerte beim Worst of Kick-In GOAL während der Laufzeit einmal auf oder unter dem jeweiligen Kick-In Level (Barriere) und kommt zudem des Early Redemption Feature nicht zum tragen, kann die Rückzahlung am Verfalltag durch Bartilgung entsprechend der (vom Strike aus) schwächsten Performance aus dem Trio erfolgen (höchstens jedoch zum Nominalwert zuzüglich Coupon). In diesem Fall sind Verluste wahrscheinlich. Zudem trägt der Anleger bei Strukturierten Produkten das Emittentenrisiko, so dass das eingesetzte Kapital – unabhängig von der Entwicklung des Basiswertes – im Falle einer Insolvenz der UBS AG verloren gehen kann.

Weitere UBS Produkte sowie Informationen zu Chancen und Risiken finden Sie unter ubs.com/keyinvest.
 
 
S&P 500™ Information Technology Index vs. S&P 500™ Index 5 Jahre¹
Der IT-Sektor hat den breiten US-Aktienmarkt in den vergangenen fünf Jahren um Längen abgehängt. An der enormen Outperformance hat der jüngste Kursrücksetzer kaum etwas geändert.
 
Quelle: UBS AG, Bloomberg
Stand: 31.10.2018

Alphabet A vs. Microsoft vs. Apple 5 Jahre¹
Microsoft hat einen Lauf: Im Fünf-Jahres-Ranking schneidet die Softwareaktie sogar etwas besser ab, als Branchenkrösus Apple. Die Google-Mutter Alphabet kann nicht mehr mit dem Duo Schritt halten.
 
Quelle: UBS AG, Bloomberg
Stand: 31.10.2018

 
¹) Bitte beachten Sie, dass vergangene Wertentwicklungen keine Indikationen für künftige Wertentwicklungen sind.
²) Die Konditionen der ETTs werden jährlich überprüft und können mit einer Frist von 13 Monaten nach Bekanntgabe angepasst werden
 
ETT auf den S&P 500™ Information Technology Index

Symbol ETINFU
SVSP Name Tracker-Zertifikat
SPVSP Code 1300
Basiswert S&P 500™ Information Technology Index
Bezugsverhältnis 1:1
Handelswährung USD
Verwaltungsgebühr 0.00% p.a.²
Partizipation 100%
Verfall Open End
Emittentin UBS AG, London
Geld-/Briefkurs USD 1’213.00 / 1’215.00
 

9.50% p.a. ER Worst of Kick-In GOAL auf Alphabet / Microsoft / Apple

Symbol KCTKDU
SVSP Name Barrier Reverse Convertible
SPVSP Code 1230 (Auto-Callable)
Basiswerte Alphabet A / Microsoft / Apple 
Handelswährung USD
Coupon 9.50% p.a.
Kick-In Level (Barriere)
60.00%
Verfall 23.10.2020
Emittentin UBS AG, London
Zeichnung bis 07.11.2018, 15:00 Uhr
 

Weitere Produkte sowie Informationen zu Chancen und Risiken finden Sie unter: ubs.com/keyinvest Quelle: UBS AG Stand: 31.10.2018
 
Marktübersicht
Index Stand Woche¹
SMI™ 9’022.16 Pkt. 3.4%
SLI™ 1’420.48 Pkt. 4.6%
S&P 500™ 2’711.74 Pkt. 2.1%
EURO STOXX 50™ 3197.51 Pkt. 2.1%
S&P™ BRIC 40 3’787.34 Pkt. 1.1%
CMCI™ Compos. 928.22 Pkt. -2.2%
Gold (Feinunze) 1’215.00 USD -1.3%

SMI™ vs. VSMI™ 1 Jahr

 
¹ Veränderung auf Basis des Schlusskurses des Vortages im Vergleich zum Schlusskurs vor einer Woche.
Der VSMI™ Index wird seit 2005 berechnet. Er zeigt die Volatilität der im SMI™ Index enthaltenen Aktien. Massgeblich für die Berechnung ist ein Portfolio, welches nicht auf Preisschwankungen, sondern ausschliesslich auf Veränderungen der Volatilität reagiert. Dabei greift die VSMI™ Methodik auf die quadrierten Volatilitäten, im Fachjargon „Varianzen“, der an der Eurex gehandelten SMI-Optionen mit einer konstanten Restlaufzeit von 30 Tagen zurück.


Industriemetalle
Ein stahlhartes Trio

 
Während sich der Rohstoffmarkt als Ganzes 2018 bis dato in etwa stabil entwickelt hat, dominieren bei den Industriemetallen die roten Vorzeichen. Insbesondere die mit dem schwelenden Handelsstreit einhergehenden Sorgen vor einem Konjunkturabschwung lasten auf dem Segment. Obwohl die tatsächliche Metallnachfrage weiterhin robust ausfällt, stehen auch die Aktien des Sektors unter Druck. Mit US Steel, ArcelorMittal und Rio Tinto bringt UBS jetzt drei Branchenvertreter für einen Callable Worst of Kick-In GOAL (Symbol: KCTUDU) zusammen. Ungeachtet der weiteren Kursentwicklung zahlt das Produkt einen Coupon von 11.00 Prozent p.a. Diese Chance ist an ein Sicherheitspolster von 46 Prozent gekoppelt.
 
Am 16. Oktober hat die Worldsteel Association ihren kurzfristigen Marktausblick publiziert. Darin geht die Branchenvereinigung davon aus, dass die weltweite Stahlnachfrage im laufenden Jahr um 3.9 Prozent auf 1’657.9 Millionen Tonnen zunehmen wird. 2019 soll der Markt um weitere 1.4 Prozent auf dann 1’681.2 Millionen Tonnen wachsen. Wenig überraschend sieht die Prognose für 2018 in den Emerging Markets den höchsten Nachfrageanstieg. In der wegen Chinas Nachfrage grössten Abnehmerregion Asien-Ozeanien beträgt das erwartete Wachstum 5.0 Prozent. Allerdings weisst die Worldsteel Association auch auf gestiegene Risiken hin. Die Experten nennen neben den wachsenden Handelsspannungen die volatilen Wechselkurse. (Quelle: worldsteel Association, Medienmitteilung, 16. Oktober 2018)
 
Eben diese Faktoren bremsen den Sektor an der Börse aus. Beispiel ArcelorMittal: Der weltgrösste Stahlproduzent büsste auf Sicht von einem Monat 17.8 Prozent seiner Kapitalisierung ein. Dabei gehen Analysten laut Thomson Reuters momentan davon aus, dass der Konzern seinen Gewinn im laufenden Jahr um 22 Prozent steigert. Ob und inwieweit diese Erwartung realistisch ist, dürfte sich ein Stück weit am 1. November (nach Redaktionsschluss) zeigen. Dann präsentiert ArcelorMittal die Zahlen für das dritte Quartal. Am Freitag, 2. November veröffentlicht mit US Steel ein weiterer wichtiger Branchenvertreter seinen Zwischenbericht.
 

Chancen:
Neben den beiden Stahlkochern wurde Rio Tinto als Basiswert für einen neuen Callable Worst of Kick-In GOAL (Symbol: KCTUDU) ausgewählt. Der Bergbaukonzern liefert unter anderem Eisenerz, einen zentralen Grundstoff für die Stahlherstellung. Solange keine der drei Aktien auf oder unter die Barriere von tiefen 54 Prozent der Anfangskurse fällt, wirft das Strukturierte Produkt am Laufzeitende die dem Coupon entsprechende Maximalrendite von 11.00 Prozent p.a. ab. Wichtig: Die Emittentin verfügt über ein Kündigungsrecht. Macht sie an einem von zwei möglichen Terminen von der Callable-Funktion Gebrauch, erhalten Produktinhaber das Nominal mitsamt dem anteiligen Coupon vorzeitig zurück.

Risiken:
Worst-of Kick-In GOALs sind nicht kapitalgeschützt. Notiert einer der Basiswerte während der Laufzeit einmal auf oder unter dem jeweiligen Kick-In Level (Barriere) und kommt zudem das Callable Feature nicht zum tragen, kann die Rückzahlung am Verfalltag durch Bartilgung entsprechend der (vom Strike aus) schwächsten Performance aus dem Trio erfolgen (höchstens jedoch zum Nominalwert zuzüglich Coupon). In diesem Fall sind Verluste wahrscheinlich. Zudem trägt der Anleger bei den Strukturierten Produkten das Emittentenrisiko, so dass das eingesetzte Kapital – unabhängig von der Entwicklung der Basiswerte – im Falle einer Insolvenz der UBS AG verloren gehen kann.
Weitere UBS Produkte sowie Informationen zu Chancen und Risiken finden Sie unter ubs.com/keyinvest.
 
US Steel vs. ArcelorMittal vs. Rio Tinto 5 Jahre¹
Quelle: UBS AG, BloombergStand: 31.10.2018

 
11.00% p.a. Callable Worst of Kick-In GOAL auf US Steel / ArcelorMittal / Rio Tinto
Symbol KCTUDU
SVSP Name Barrier Reverse Convertible
SPVSP Code 1230 (Callable)
Basiswert US Steel / ArcelorMittal / Rio Tinto
Handelswährung EUR (Quanto)
Coupon 11.00% p.a.
Kick-In Level (Barriere) 54.00%
Verfall 31.10.2019
Emittentin UBS AG, London
Zeichnung bis 07.11.2018, 15:00 Uhr
 

Termsheet Weitere Produkte sowie Informationen zu Chancen und Risiken finden Sie unter: ubs.com/keyinvest   Quelle: UBS AG Stand: 31.10.2018

 
¹) Bitte beachten Sie, dass vergangene Wertentwicklungen keine Indikationen für künftige Wertentwicklungen sind.
²) Die Konditionen der ETTs werden jährlich überprüft und können mit einer Frist von 13 Monaten nach Bekanntgabe angepasst werden


Die in diesem Dokument enthaltenen Informationen werden ausschliesslich zu Informations- und Werbezwecken zur Verfügung gestellt und stellen weder Empfehlungen noch Anlageberatung von UBS AG, einer ihrer Tochtergesellschaften oder verbundenen Unternehmen («UBS») dar. Dieses Dokument wird nicht von einer UBS Research Abteilung ausgegeben und ist deshalb nicht als unabhängige Anlageforschung zu erachten. Es stellt weder einen Verkaufsprospekt, noch ein Angebot oder eine Einladung zur Offertenstellung dar, irgendeine Art von Anlage zu tätigen. Beachten Sie bitte, dass die Anlagebeispiele die Ansichten von UBS Research möglicherweise nicht vollständig wiedergeben. Dieses Dokument und die darin beschriebenen Produkte und Dienstleistungen sind allgemeiner Natur und beziehen sich weder auf die persönlichen Anlageziele noch die finanzielle Situation oder besonderen Bedürfnisse eines spezifischen Empfängers. Anlageentscheide sollten stets im Portfoliokontext getroffen werden und Ihre persönliche Situation und Ihre entsprechende Risikobereitschaft und Risikofähigkeit berücksichtigen. Sie werden hiermit auf diese Risiken (die mitunter erheblich sein können) hingewiesen. Bevor Sie einen Anlageentscheid treffen, lesen Sie bitte die spezifischen Produkteinformationen und die Broschüre «Besondere Risiken im Effektenhandel». Bitte kontaktieren Sie Ihren Kundenberater, der Sie gerne bei Ihren Anlageideen unterstützt und Ihnen die spezifischen Produktinformationen zur Verfügung stellt. UBS übernimmt diesbezüglich keinerlei Haftung für das Verhalten von Dritten. Wir weisen Sie darauf hin, dass sich UBS das Recht vorbehält, Dienstleistungen, Produkte und Preise jederzeit ohne vorhergehende Ankündigung zu ändern, und dass sich die wiedergegebenen Informationen und Meinungen jederzeit ändern können. Es wird weder eine ausdrückliche noch stillschweigende Gewährleistung oder Garantie in Bezug auf die Richtigkeit, Vollständigkeit oder Verlässlichkeit der wiedergegebenen Informationen abgegeben, es sei denn, es handelt sich um Informationen, die sich auf die UBS AG beziehen. Zudem stellt dieses Dokument keine umfassende Beschreibung oder Zusammenfassung der genannten Märkte und Entwicklungen dar. Gewisse Zahlen beziehen sich auf vergangene Wertentwicklungen oder stellen simulierte Wertentwicklungen dar und sind somit keine zuverlässigen Indikatoren für künftige Ergebnisse. Bei einigen Zahlen handelt es sich möglicherweise lediglich um Prognosen, und Prognosen sind kein zuverlässiger Indikator für zukünftige Entwicklungen. Gewisse Diagramme und/oder Darstellungen von Wertentwicklungen basieren möglicherweise nicht auf 12-Monate-Perioden, was ihre Vergleichbarkeit und Aussagekraft reduziert. Wechselkurse können sich negativ auf den Wert, den Preis oder die Einnahmen von Produkten und Dienstleistungen auswirken, die in den Materialien genannt werden. Gebühren sind möglicherweise nicht enthalten und reduzieren die Wertentwicklung entsprechend. Die steuerliche Behandlung hängt von den individuellen Umständen jedes Kunden ab und kann sich in Zukunft ändern. UBS erbringt keine Rechts- oder Steuerberatungsdienste und gibt weder allgemeine noch auf die spezifischen Umstände und Bedürfnisse eines Kunden bezogene Erklärungen im Hinblick auf die steuerliche Behandlung von Anlagen oder der damit verbundenen Anlagerenditen ab. Die Empfänger sollten eine unabhängige rechtliche und steuerliche Beratung im Hinblick auf die Auswirkungen der Produkte/Dienstleistungen in der jeweiligen Rechtsordnung sowie die Eignung der Produkte und Dienstleistungen in Anspruch nehmen. UBS, ihre Verwaltungsräte, Geschäftsführer und Mitarbeiter oder Kunden halten oder hielten möglicherweise Anteile oder Hausse- und Baisse-Positionen («Longoder Short-Positionen») an den hierin genannten Wertpapieren oder sonstigen Finanzinstrumenten und können jederzeit als Auftraggeber oder Beauftrage Käufe und/oder Verkäufe tätigen. UBS fungiert oder fungierte möglicherweise als Marktmacher («Market-Maker») bei den Wertpapieren oder sonstigen Finanzinstrumenten. Des Weiteren unterhält oder unterhielt UBS möglicherweise eine Geschäftsbeziehung mit oder erbringt oder erbrachte Investmentbanking-, Kapitalmarktdienstleistungen und/oder sonstige Finanzdienstleistungen für die jeweiligen Unternehmen. Dieses Dokument und die darin enthaltenen Informationen sind ausschliesslich für Personen mit Domizil Schweiz gedacht. Sie dürfen unter keinen Umständen in Rechtsordnungen verbreitet werden, in denen eine solche Verbreitung gegen geltende Gesetze oder Regulierungen verstösst. Sie dürfen insbesondere nicht in den USA und/oder an USPersonen oder in Rechtsordnungen verteilt werden, in denen der Vertrieb durch uns eingeschränkt ist.Die im Dokument enthaltenen Informationen stammen, sofern nicht anders angegeben, von UBS. UBS übernimmt keine Gewährleistung (weder ausdrücklich noch stillschweigend) für Richtigkeit, Vollständigkeit und Aktualität der Informationen. Sie können jederzeit und ohne vorherige Ankündigung geändert werden. UBS ist nicht verpflichtet, die hierin enthaltenen Informationen zu aktualisieren oder auf dem neuesten Stand zu halten.Das vorliegende Material beinhaltet Daten, welche aus dem Backtesting von Daten resultieren, und wurde von UBS in gutem Glauben und unter Anwendung standardisierter Methoden erstellt. Diese Methoden basieren auf eigenen Modellen, empirischen Daten, Annahmen und anderen Informationen, die wir für korrekt und angemessen erachten. Gewisse Links führen zu Websites Dritter. Diese sind dem Einfluss der UBS vollständig entzogen, weshalb UBS für Richtigkeit, Vollständigkeit und Rechtmässigkeit des Inhalts solcher Websites sowie für darauf enthaltene Angebote und (Dienst-) Leistungen keinerlei Verantwortung übernimmt.Für gewisse Dienstleistungen und Produkte gelten gesetzliche Bestimmungen. Diese Dienstleistungen und Produkte können daher nicht weltweit uneingeschränkt angeboten werden.Hinweise zu den Grafiken: Nur für Illustrationszwecke. Vergangene Performance ist kein zuverlässiger Indikator für die künftige Performance. © UBS 2017. Das Schlüsselsymbol und UBS gehören zu den eingetragenen und nicht eingetragenen Markenzeichen von UBS. Alle Rechte bleiben vorbehalten.  Der SMI™ Index sowie entsprechende Marken und der SLI™ Index sowie entsprechende Marken und der der Swiss Performance Index™ Index (SPITM) sowie entsprechende Marken und der VSMI™ sowie entsprechende Marken sind Eigentum der SIX Swiss Exchange AG. Alle Rechte vorbehalten. Der S&P 500™ Index sowie entsprechende Marken und der S&P 500 Industrials Index™ sowie entsprechende Marken sind Eigentum der Standard & Poor›s Financial Services LLC. Alle Rechte vorbehalten. Der Euro STOXX 50™ Index sowie entsprechende Marken und der STOXX Europe 600 Banks Index sowie entsprechende Marken sind Eigentum der Stoxx AG. Alle Rechte vorbehalten. Der CMCI™ Composite Index sowie entsprechende Marken sind Eigentum der UBS AG. Alle Rechte vorbehalten. Der DAX™ Index sowie entsprechende Marken sind Eigentum der Deutsche Börse AG. Alle Rechte vorbehalten. Der JPM™ German Government Bond Index sowie entsprechende Marken sind Eigentum der JPM International Limited. Alle Rechte vorbehalten. Der NIKKEI 225™ Index sowie entsprechende Marken sind Eigentum der Nihon Keizai Shimbun Incorporation. Alle Rechte vorbehalten. Der EPRA Index™ sowie entsprechende Marken sind Eigentum der European Public Real Estate Association. Alle Rechte vorbehalten. Der FTSE™ Index sowie entsprechende Marken sind Eigentum der London Stock Exchange Group Holdings Limited. Alle Rechte vorbehalten. Der MSCI™ World Index sowie entsprechende Marken sind Eigentum der MSCI Incorporation. Alle Rechte vorbehalten. Der KOSPI™ Index sowie entsprechende Marken sind Eigentum der Korea Exchange Incorporation. Alle Rechte vorbehalten. Der HSCEI™ Index, der Hang Seng China EnterprisesTM Index sowie entsprechende Marken sind Eigentum der Hang Seng Data Services Limited. Alle Rechte vorbehalten.

Weekly-Hits Ausgabe vom 01.11.20182018-11-01T08:20:15+01:00
Go to Top