Weekly-Hits: Eurozone, Clariant, Givaudan & Lonza

- Thema 1: Eurozone – Mario lässt den Geldhahn offen
- Thema 2: Clariant, Givaudan, Lonza – Schwache Branche, starke Titel
- Thema 3: Rohstoffmonitor – März 2019
Eurozone
Mario lässt den Geldhahn offen
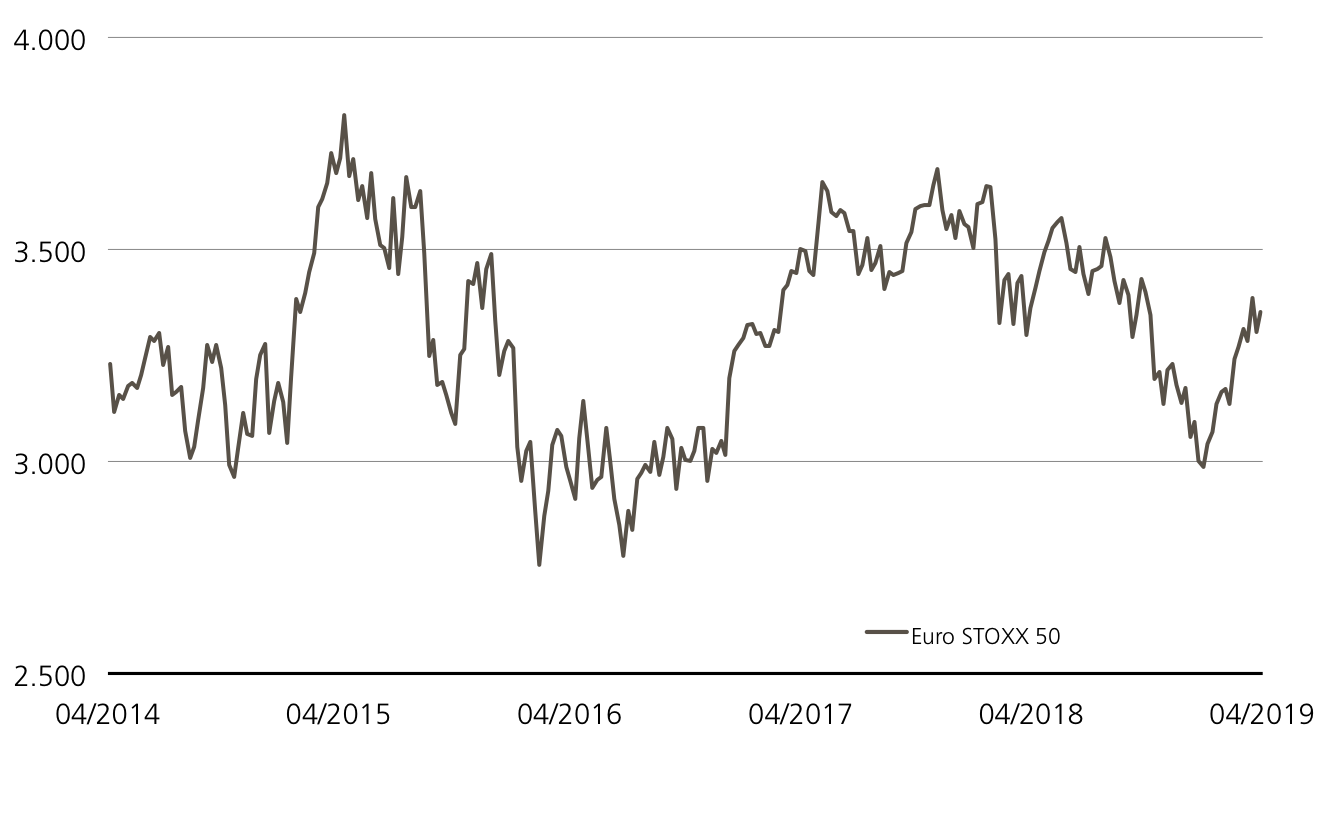
Es war eine faustdicke Überraschung, mit der das Oberhaupt der Europäischen Zentralbank am 27. März aufwartete. Mario Draghi, dessen Amtszeit am 31. Oktober 2019 endet, sagte die für dieses Jahr geplante Leitzinswende ab. Noch mindestens bis zum Jahresende möchte die EZB an ihren aktuellen Schlüsselsätzen festhalten. Die Leitzinsen liegen seit März 2016 auf dem Rekordtief von 0.0 Prozent. Sollte die Konjunktureintrübung noch stärker als befürchtet ausfallen, könnte die erste Erhöhung seit dem Jahr 2011 notfalls noch länger hinausgeschoben werden. «Wir haben keinen Mangel an Instrumenten, um unser Mandat zu erfüllen», sagte Draghi. Zudem stellen die Währungshüter die Nebenwirkungen der langeanhaltenden Niedrigzinsen für Banken auf den Prüfstand. (Quelle: Thomson Reuters, Medienbericht, 27.03.2019) Wie weit Draghi den Geldhahn noch aufdrehen wird, kommt auf die weitere Entwicklung an. Der Ausblick fällt derzeit nicht rosig aus. Das Ifo-Institut geht in einer gemeinsamen Prognose mit den Instituten KOF aus Zürich und Istat aus Rom von einem kleinen Wachstum von 0.2 Prozent in der Eurozone zum Jahresauftakt aus. In den folgenden Quartalen soll das BIP mit 0.3 Prozent nur geringfügig höher ausfallen. (Quelle: Thomson Reuters, Medienbericht, 02.04.2019)
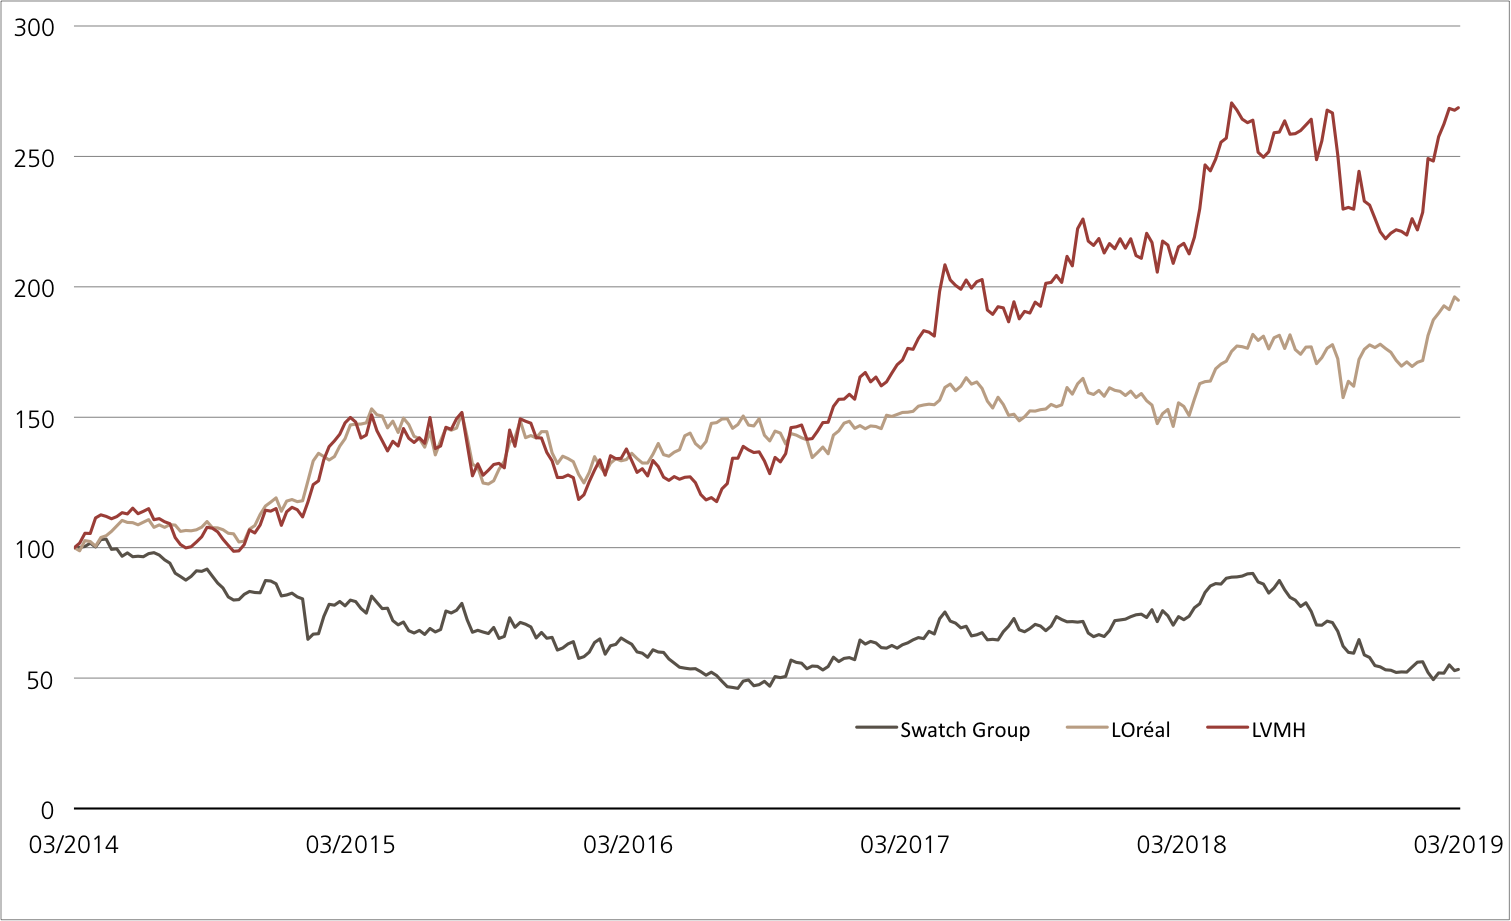
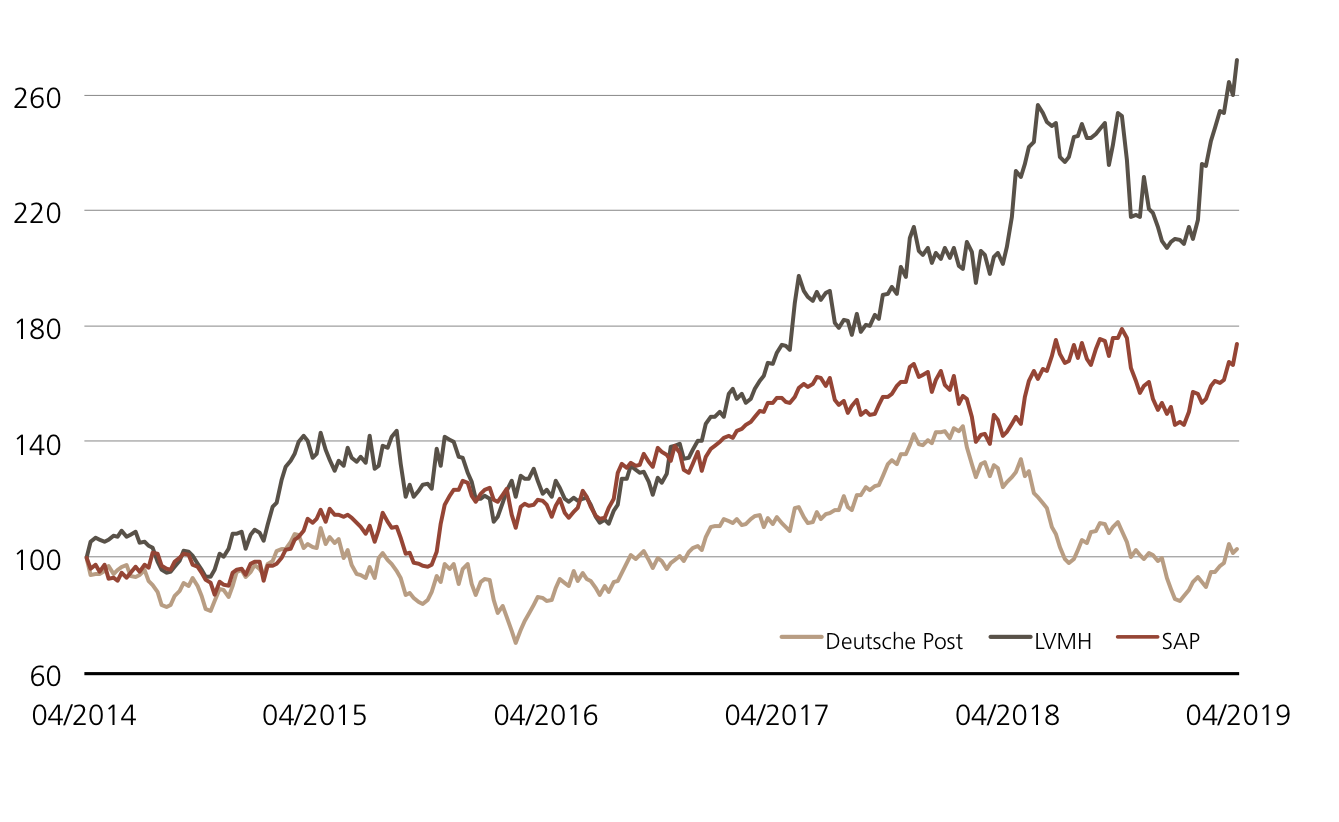
Dem ungeachtet setzte der Euro STOXX 50™ in der Hoffnung auf ein anhaltendes niedriges Zinsniveau seinen zu Jahresbeginn gestarteten Aufwärtstrend fort. Seit Silvester summiert sich der Zuwachs bereits auf 14.5 Prozent auf. Noch deutlich schneller kamen die europäischen Schwergewichte Deutsche Post, LVMH und SAP voran. Der weltgrösste Luxuskonzern LVMH verteuerte sich gar um knapp 30 Prozent.¹ Begleitet wurde der Anstieg mit positiven News. So schlossen die Franzosen das vergangene Geschäftsjahr mit neuen Rekordwerten ab. Zudem äusserte sich Firmenchef und Grossaktionär Bernard Arnault vorsichtig optimistisch zu 2019. (Quelle: Thomson Reuters, Medienbericht, 30.01.2019)
Chancen: Der ER Kick-In GOAL (Symbol: KBIUDU) auf Deutsche Post, LVMH und SAP kommt ohne weitere Kursanstiege aus. Bleiben die jeweiligen Barrieren des Trios unversehrt – aktuell weist die Deutsche Post mit 25.18 Prozent den geringsten Abstand auf – erzielt das Produkt in knapp einem Jahr eine Rendite von 7.4 Prozent. Der ETT (Symbol: ETSX5) auf den Euro STOXX 50™ richtet sich dagegen an Anleger, die ohne Teilschutz an den Chancen der 50 grössten Titeln der Euro-Zone teilnehmen möchten.²
Risiken:Die vorgestellten Produkte sind nicht kapitalgeschützt. Bei einem ETT kommt es zu Verlusten, sobald der zugrundeliegende Index unter dem Einstiegspreis zu liegen kommt. Notiert einer der Basiswerte des Kick-In GOAL während der Laufzeit einmal auf oder unter dem jeweiligen Kick-In Level (Barriere) und kommt zudem das Early Redemption Feature nicht zum tragen, kann die Rückzahlung am Verfalltag durch Bartilgung entsprechend der (vom Strike aus) schwächsten Performance aus dem Trio erfolgen (höchstens jedoch zum Nominalwert zuzüglich Coupon). In diesem Fall sind Verluste wahrscheinlich. Zudem trägt der Anleger bei strukturierten Produkten das Emittentenrisiko, so dass das eingesetzte Kapital – unabhängig von der Entwicklung des Basiswertes – im Falle einer Insolvenz der UBS AG verloren gehen kann.
²) Die Konditionen der ETTs werden jährlich überprüft und können mit einer Frist von 13 Monaten nach Bekanntgabe angepasst werden
| Remove | ||
|---|---|---|
| Symbol | KBIUDU | |
| SVSP Name | Barrier Reverse Convertible | |
| SVSP Code | 1230 (Auto-Callable) | |
| Basiswerte | Deutsche Post, LVMH, SAP | |
| Handelswährung | EUR | |
| Coupon | 8.00% p.a. | |
| Strike Level | 100% | |
| Kick-In Level (Abstand) |
Dt. Post: EUR 29.70 (25.18%) LVMH: EUR 335.00 (50.97%) SAP: EUR 103.70 (48.19%) |
|
| Seitwärtsrendite | 7.38% / 7.15% p.a. | |
| Verfall | 03.04.2020 | |
| Emittentin | UBS AG, London | |
| Geld-/Briefkurs | 99.60% / 100.60% | |
| s |
| Index | Stand | Woche¹ | |
|---|---|---|---|
| SMI™ | 9’570.09 | 1.9% | |
| SLI™ | 1’477.30 | 3.1% | |
| S&P 500™ | 2’873.40 | 2.4% | |
| Euro STOXX 50™ | 3’435.56 | 3.4% | |
| S&P™ BRIC 40 | 4’380.80 | 3.3% | |
| CMCI™ Compos. | 938.56 | 1.0% | |
| Gold (Feinunze) | 1’295.30 | -1.6% | |
Clariant, Givaudan, Lonza
Schwache Branche, starke Titel
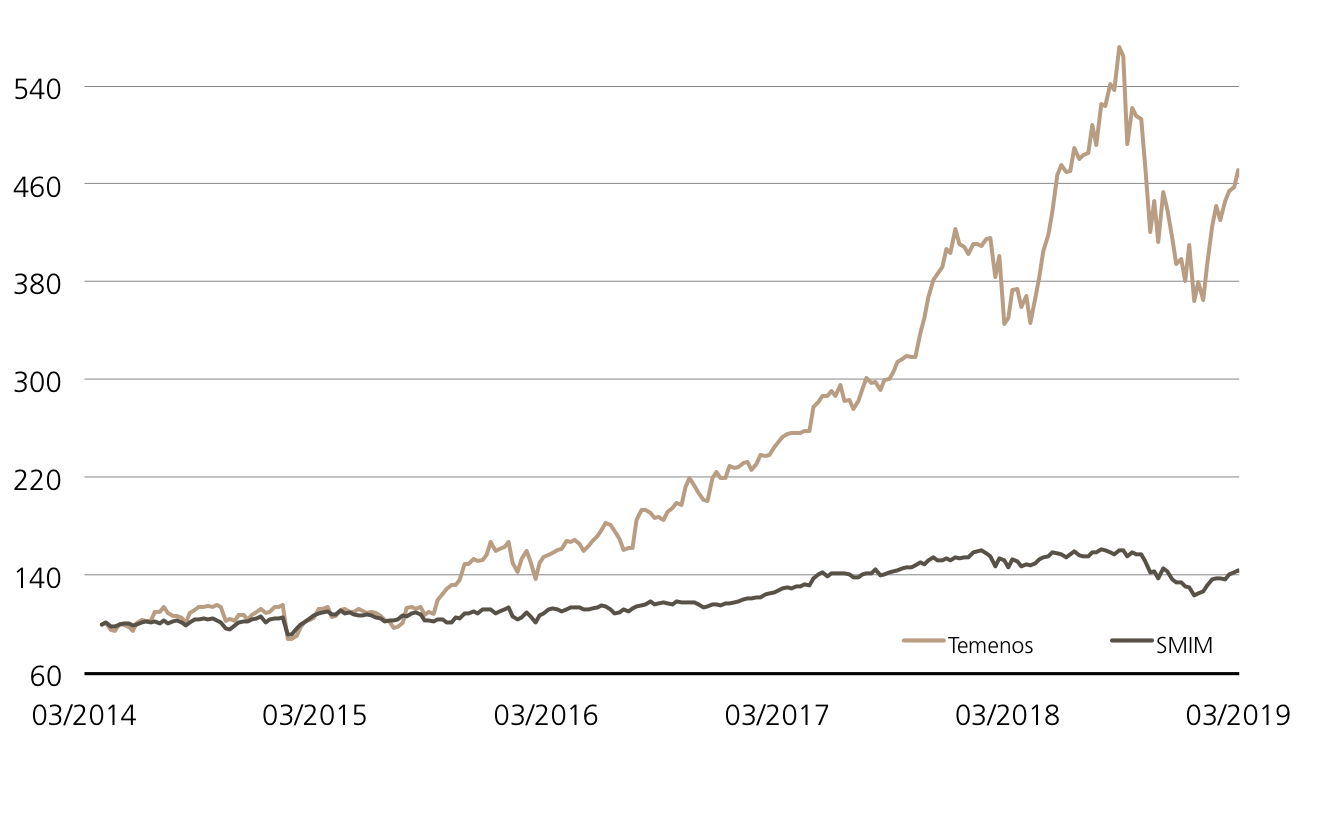
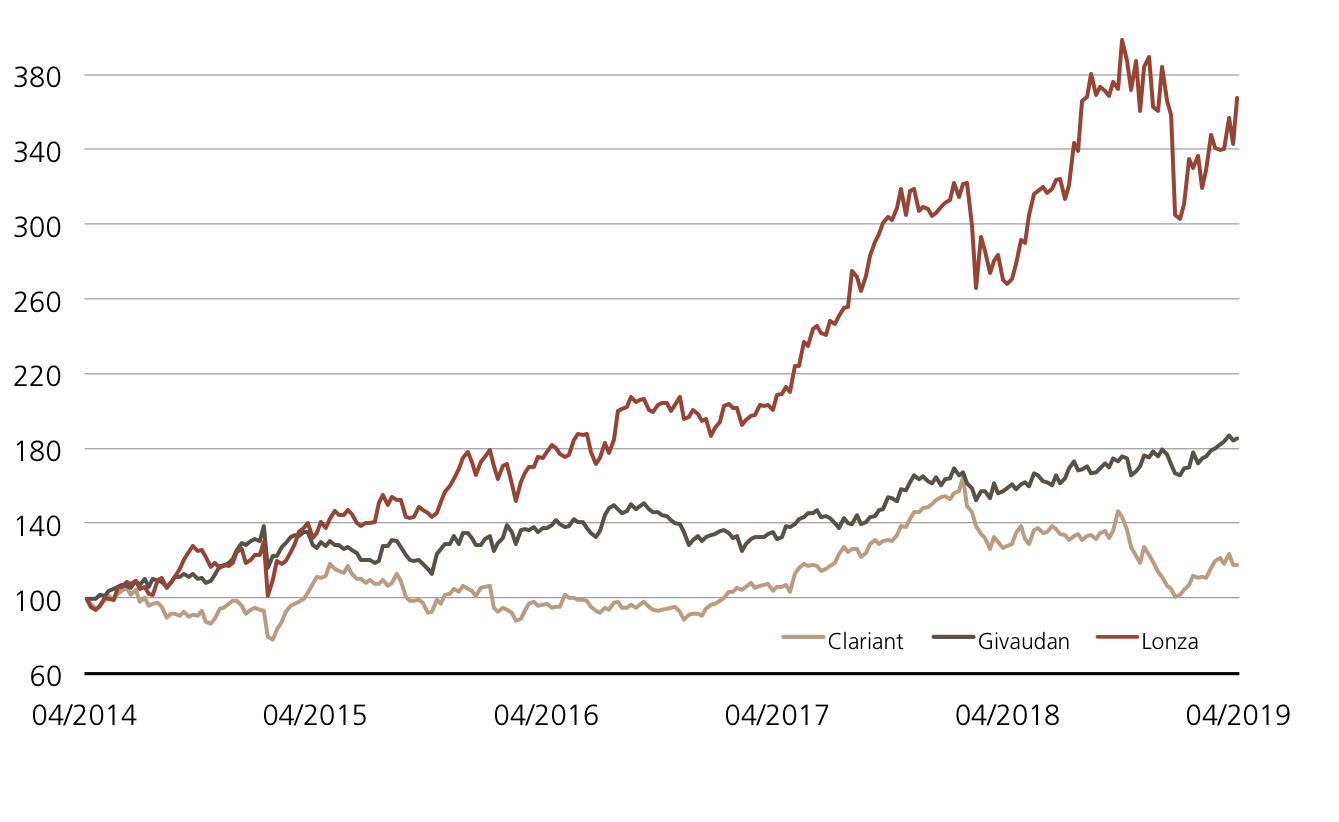
Zu Irritation kam es Anfang des Jahres bei Lonza. Überraschend kündigte CEO Richard Ridinger seinen Rücktritt an und übergab das Zepter am 1. März 2019 seinem Nachfolger Marc Funk, der zuvor die Division Pharma & Biotech leitete. An der Wachstumsstrategie des Unternehmens ändert sich dadurch aber nichts. 2019 wird ein Umsatzplus im mittleren bis hohen einstelligen Bereich sowie eine Kern-EBITDA-Marge auf «anhaltend hohem Niveau» erwartet. Die Rendite lag 2018 bei 27.3 Prozent. Bis zum Jahr 2022 soll diese auf 30 Prozent zulegen. (Quelle: Lonza, Medienmitteilung, 30.01.2019) Auch der Spezialchemiekonzern Clariant, der sich inmitten eines Umbaus befindet, traut sich eine Mittelfristprognose zu. Bis 2021 wird ein überdurchschnittliches Wachstum sowie eine höhere Profitabilität erwartet, genaue Zahlen wurden aber nicht genannt. (Quelle: Clariant, Medienmitteilung, 13.02.2019) Givaudan kündigte derweil an, auch künftig mit Hilfe von Übernahmen zu wachsen. 2018 erzielte der Aromen- und Dufthersteller dank Akquisitionen ein Umsatzplus von 9.4 Prozent. (Quelle: Givaudan, Medienmitteilung, 25.01.2019)
Chancen:Der neue Early Redemption (ER) Kick-In GOAL (Symbol: KDIWDU) ermöglicht eine teilgeschützte Investition in das heimische Chemie-Trio aus Clariant, Givaudan und Lonza. Das Produkt gewährt den Basiswerten einen Spielraum von knapp 40 Prozent nach unten, ohne dass die maximale Gewinnchance von 7.00 Prozent p.a. in Gefahr gerät. Die Maximallaufzeit von zwei Jahren kann aufgrund der ER-Funktion um höchstens ein Jahr verkürzt werden.
Risiken:Das vorgestellte Produkt ist nicht kapitalgeschützt. Notiert einer der Basiswerte während der Laufzeit einmal auf oder unter dem jeweiligen Kick-In Level (Barriere) und kommt zudem das Early Redemption Feature nicht zum tragen, kann die Rückzahlung am Verfalltag durch Bartilgung entsprechend der (vom Strike aus) schwächsten Performance aus dem Trio erfolgen (höchstens jedoch zum Nominalwert zuzüglich Coupon). In diesem Fall sind Verluste wahrscheinlich. Zudem trägt der Anleger bei Zertifikaten das Emittentenrisiko, so dass das eingesetzte Kapital – unabhängig von der Entwicklung des Basiswertes – im Falle einer Insolvenz der UBS AG verloren gehen kann.
7.00% p.a. ER Worst of Kick-In GOAL auf Clariant / Givaudan / Lonza
| Remove | ||
|---|---|---|
| Symbol | KDIWDU | |
| SVSP Name | Barrier Reverse Convertible | |
| SVSP Code | 1230 (Auto-Callable) | |
| Basiswerte | Clariant, Givaudan, Lonza | |
| Handelswährung | CHF | |
| Coupon | 7.00% p.a. | |
| Kick-In Level (Barriere) | 60.00% | |
| Verfall | 12.04.2021 | |
| Emittentin | UBS AG, London | |
| Zeichnung bis | 10.04.2019, 15:00 Uhr | |
Termsheet Weitere Produkte sowie Informationen zu Chancen und Risiken finden Sie unter: ubs.com/keyinvest Quelle: UBS AG Stand: 03.04.2019
²) Die Konditionen der ETTs werden jährlich überprüft und können mit einer Frist von 13 Monaten nach Bekanntgabe angepasst werden
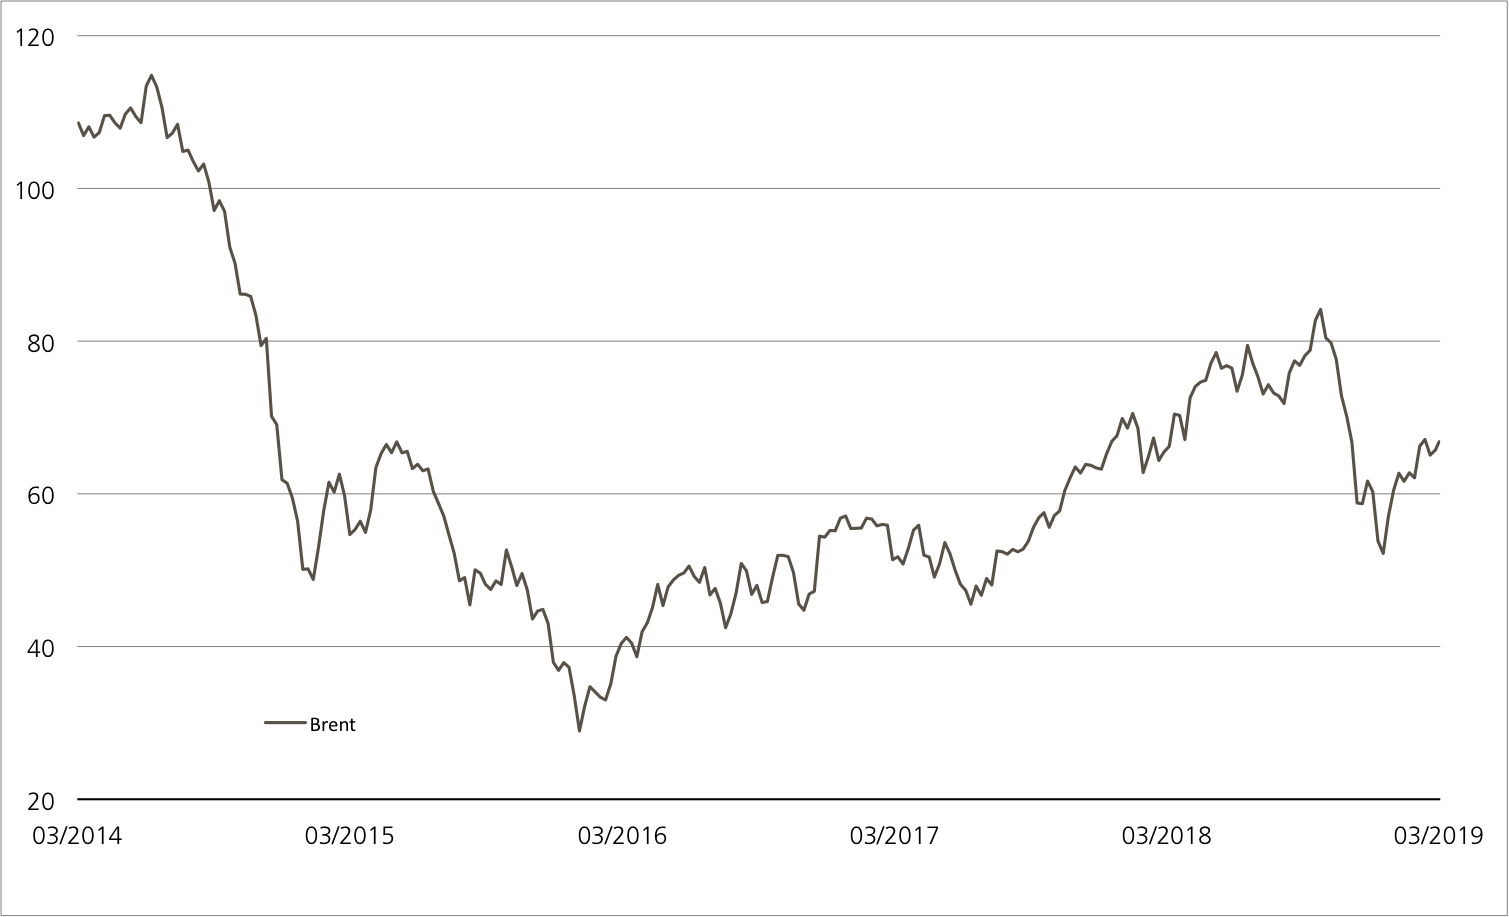
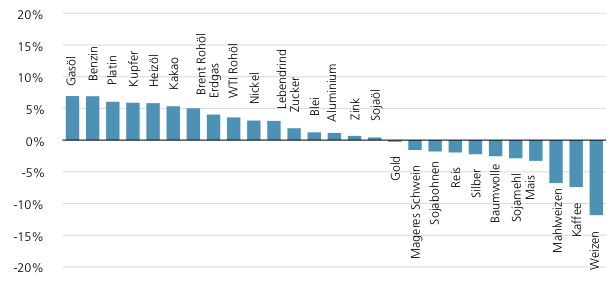
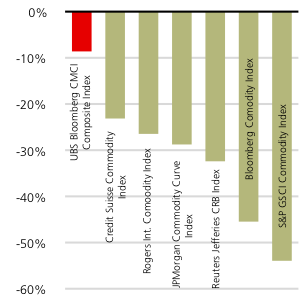
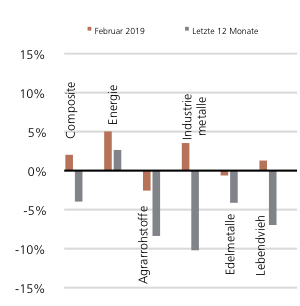
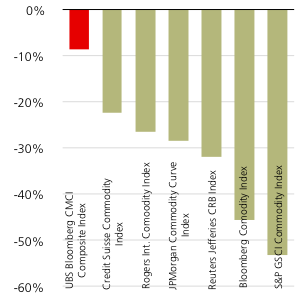
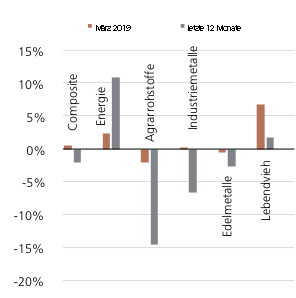
Rohstoffmonitor
März 2019
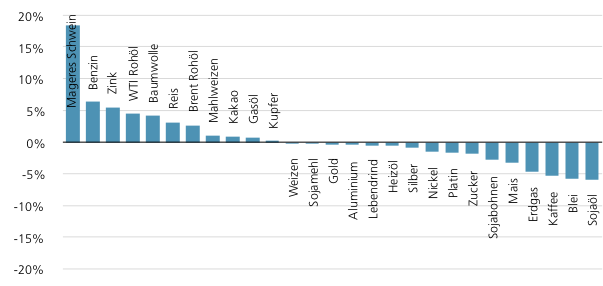
Total-Return-Performance der UBS Bloomberg CMCI Einzelrohstoff-Indizes im März 2019 in US-Dollar.
Stand: 31.03.2019Quelle: UBS AG
| Produkt | Symbol | Währung | Monatsperformance¹ | Anteil am Gesamtvolumen | |
|---|---|---|---|---|---|
| UBS ETC on CMCI DJ UBS Maturity | TDJCM | USD | 0.2% | 29.2% | |
| UBS ETC on CMCI Energy | TENCI | USD | 2.0% | 21.5% | |
| UBS ETC on CMCI Industrial Metals | TIMCI | USD | 0.2% | 11.3% | |
| UBS ETC on CMCI Composite | TCMCI | USD | -0.7% | 8.4% | |
| UBS ETC on CMCI Nickel | TLNCI | USD | -0.9% | 5.8% | |
| UBS ETC on CMCI Gold | EGCCI | EUR | -1.4% | 4.2% | |
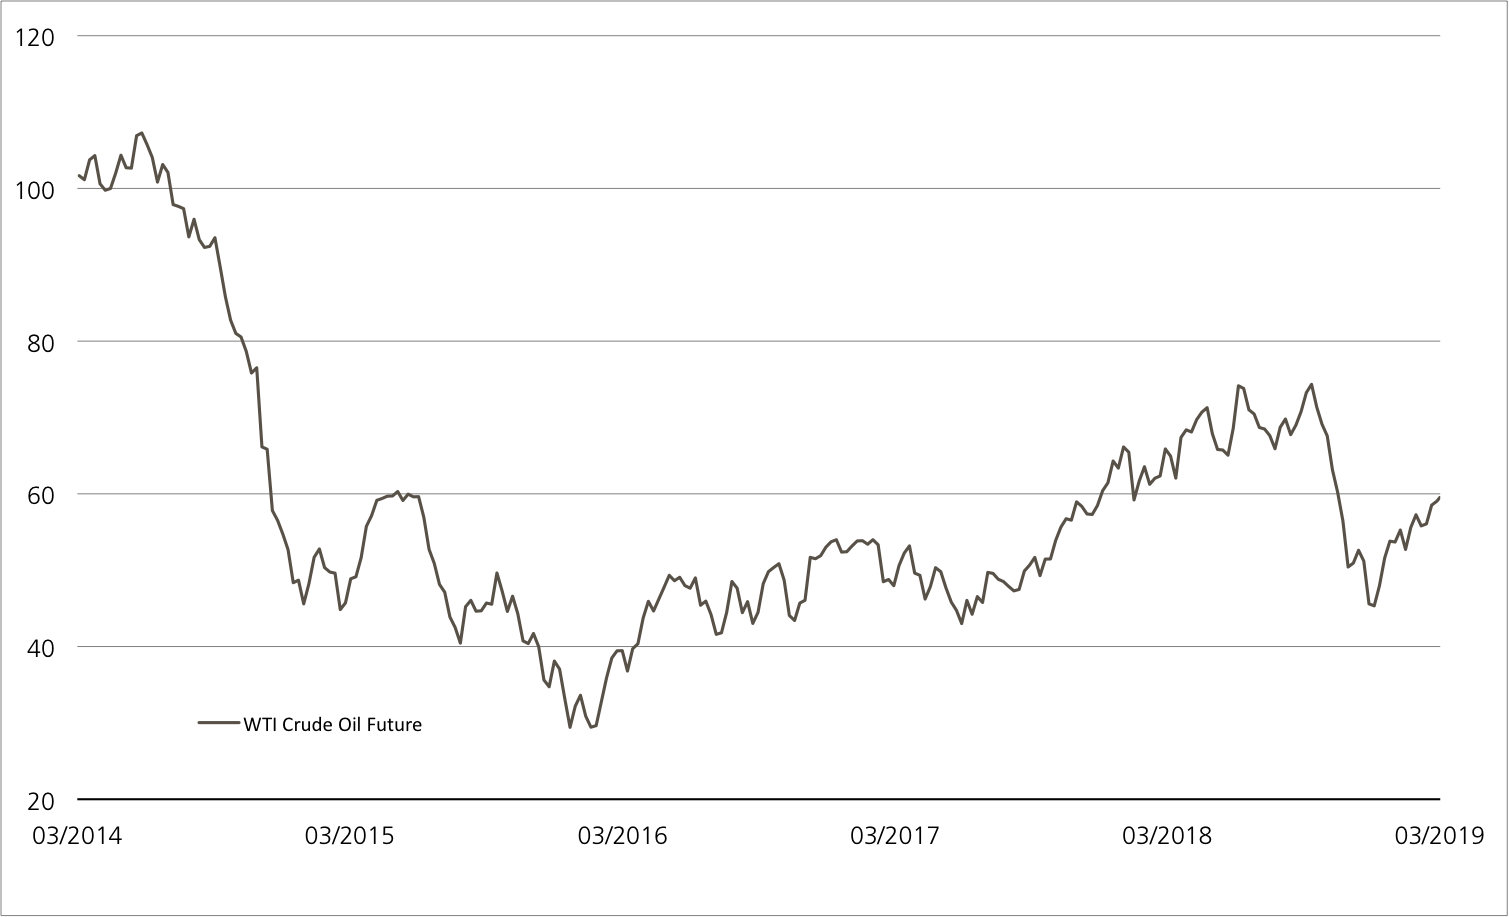
| UBS ETC on CMCI WTI Crude Oil | ECLCI | EUR | 3.1% | 3.8% | |
| UBS ETC on CMCI Brent Crude | CCOCI | CHF | 2.0% | 3.1% | |
| UBS ETC on CMCI Composite | CCMCI | CHF | 0.3% | 2.3% | |