Weekly Hits: Schweizer Aktienmarkt & Telekomsektor

- Thema 1: Schweizer Aktienmarkt – Der Spitze so nah
- Thema 2: Telekomsektor – Aufbruch in das 5G-Zeitalter
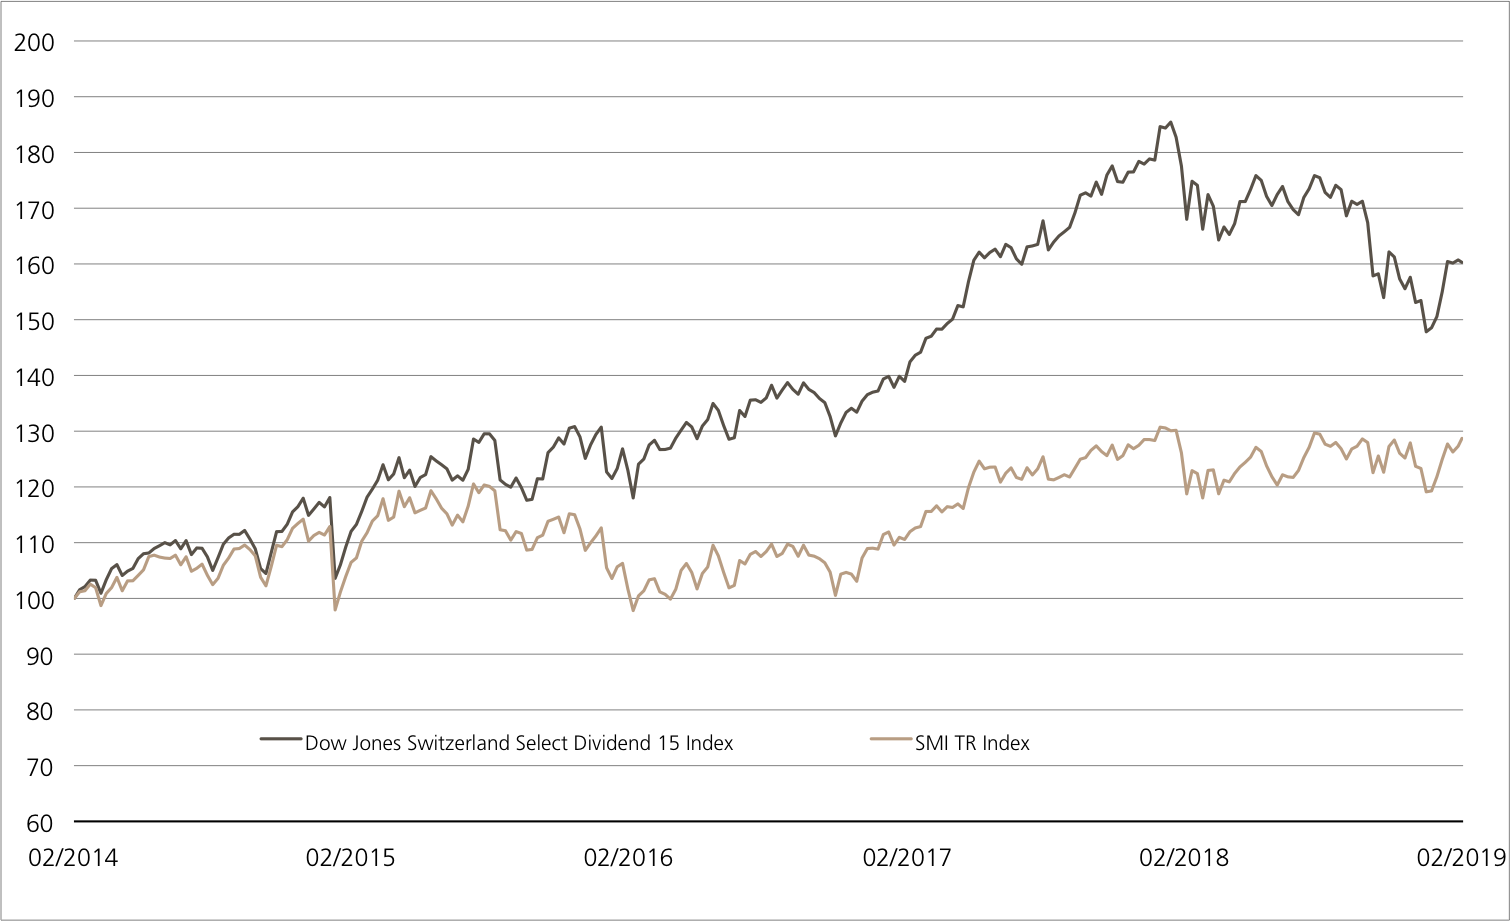
Schweizer Aktienmarkt
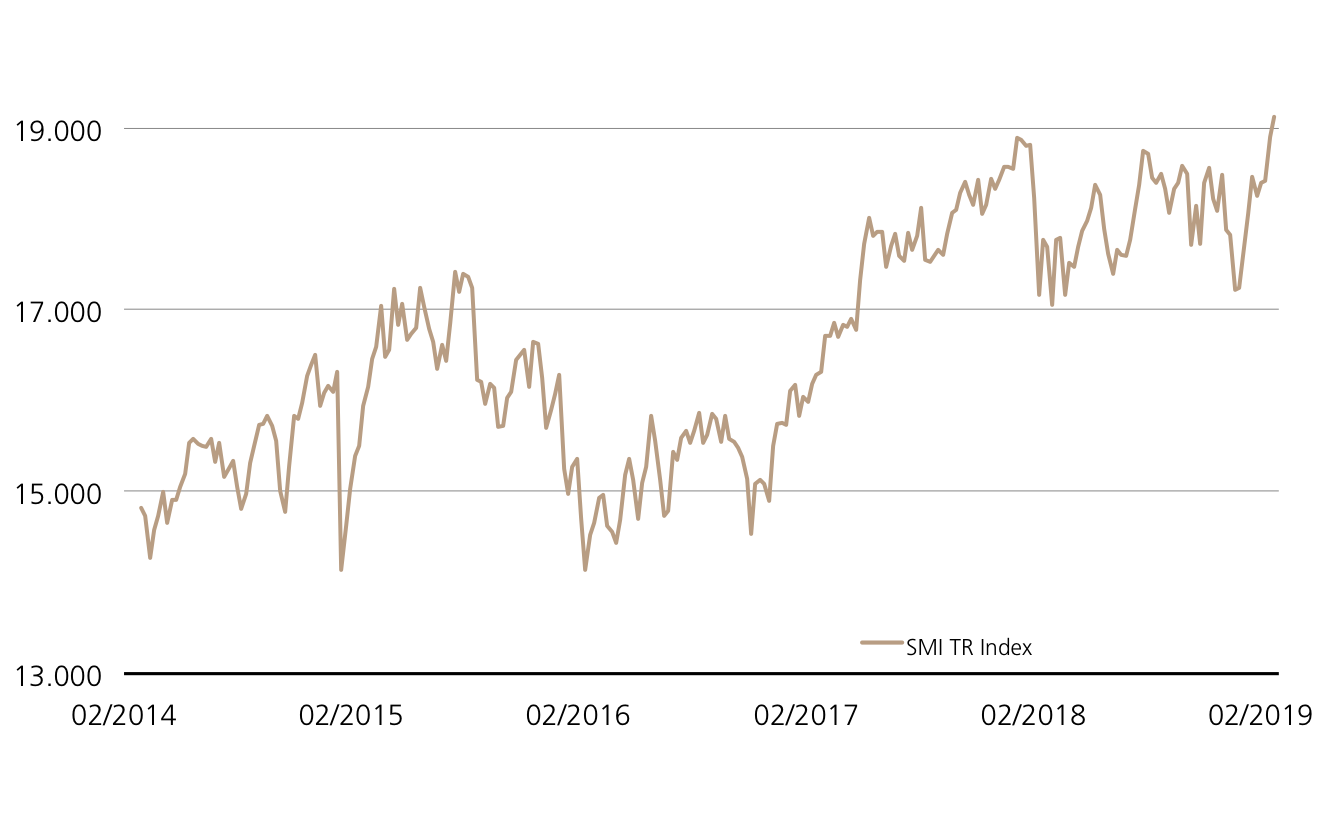
Der Spitze so nah
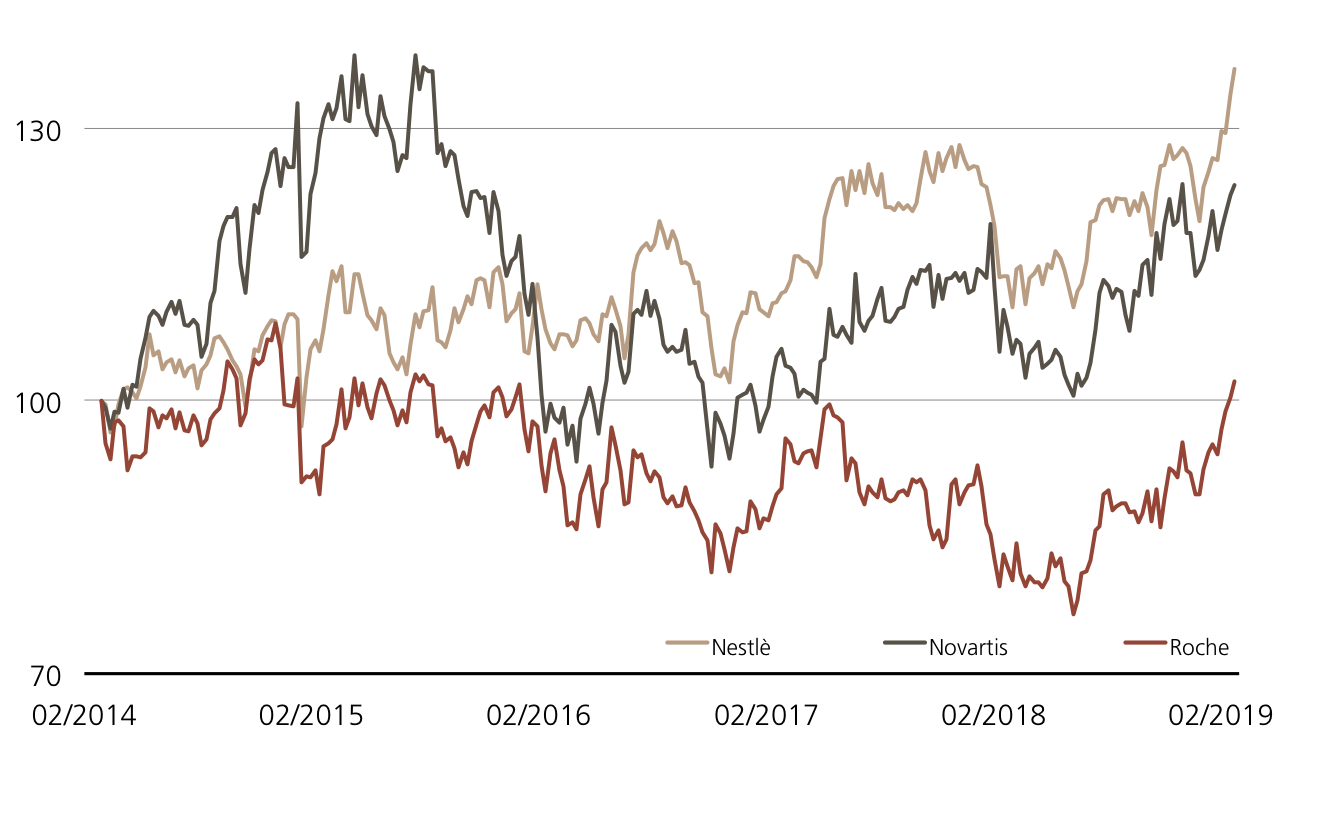
Zahlen, Zahlen, Zahlen: Die Unternehmen befinden sich derzeit rund um den Globus im Bilanzfieber. Während sich die Berichtssaison in den USA bereits dem Ende zuneigt, ist hierzulande noch jede Menge geboten. Beispielsweise werden am 28. Februar (nach Redaktionsschluss) ABB und Adecco ihre Bücher offenlegen. Am gleichen Tag lädt Novartis zur Generalversammlung ein. Ein wichtiges Event, schiesslich müssen die Aktionäre dort über die geplante Abspaltung der Augenheilsparte Alcon abstimmen. Das Unternehmen geht davon aus, dass die Transaktion im zweiten Quartal 2019 abgeschlossen werden kann.
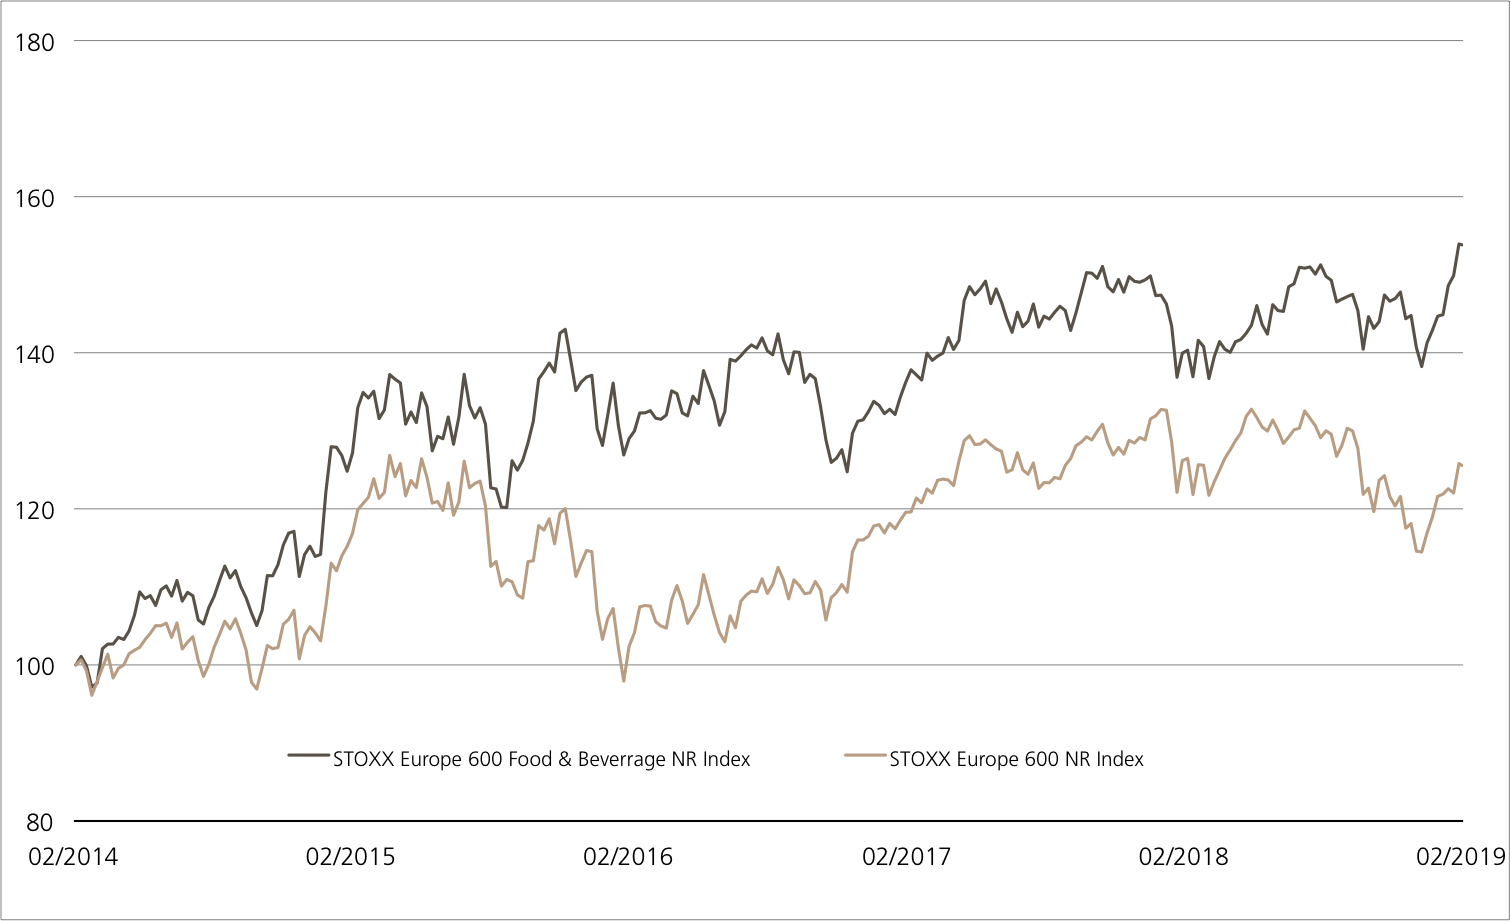
Mit den Zahlen zum Gesamtjahr hat Novartis-Chef Vas Narasimhan den Markt überzeugen können. In seinem ersten Jahr als CEO durfte er einen Nettoumsatzanstieg um sechs Prozent gegenüber dem Vorjahr auf 51.9 Milliarden US-Dollar bekanntgeben. Damit wurde das angekündigte Wachstum für 2018 erreicht. Insbesondere der Bereich «Innovative Medicines» stach mit einem Plus von acht Prozent heraus. Für 2019 erwartet der Pharma-Konzern einen Anstieg beim Nettoumsatz im mittleren einstelligen Prozentbereich. (Quelle: Novartis, Medienmitteilung, 30.01.2019) Wort gehalten hat auch Nestlé. Der Lebensmittelriese erzielte 2018 ein organisches Wachstum von 3.0 Prozent, die operative Gewinnmarge stieg auf bereinigter Basis um 50 Basispunkte auf 17.0 Prozent. CEO Mark Schneider rechnet für 2019 mit einer weiteren Verbesserung des organischen Wachstums sowie der bereinigten operative Rendite. (Quelle: Nestlé, Medienmitteilung, 14.02.2019)
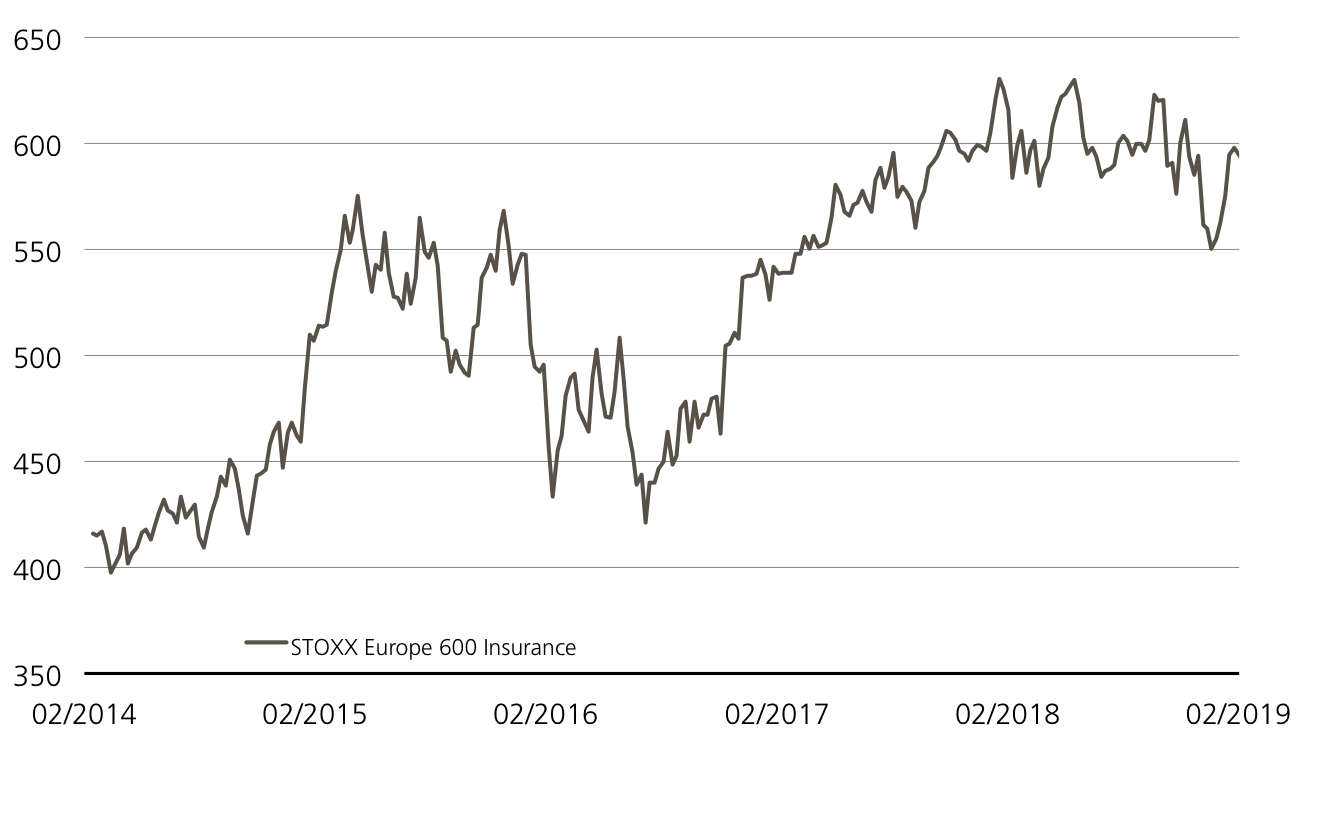
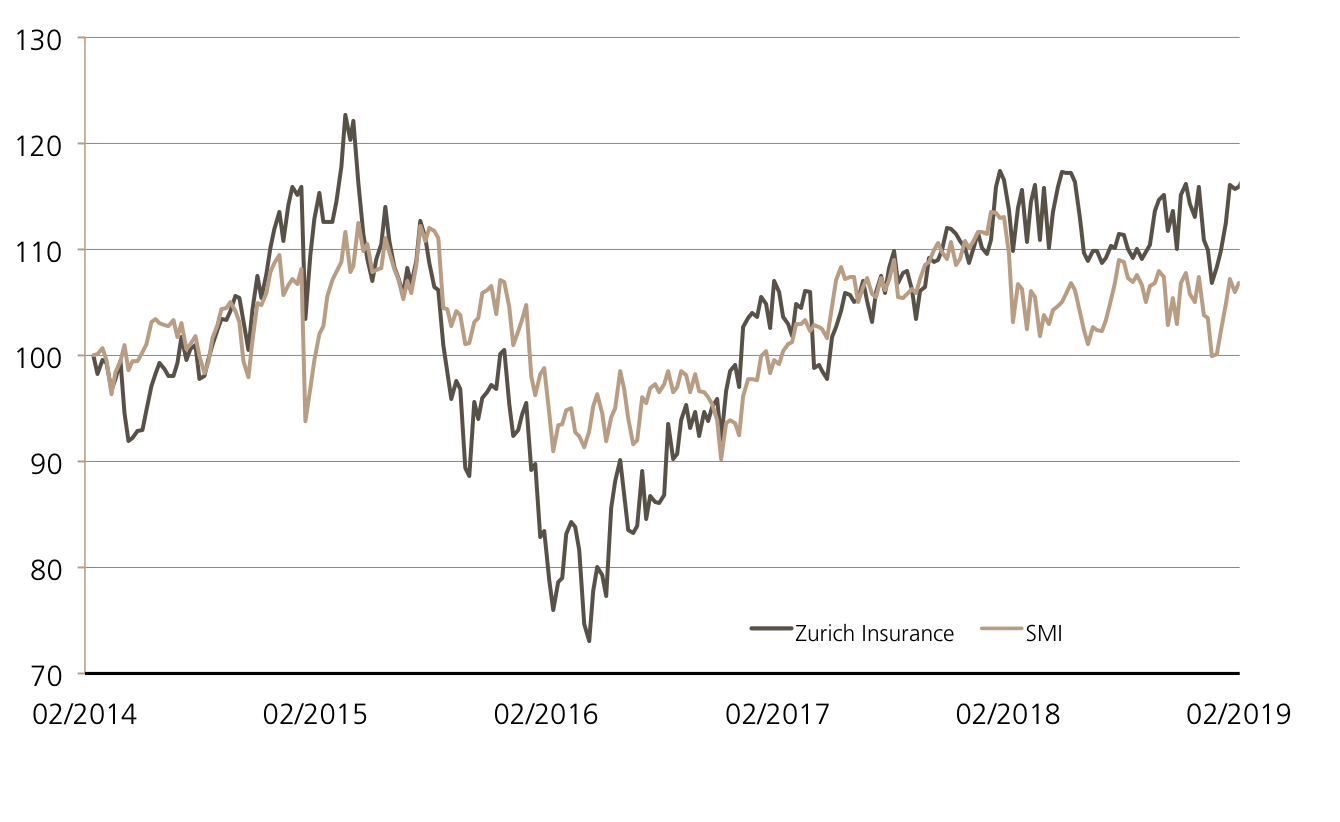
Aber nicht alle SMI™-Konzerne ernteten Applaus für ihre jüngsten Geschäftszahlen. Zum Beispiel konnten Swatch und Julius Bär die Markterwartungen nicht erfüllen. Auf eine Schwäche im Luxus- und Finanzsektor lässt sich dadurch aber nicht schliessen. So erreichte Richemont die Prognosen, Credit Suisse und Zurich Insurance schnitten sogar besser ab als erwartet. Das gleiche gilt für Roche. Das Pharma-Unternehmen überraschte mit einem um sieben Prozent höheren Umsatz und acht Prozent höheren operativen Kerngewinn positiv. Zudem schraubt Roche die Dividende für 2018 auf 8.70 Franken je Anteil hoch, die 32. Erhöhung in Folge.
Chancen: Für Anleger, die in den Genuss der Dividenden sowie möglichen Kurssteigerungen der 20 heimischen Blue Chips kommen möchten, könnte der von UBS emittierte ETT (Symbol: ETSMI) auf den SMI™ Total Return Index interessant sein. Das Produkt nimmt vollständig – abzüglich einer Verwaltungsgebühr von 0.25 Prozent p.a. – an der Kursentwicklung des Basiswerts teil.² Konservative Naturen können auch mit Teilschutz in den Schweizer Aktienmarkt investieren. Der in Zeichnung stehende Worst of Kick-In GOAL (Symbol: KDESDU) auf Nestlé, Novartis und Roche verfügt über einen Risikopuffer von 25 Prozent. Bleibt das SMI-Trio während der einjährigen Laufzeit über der Barriere, erzielt das Produkt die Maximalrendite von 5.00 Prozent p.a.
Risiken:Die vorgestellten Produkte sind nicht kapitalgeschützt. Bei einem ETT kommt es zu Verlusten, sobald der zugrundeliegende Index unter dem Einstiegspreis zu liegen kommt. Notiert einer der Basiswerte des Worst of Kick-In GOALs während der Laufzeit einmal auf oder unter dem jeweiligen Kick-In Level, kann die Tilgung am Verfalltag durch Bartilgung entsprechend der (vom Strike aus) schwächsten Performance aus dem Trio erfolgen (höchstens jedoch zum Nominalwert zuzüglich Coupon). In diesem Fall sind Verluste wahrscheinlich. Zudem trägt der Anleger bei strukturierten Produkten das Emittentenrisiko, so dass das eingesetzte Kapital – unabhängig von der Entwicklung des Basiswertes – im Falle einer Insolvenz der UBS AG verloren gehen kann.
²) Die Konditionen der ETTs werden jährlich überprüft und können mit einer Frist von 13 Monaten nach Bekanntgabe angepasst werden
| Index | Stand | Woche¹ | |
|---|---|---|---|
| SMI™ | 9’412.19 | 1.0% | |
| SLI™ | 1’451.49 | 1.2% | |
| S&P 500™ | 2’792.38 | 0.3% | |
| Euro STOXX 50™ | 3’282.77 | 0.7% | |
| S&P™ BRIC 40 | 4’245.58 | 1.6% | |
| CMCI™ Compos. | 930.61 | 0.2% | |
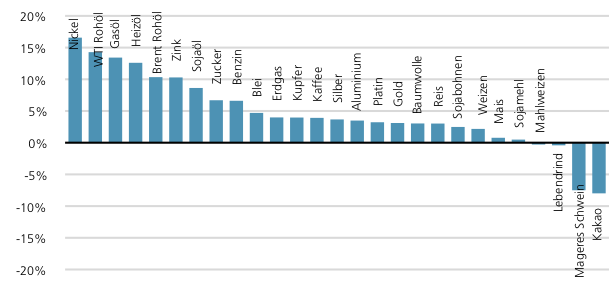
| Gold (Feinunze) | 1’321.20 | -2.0% | |
Telekomsektor
Aufbruch in das 5G-Zeitalter
Chancen:An der Börse entfacht der Aufbruch in das 5G-Zeitalter noch keine Euphorie. Die drei genannten Telekomaktien befinden sich jeweils in einer längerfristigen Seitwärtsbewegung. Eine Fortsetzung dieser Konstellation würde ausreichen, um mit dem Worst of Kick-In GOAL (Symbol: KDEUDU) auf Deutsche Telekom, Swisscom und AT&T die Maximalrendite von 7.00 Prozent p.a. abzugreifen. Entscheidend ist, dass keine Basiswert während der Laufzeit auf oder unter die Barriere bei 65 Prozent der Anfangsfixierung fällt.
Risiken:Kick-In GOALs sind nicht kapitalgeschützt. Notiert einer der Basiswertewährend der Laufzeit einmal auf oder unter dem jeweiligen Kick-In Level (Barriere),kann die Rückzahlung am Verfalltag durch Bartilgung entsprechend der (vom Strike aus) schwächsten Performance aus dem Trio erfolgen (höchstens jedoch zum Nominalwert zuzüglich Coupon). In diesem Fall sind Verluste wahrscheinlich. Zudemträgt der Anleger bei strukturierten Produkten das Emittentenrisiko, so dass daseingesetzte Kapital – unabhängig von der Entwicklung des Basiswertes – im Falleeiner Insolvenz der UBS AG verloren gehen kann.
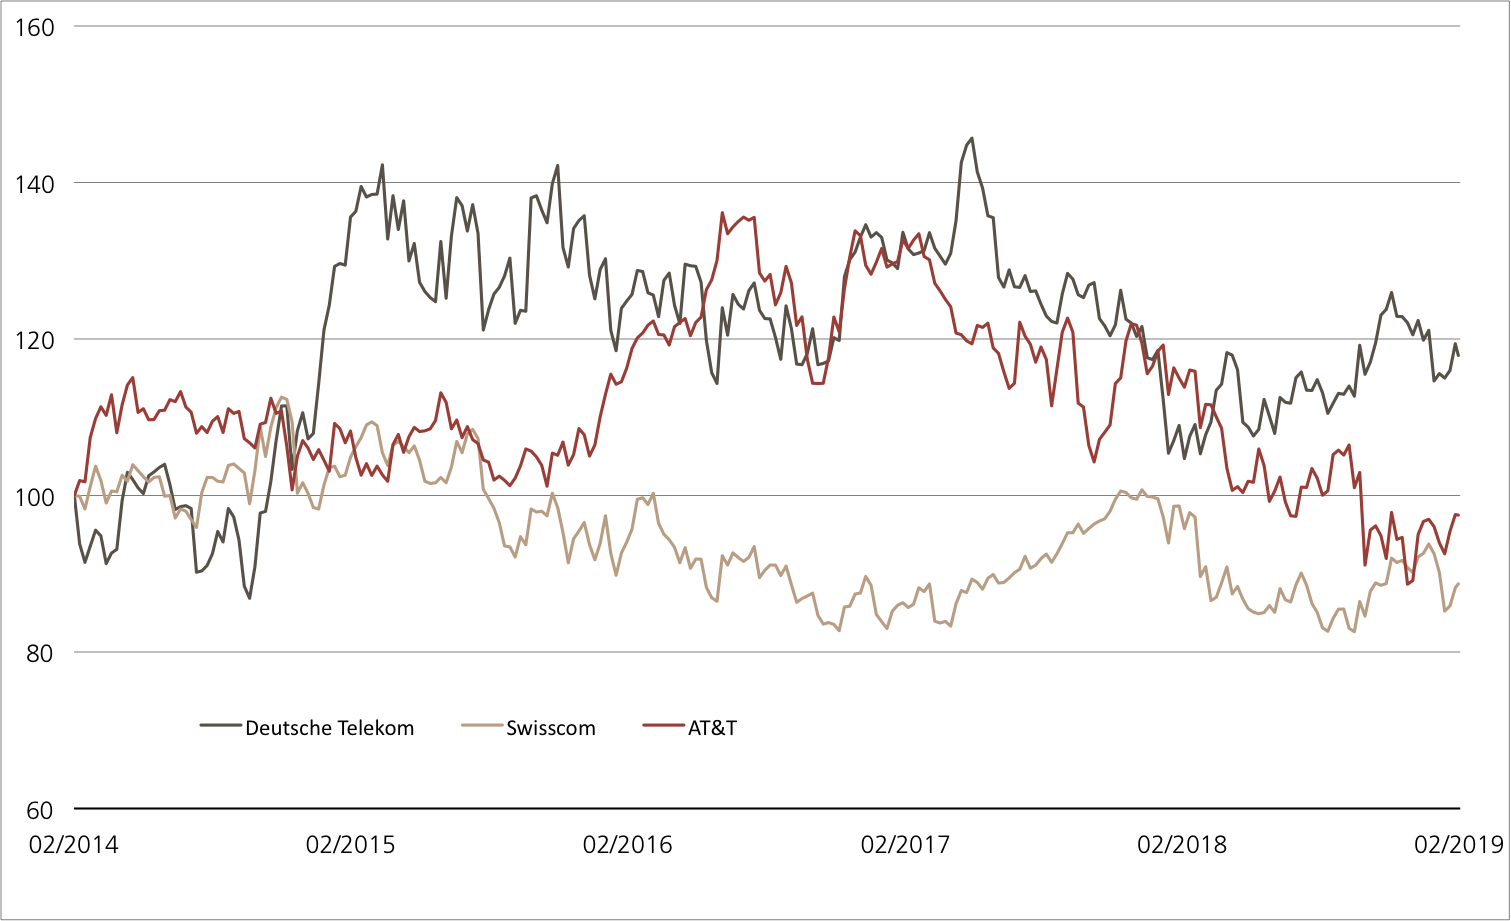
7.00% p.a. Worst of Kick-In GOAL auf Dt. Telekom / Swisscom / AT&T
| Remove | ||
|---|---|---|
| Symbol | KDEUDU | |
| SVSP Name | Barrier Reverse Convertible | |
| SVSP Code | 1230 | |
| Basiswerte | Deutsche Telekom / Swisscom / AT&T | |
| Handelswährung | EUR | |
| Coupon | 7.00% p.a. | |
| Strike Level | 100% | |
| Kick-In Level (Barriere) | 65% | |
| Verfall | 04.09.2020 | |
| Emittentin | UBS AG, London | |
| Zeichnung bis | 06.03.2019, 15:00 Uhr | |
Termsheet Weitere Produkte sowie Informationen zu Chancen und Risiken finden Sie unter: ubs.com/keyinvest Quelle: UBS AG Stand: 27.02.2019
²) Die Konditionen der ETTs werden jährlich überprüft und können mit einer Frist von 13 Monaten nach Bekanntgabe angepasst werden