Weekly Hits: Pharmaindustrie & US-Technologie

-
Thema 1: Pharmaindustrie – Eine gesunde Entwicklung
- Thema 2: US-Technologie – Kampf um die Vorherrschaft
-
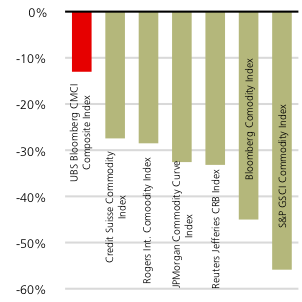
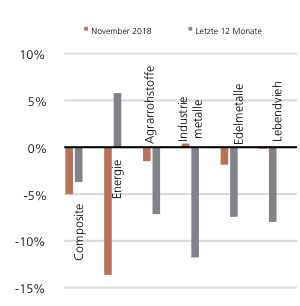
Thema 3: Rohstoffmonitor – November 2018
Pharmaindustrie
Eine gesunde Entwicklung
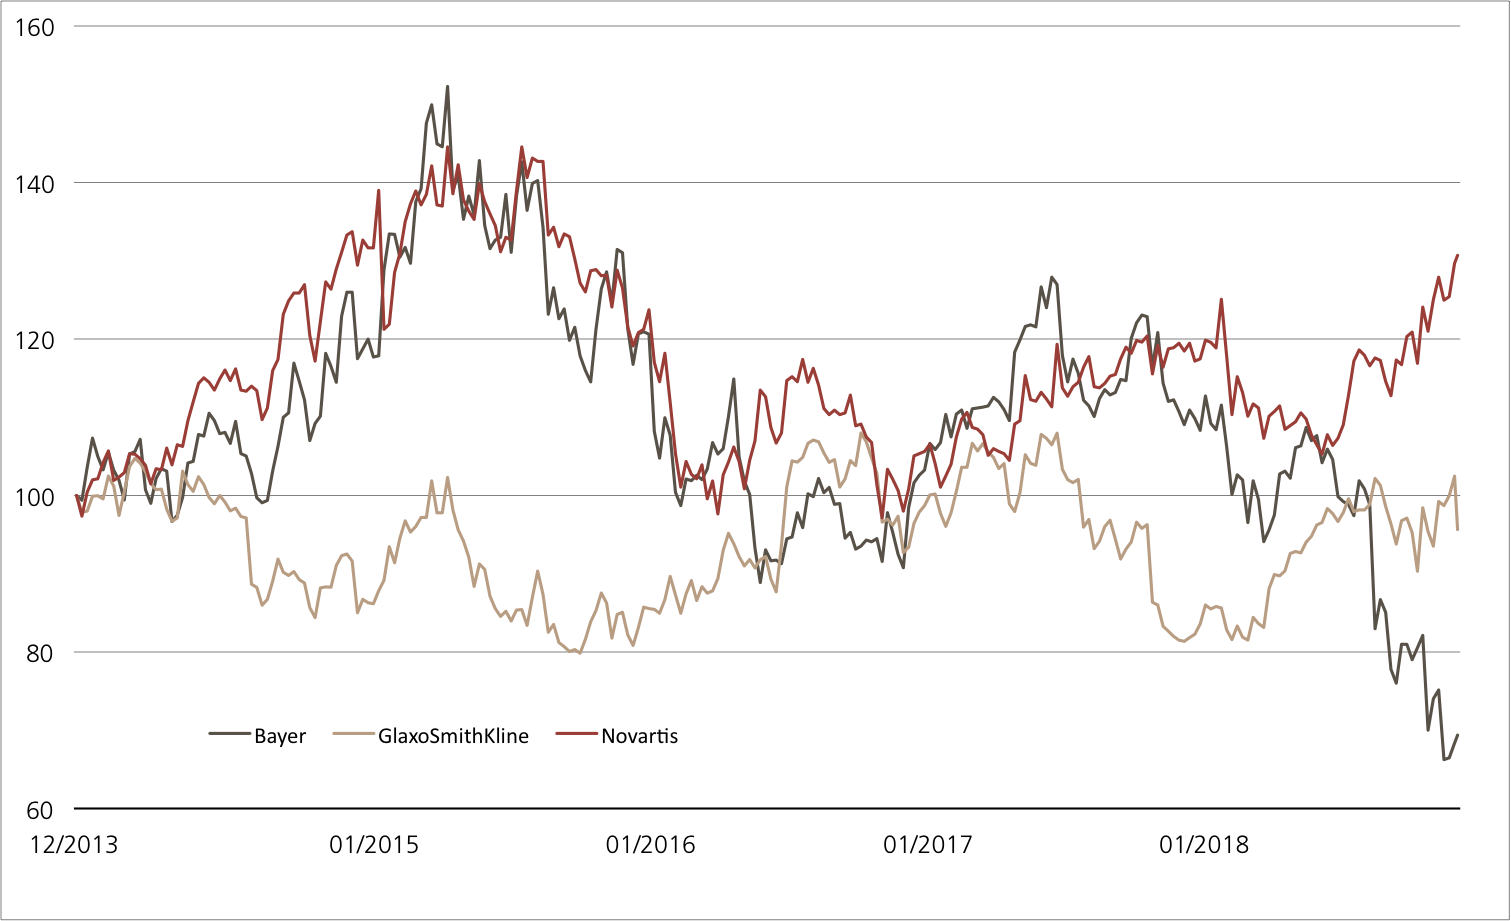
Angesichts der hektischen Börsenumfelds kommt die jüngste Sektor-Rotation nicht von ungefähr. Allerdings kann die Gesundheitsbranche auch mit einem operativen Momentum aufwarten. Beispiel Novartis: Seit Vasant Narasimhan im Februar den Posten als CEO übernommen hat, richtet er den Basler Konzern neu aus. Der Harvard-Absolvent legt den Fokus auf spezialisierte, auf Patienten abgestimmte Arzneien sowie neue Behandlungsansätze. Dabei sollen Plattformen für Zelltherapie, Gentherapie und Radioligand-Therapie entstehen. Den letztgenannten Bereich stärkte Novartis im Oktober mit der 2.1 Milliarden US-Dollar schweren Übernahme von Endocyte. Das US-Biotechunternehmen entwickelt eine nuklearmedizinische Therapie zur Behandlung von Prostatakrebs. Narasimhan traut dem Wirkstoff der 2021 an den Markt kommen soll, Spitzenumsätze von mehr als einer Milliarde US-Dollar zu. Neue Produkte wie das Herzmedikament Entresto oder Cosentyx gegen Schuppenflechte schoben zuletzt das Geschäft von Novartis an: Im dritten Quartal 2018 verbuchte der Konzern ein währungsbereinigtes Umsatzwachstum von sechs Prozent. Das Management erhöhte daraufhin die Prognose für das Gesamtjahr. (Quelle: Thomson Reuters, Medienbericht, 18.10.2018)
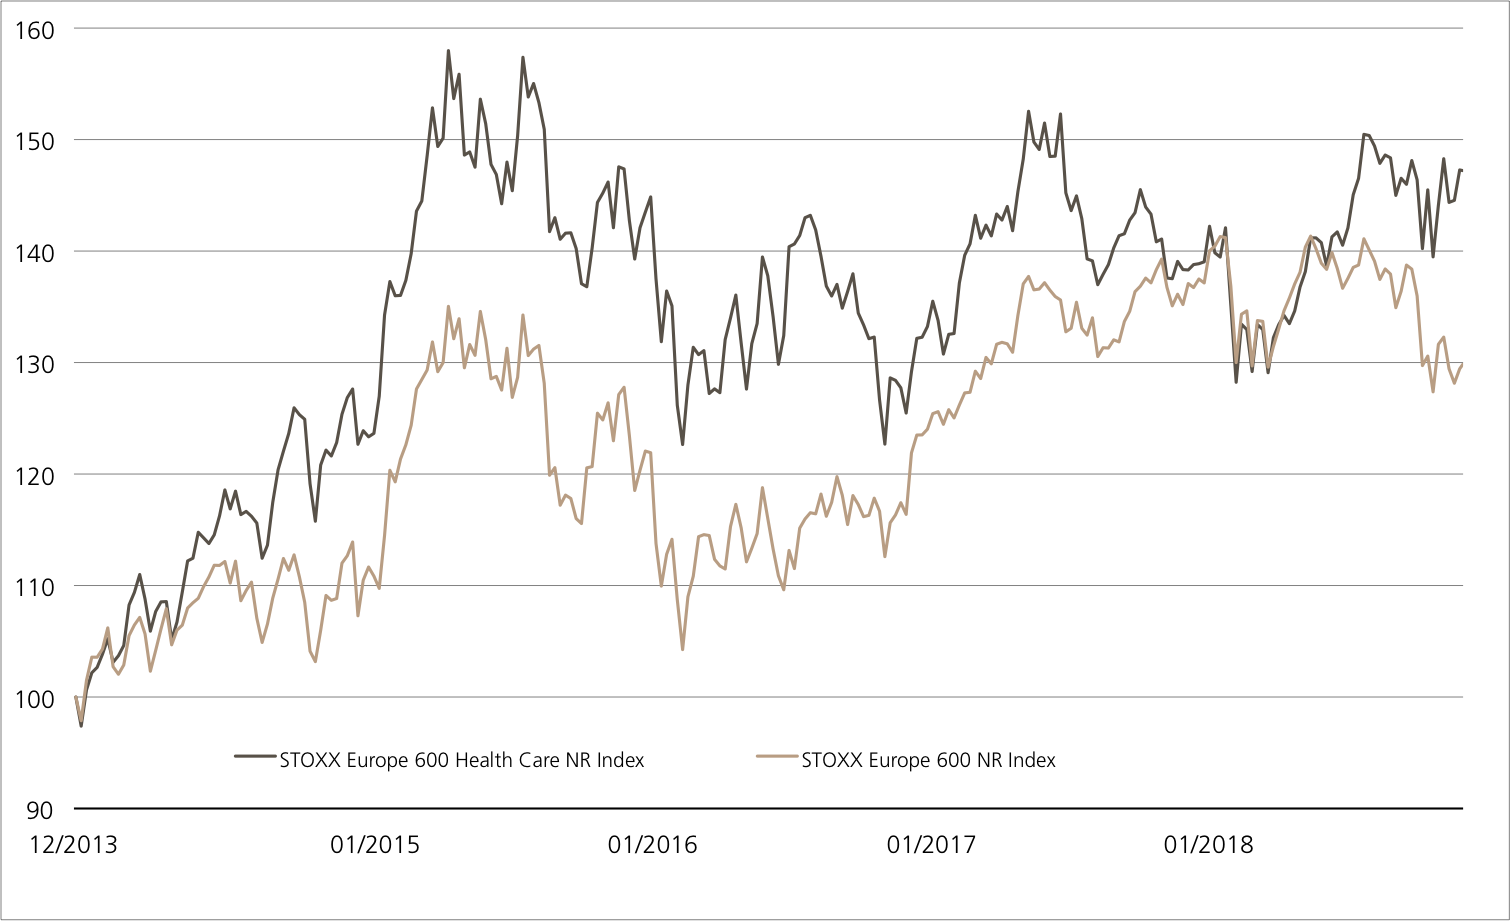
Auch Roche, der gemessen an der Gewichtung zweitgrösste Konzern im STOXX™ Europe 600 Health Care Index, hat Rückenwind. Am 4. Dezember legte das Unternehmen positive Studiendaten für Venclexta zur Behandlung von Blutkrebs vor. Dagegen stiess GlaxoSmithKline (GSK) mit der Übernahme des US-Krebsspezialisten Tesaro auf wenig Begeisterung. Offenbar ist Börsianern der Kaufpreis von 5.1 Milliarden US-Dollar zu hoch – die GSK-Aktie gab deutlich nach. (Quelle: Thomson Reuters Medienbericht, 03.12.2018)
Chancen: Ungeachtet dessen ist der STOXX™ Europe 600 Health Care Index drauf und dran, nach oben aus dem übergeordneten Abwärtstrend auszubrechen. Mit dem ETT (ETHEA) lässt sich sowohl eine kurzfristige Tradingstrategie als auch ein dauerhafter Buy-and-Hold-Ansatz verfolgen – das Produkt bildet den Basiswert 1:1 ab. Dabei fallen keine Verwaltungsgebühren an.² Beim ER Kick-In GOAL (Symbol: KCOCDU) reicht eine stabile Entwicklung von Bayer, GSK und Novartis, damit die Seitwärtsrendite von 12.4 Prozent p.a. Realität wird. Knapp zwei Monate nach der Anfangsfixierung notiert das Produkt zwar deutlich unter dem Emissionspreis. Gleichwohl beträgt der Barriereabstand selbst bei Bayer, dem aktuell schwächsten Titel aus dem Trio, noch 26.8 Prozent. Wegen der intregrierten Early Redemption Funktion ist bei diesem Kick-In GOAL eine vorzeitige Rückzahlung samt anteiligem Coupon möglich.
Risiken:Die vorgestellten Produkte sind nicht kapitalgeschützt. Eine negative Entwicklung des Basiswerts führt beim ETT zu entsprechenden Verlusten. Notiert einer der Basiswerte beim Worst of Kick-In GOAL während der Laufzeit einmal auf oder unter dem jeweiligen Kick-In Level (Barriere) und kommt zudem des Early-Redemption-Feature nicht zum Tragen, kann die Rückzahlung am Verfalltag durch Bartilgung entsprechend der (vom Strike aus) schwächsten Performance aus dem Trio erfolgen (höchstens jedoch zum Nominalwert zuzüglich Coupon). In diesem Fall sind Verluste wahrscheinlich. Zudem trägt der Anleger bei Strukturierten Produkten das Emittentenrisiko, so dass das eingesetzte Kapital – unabhängig von der Entwicklung des Basiswertes – im Falle einer Insolvenz der UBS AG verloren gehen kann.
²) Die Konditionen der ETTs werden jährlich überprüft und können mit einer Frist von 13 Monaten nach Bekanntgabe angepasst werden
| Symbol | ETHEA |
| SVSP Name | Tracker-Zertifikat |
| SPVSP Code | 1300 |
| Basiswert | STOXX™ Europe 600 Health Care EUR Net Return Index |
| Bezugsverhältnis | 1:1 |
| Handelswährung | EUR |
| Verwaltungsgebühr | 0.00% p.a.² |
| Partizipation | 100% |
| Verfall | Open End |
| Emittentin | UBS AG, London |
| Geld-/Briefkurs | EUR 1’1302.00 / 1’310.00 |
| Symbol | KCOCDU |
| SVSP Name | Barrier Reverse Convertible |
| SPVSP Code | 1230 (Auto-Callable) |
| Basiswerte | Bayer / GlaxoSmithKline / Novartis |
| Handelswährung | CHF |
| Coupon | 7.50% p.a. |
| Seitwärtsrendite |
24.50% (12.42% p.a.) |
| Kick-In Level (Abstand) |
Bayer: EUR 48.0064 (26.83%) GSK: GBP 9.495 (34.91%) Novartis: 54.0928 (40.14%) |
| Verfall | 12.10.2020 |
| Emittentin | UBS AG, London |
| Geld-/Briefkurs | 90.35% / 91.35% |
| Index | Stand | Woche¹ |
|---|---|---|
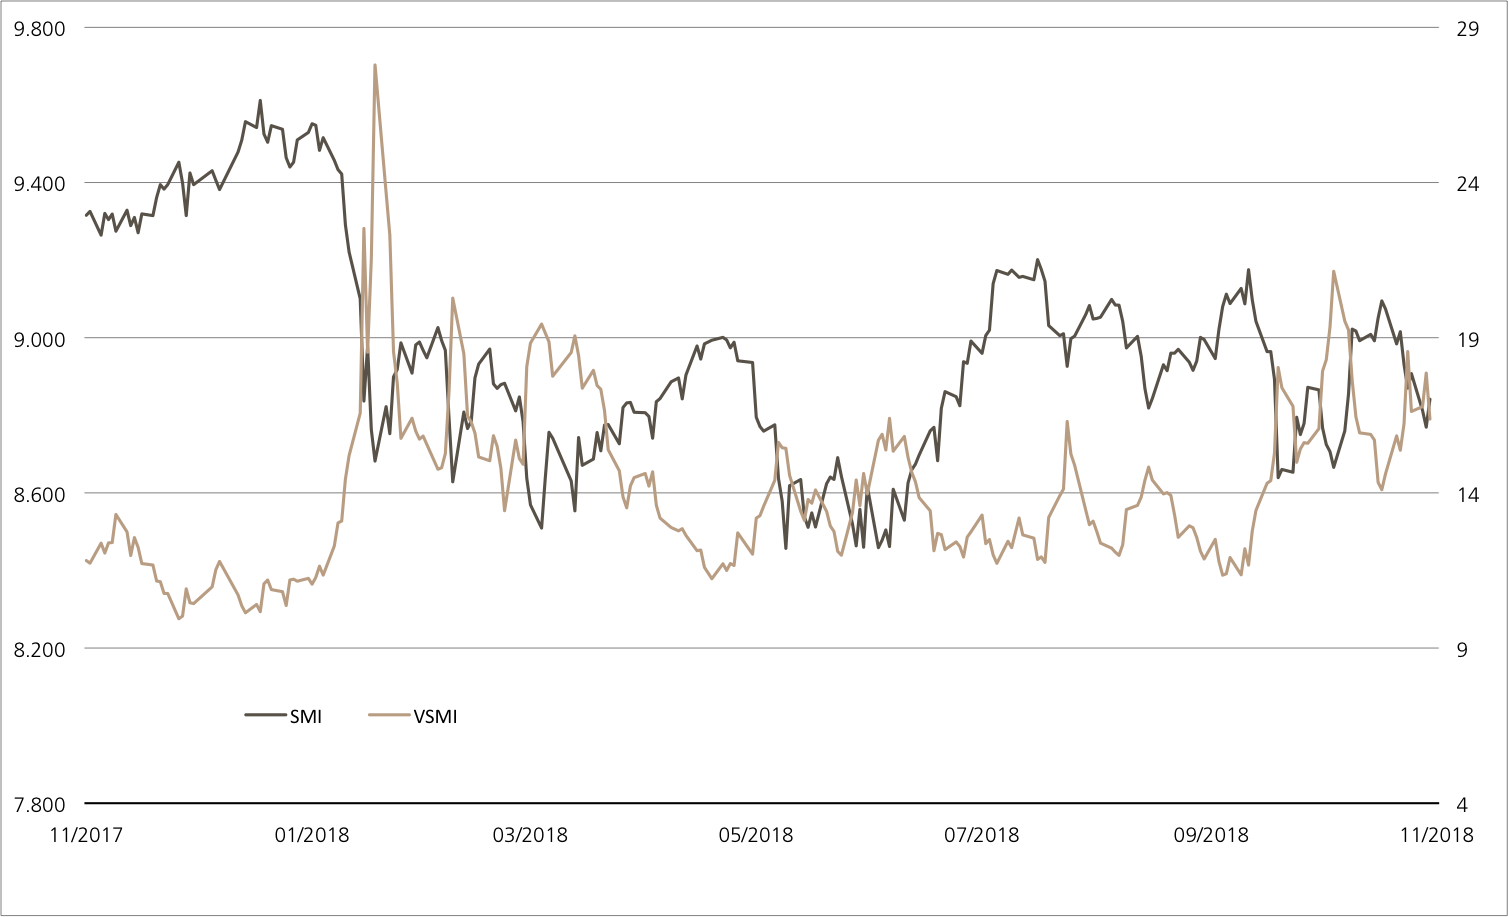
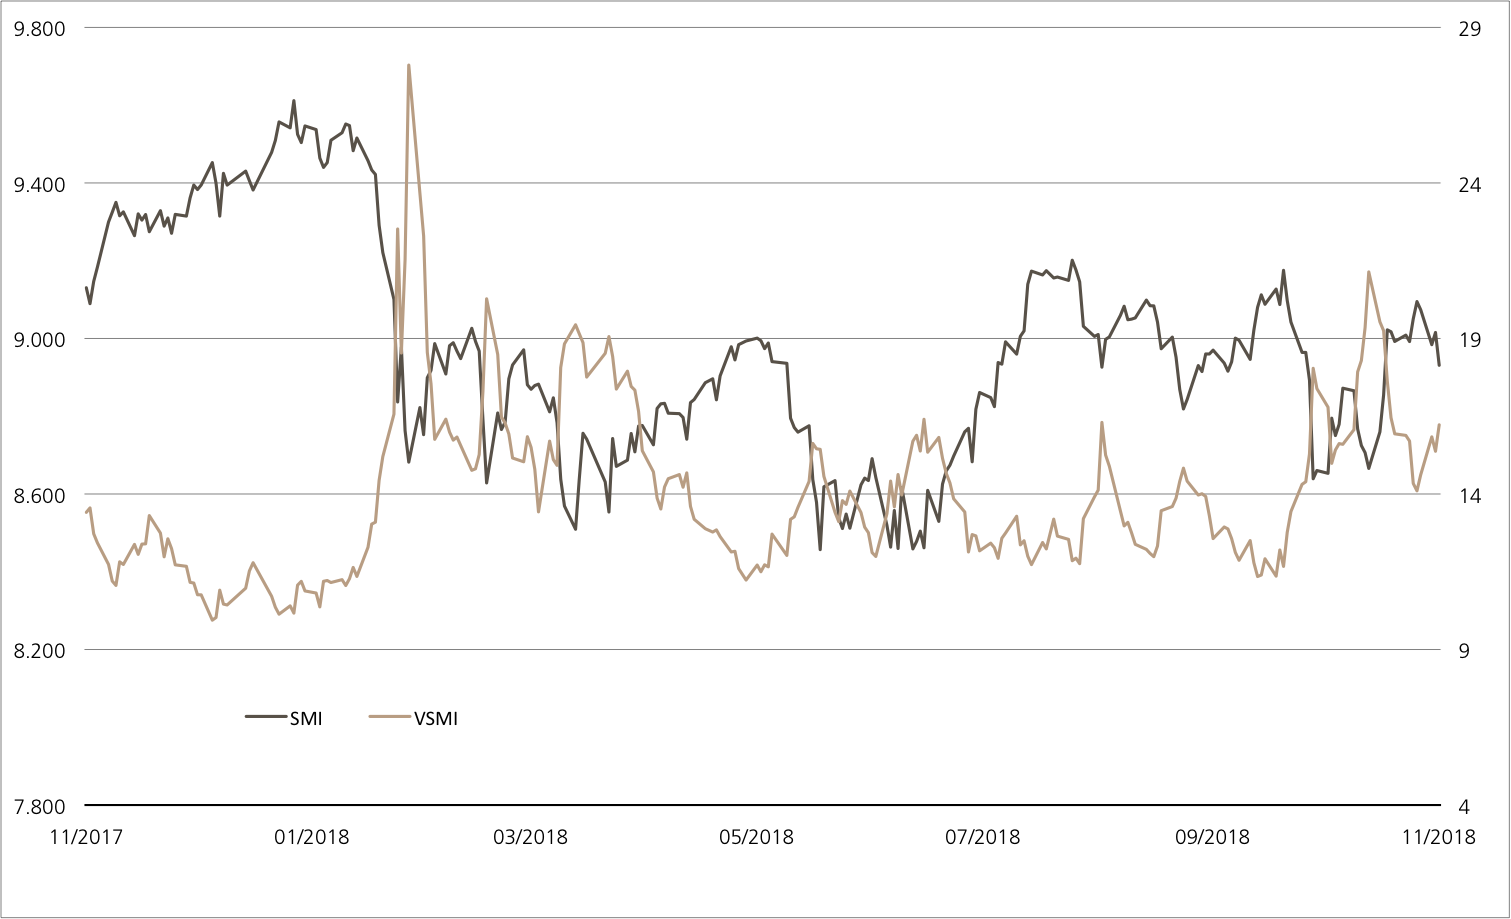
| SMI™ | 8’939.96 Pkt. | 0.5% |
| SLI™ | 1’377.32 Pkt. | 0.0% |
| S&P 500™ | 2’700.06 Pkt. | -1.6% |
| EURO STOXX 50™ | 3’150.27 Pkt. | -0.6% |
| S&P™ BRIC 40 | 3’989.49 Pkt. | 0.8% |
| CMCI™ Compos. | 898.60 Pkt. | 2.0% |
| Gold (Feinunze) | 1’242,60 USD | 1.0% |
US-Technologie
Kampf um die Vorherrschaft
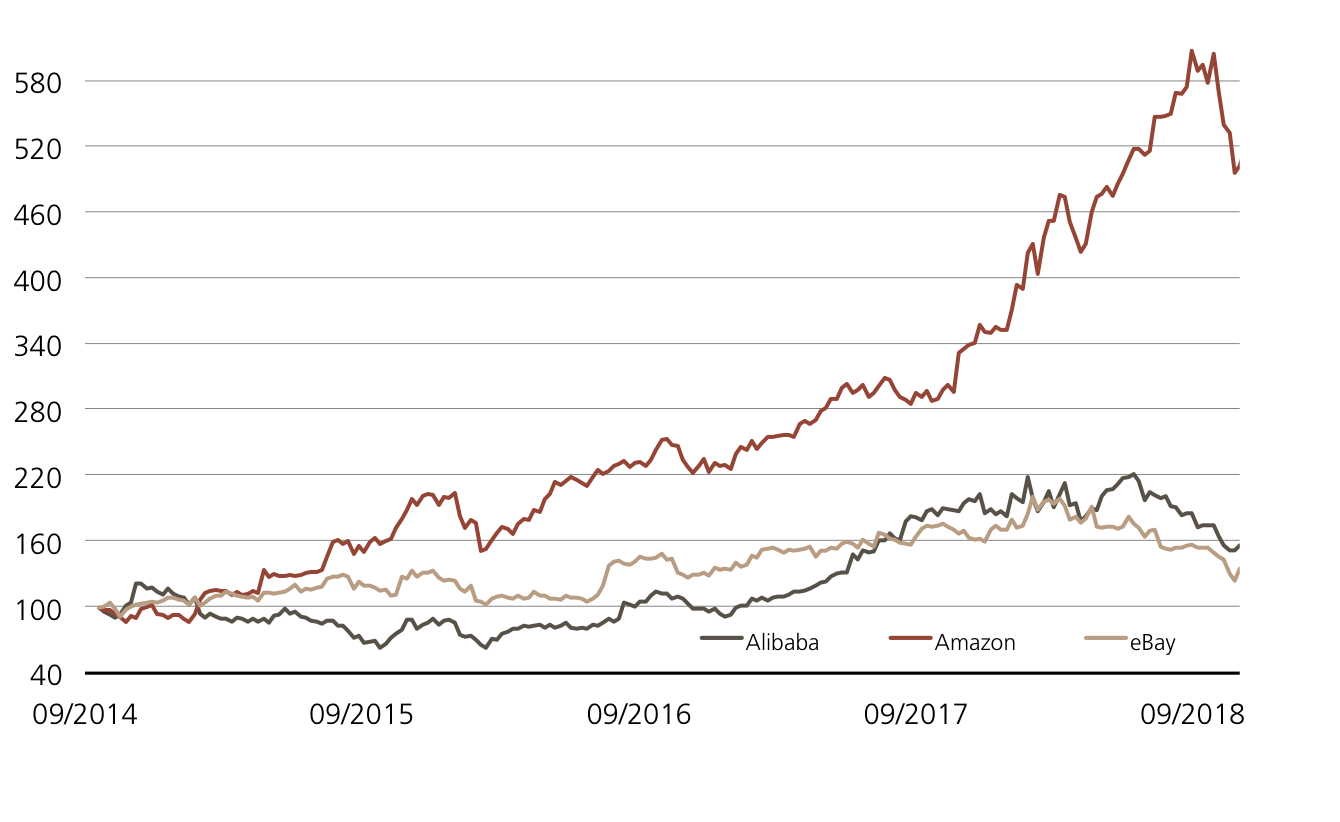
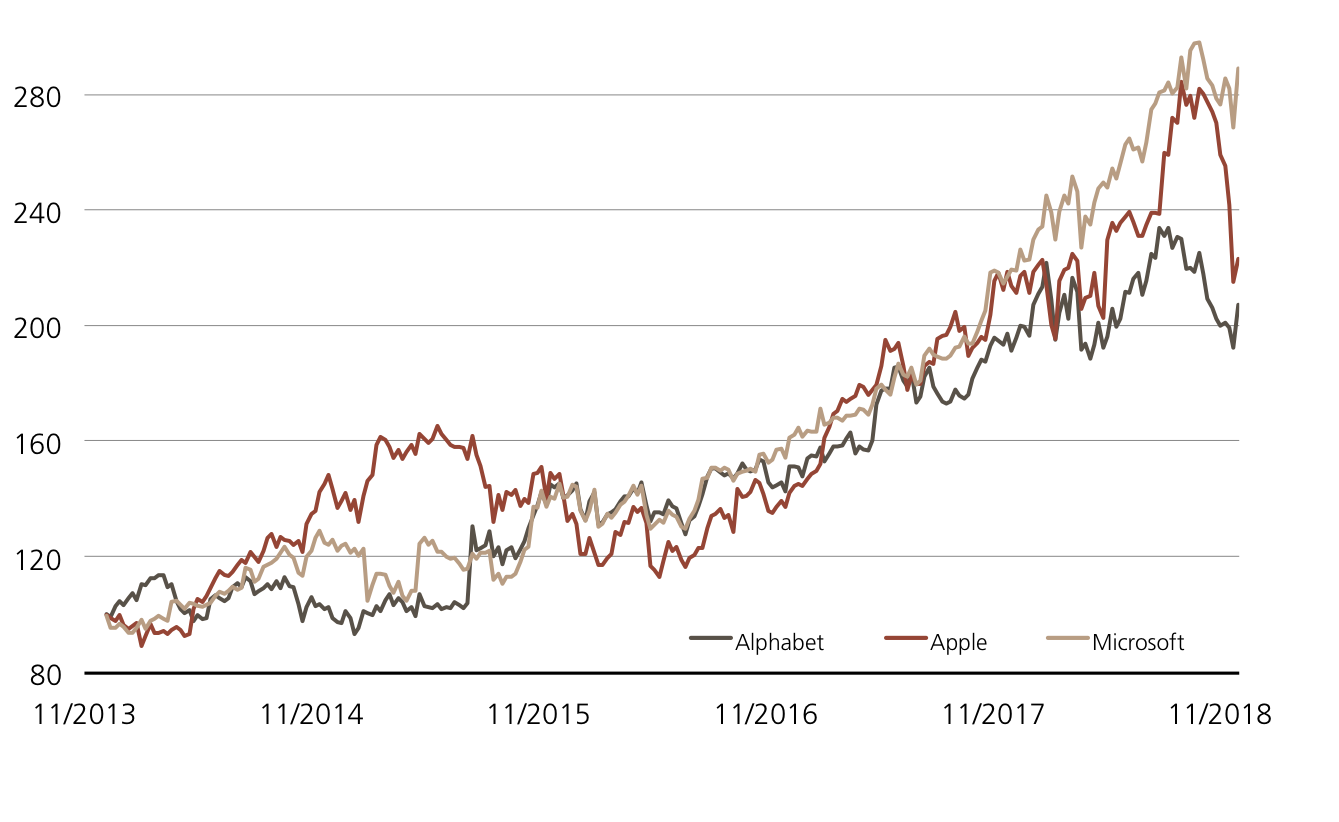
Lange Zeit galt Microsoft als «Digitaler Dinosaurier», sozusagen vom Aussterben bedroht. Doch der seit 2014 amtierende CEO Satya Nadella entstaubte das 1975 gegründete Unternehmen und schaffte es mit der Fokussierung auf die Cloud, das Ruder herumzureissen. Mittlerweile ist der Konzern mit seiner Cloud-Lösung «Azure» zur Nummer zwei hinter Amazon und noch vor der Alphabet-Tochter Google aufgestiegen. Allein im ersten Quartal des Geschäftsjahres 2018/19 legte Azure um 76 Prozent zu. Der Erfolg kommt auch an der Börse gut an. Am 28. November besetzte Microsoft erstmals seit dem Jahr 2000 wieder die Spitzenposition als weltvollstes börsennotiertes Unternehmen und stiess gleichzeitig Apple vom Thron. Beim iPhone-Hersteller läuft es operativ zwar ebenfalls gut, jedoch keimten zuletzt Sorgen an der Börse auf. Berichte von Zulieferern legen nahe, dass die Verkäufe der aktuellen iPhone-Generation unter den Erwartungen liegen. (Quelle: Handelsblatt, Medienbericht, 01.12.2018)
Chancen:Auch wenn die Aufwärtsfahrt der Tech-Aktien zuletzt etwas stockte, im Vergleich zu Silvester 2017 notieren die Branchengrössen Alphabet, Apple und Microsoft noch deutlich im positiven Bereich.¹ Eine weitere Verschnaufpause des Trios würde dem ER Worst of Kick-In GOAL (Symbol: KCTKDU) keine Probleme bereiten. Der Coupon von 9.50 Prozent p.a. wird unabhängig vom Kursverlauf bezahlt. Aktuell liegt die Maximalrendite sogar noch höher, da der Kick-In GOAL unter pari notiert. Um sie zu erreichen, ist es wichtig, dass die Barriere der Basiswerte unversehrt bleiben. Den geringsten Puffer weist mit 28.7 Prozent derzeit Apple auf. Sollten das Trio an einem der vierteljährlichen Beobachtungstage (erster Termin: 07.11.2019) gemeinsam auf oder über dem Startlevel notieren, wird das Produkt aufgrund der ER-Funktion vorzeitig fällig.
Risiken:ER Kick-In GOALs sind nicht kapitalgeschützt. Notiert einer der Basiswerte während der Laufzeit einmal auf oder unter dem jeweiligen Kick-In Level (Barriere) und kommt zudem des Early Redemption Feature nicht zum Tragen, kann die Tilgung am Verfalltag durch Bartilgung entsprechend der (vom Strike aus) schwächsten Performance aus dem Trio erfolgen (höchstens jedoch zum Nominalwert zuzüglich Coupon). In diesem Fall sind Verluste wahrscheinlich. Zudem trägt der Anleger bei Strukturierten Produkten das Emittentenrisiko, so dass das eingesetzte Kapital – unabhängig von der Entwicklung des Basiswertes – im Falle einer Insolvenz der UBS AG verloren gehen kann.
| Symbol | KCTKDU |
| SVSP Name | Barrier Reverse Convertible |
| SPVSP Code | 1230 (Auto-Callable) |
| Basiswerte | Alphabet Inc. A / Apple / Microsoft |
| Handelswährung | USD |
| Coupon | 9.50% p.a. |
| Seitwärtsrendite | 22.78% (11.40% p.a.) |
| Kick-In Level (Abstand) |
Alphabet: USD 664.944 (37.42%) Apple: USD 125.97 (28.71%) Microsoft: USD 67.176 (38.10%) |
| Verfall | 23.10.2020 |
| Emittentin | UBS AG, London |
| Geld-/Briefkurs | 95.37% / 96.37% |
Termsheet Weitere Produkte sowie Informationen zu Chancen und Risiken finden Sie unter: ubs.com/keyinvest Quelle: UBS AG Stand: 05.12.2018
²) Die Konditionen der ETTs werden jährlich überprüft und können mit einer Frist von 13 Monaten nach Bekanntgabe angepasst werden
Rohstoffmonitor November 2018
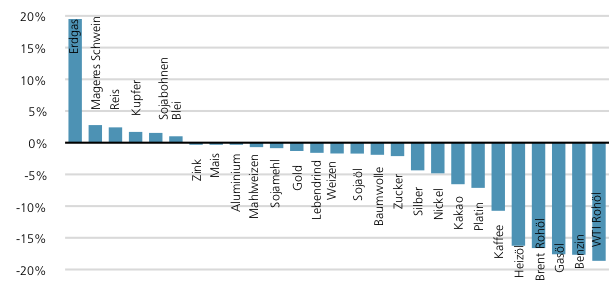
Total-Return-Performance der UBS Bloomberg CMCI Einzelrohstoff-Indizes im November 2018 in US-Dollar.
Stand: 30.11.2018Quelle: UBS AG
Januar 2007.
| Produkt | Symbol | Währung | Monatsperformance¹ | Anteil am Gesamtvolumen |
|---|---|---|---|---|
| UBS ETC on CMCI 2X SH CMCI WTI 3-M | OIL2S | USD | 49.5% | 28.2% |
| UBS ETC on CMCI Brent Crude | TCOCI | USD | -17.9% | 19.0% |
| UBS ETC on CMCI WTI Crude Oil | ECLCI | EUR | -21.9% | 10.9% |
| UBS Bloomberg CMCI Agriculture 1Y | TAG1YU | USD | -1.9% | 4.6% |
| UBS ETC on CMCI WTI Crude Oil | CCLCI | CHF | -21.7% | 4.0% |
| UBS ETC on CMCI Composite | CCMCI | CHF | -6.4% | 3.9% |
| UBS Bloomberg CMCI Nickel TR Index (U | TLNCIU | USD | -5.9% | 3.9% |
| UBS ETC on CMCI WTI Crude Oil | TCLCI | USD | -21.7% | 3.2% |
| UBS ETC on CMCI Nickel | TLNCI | USD | -6.5% | 2.8% |