Die Gewinnsträhne hält an
23. April 2019 – UBS Wochenkommentar Rück-/Ausblick
Die Gewinnsträhne hält an
In der Vor-Osterwoche blieb das Umfeld für Aktien weiterhin günstig. Sowohl von konjunktureller als auch von unternehmerischer Seite war die Nachrichtenlage positiv. Für eine faustdicke Überraschung sorgte China. Die weltweit zweitgrösste Volkswirtschaft expandierte im ersten Quartal um 6.4 Prozent und damit etwas schneller als von Ökonomen erwartet. Auch die Industrie-Produktion zog im März erstaunlich stark um 8.5 Prozent zum Vorjahresmonat an. Das war der höchste Anstieg seit mehr als viereinhalb Jahren. (Quelle: Thomson Reuters, Medienbericht, 17.04.2019)
Überraschend starke Schweizer Schwergewichte
Für Verblüffung sorgten auch die beiden heimischen Schwergewichte Nestlé und Roche – und das ebenfalls im positiven Sinne. Aufgrund anziehender Preise und florierender Geschäfte in Amerika und Asien zog das um Sondereffekte bereinigte organische Wachstum von Nestlé von Januar bis März um 3.4 Prozent an. Die Analystenzunft hatte dagegen nur ein durchschnittliches Plus von 2.8 Prozent erwartet. (Quelle: Thomson Reuters, Medienbericht, 18.04.2019)
Während der weltgrösste Nahrungsmittelhersteller seine Gesamtjahresprognose, welche einen Umsatzzuwachs von drei Prozent vorsieht, „nur“ bestätigte, schraubte Roche bei seiner Bilanzvorlage die Ziele leicht nach oben. Der Pharmariese möchte die Erlöse im laufenden Jahr um einen mittleren einstelligen Prozentbetrag steigern, bisher war von einem niedrigen bis mittleren einstelligen Prozentbereich die Rede. Der Gewinn soll sich proportional zum Umsatz entwickeln. Im ersten Quartal erzielte der weltweit führende Krebsmittelhersteller Erlöse in Höhe von 14.8 Milliarden Franken und damit vier Prozent mehr als Analysten auf der Rechnung hatten. (Quelle: Thomson Reuters, Medienbericht, 17.04.2019)
Der Finanzsektor im Fokus
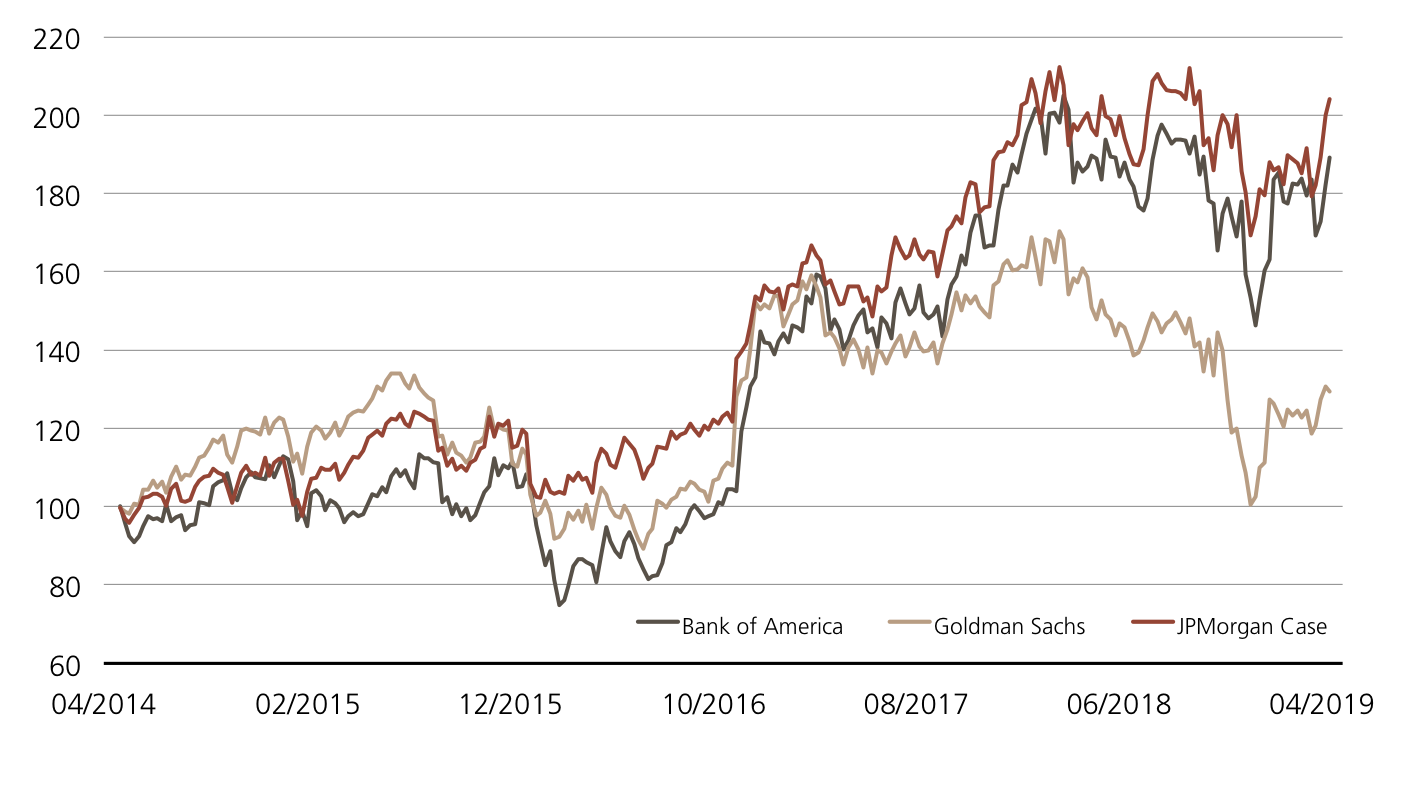
Auch in Übersee setzte sich die Serie an positiven Bilanzüberraschungen fort. Mittlerweile haben 15 Prozent der S&P 500-Mitglieder ihre Zahlenkränze veröffentlicht und dabei 78 Prozent beim Ergebnis und 53 Prozent beim Umsatz die Erwartungen übertroffen. Am besten schnitt in der vergangenen Woche der Sektor „Communication Services“ ab. Dies war vor allem Netflix zu verdanken, die einen Gewinn je Aktie von 0.76 US-Dollar auswiesen. Die Wall Street hatte dagegen nur mit 0.58 US-Dollar gerechnet. Auch der Finanzsektor konnte erneut überzeugen: Nachdem JP Morgan Chase bereits in der Vorwoche mit einem Rekordgewinn auch sich aufmerksam machte, konnte in Folge auch die Bank of America (0.70 US-Dollar gegenüber erwarteten 0.66 US-Dollar), Goldman Sachs (5.71 US-Dollar vs. 4.89 US-Dollar) und Morgan Stanley (1.33 US-Dollar vs. 1.17 US-Dollar) die Prognosen beim Ergebnis je Aktie jeweils deutlich übertreffen. (Quelle: Factset, Earnings Insight, 18.04.2019).
Wer sich die US-Banken ins Depot holen möchte, kann einen Blick auf den Early Redemption Kick-In GOAL (Symbol: KCODDU) werfen. Das Produkt lautet auf die Bank of America, Goldman Sachs und JP Morgan Chase stellt eine Renditechance von 10.4 Prozent p.a. in Aussicht. Kursavancen sind dazu nicht von Nöten, es reicht, wenn die Basiswerte ihre Barrieren bis zum Laufzeitende unversehrt lassen. Aktuell weist die Aktie von Goldman Sachs mit 33.2 Prozent den geringsten Abstand zum Kick-In-Level auf.
In der neuen Woche kommt nun auch in den europäischen Finanzsektor Schwung. So wird unter anderem die Deutsche Bank ihre Bücher öffnen. Analysten gehen im Investmentbanking von einem Einbruch der Erträge von 3.85 auf 3.3 Milliarden Euro aus. Allerdings warten die Marktteilnehmer nicht nur auf die nackten Zahlen der Deutschen Bank, vielmehr erhoffen sie sich Neuigkeiten bezüglich der Fusionsbemühungen mit der Commerzbank. Noch bevor die Frankfurter am Freitag vor das Mikro treten, wird hierzulande die Credit Suisse am Mittwoch ihre Bilanz präsentieren. Der Durchschnitt der Analysten erwartet Umsätze von 5.25 Milliarden Franken, ein Rückgang von 6.8 Prozent im Vergleich zur Vorjahresperiode. Der Nettogewinn wird bei 692 Millionen Franken erwartet, was in etwa der Höhe auf 2018 entspricht. (Quelle: Thomson Reuters, Medienbericht, 18.04.2019)
Die Zahlenflut hält an
Mit Novartis wird auch noch ein Schwergewicht im SMI in dieser Woche Einblick in den Geschäftverlauf geben. Exklusive Alcon, geht der Konsens von einem Umsatz von 10.88 Milliarden Franken aus, 0.31 Prozent weniger als im Vorjahr. Der Kerngewinn je Aktie soll 1.19 Franken erreichen, was einen um rund sieben Prozent niedrigeren Wert entspricht. Bei den Medikamentenerlösen wird vor allem dem Herzmittel Entresto Potenzial eingeräumt. Dessen Verkäufe sollen sich um 80 Prozent auf 79 Millionen Franken erhöhen. (Quelle: Thomson Reuters, Medienbericht, 17.04.2019)
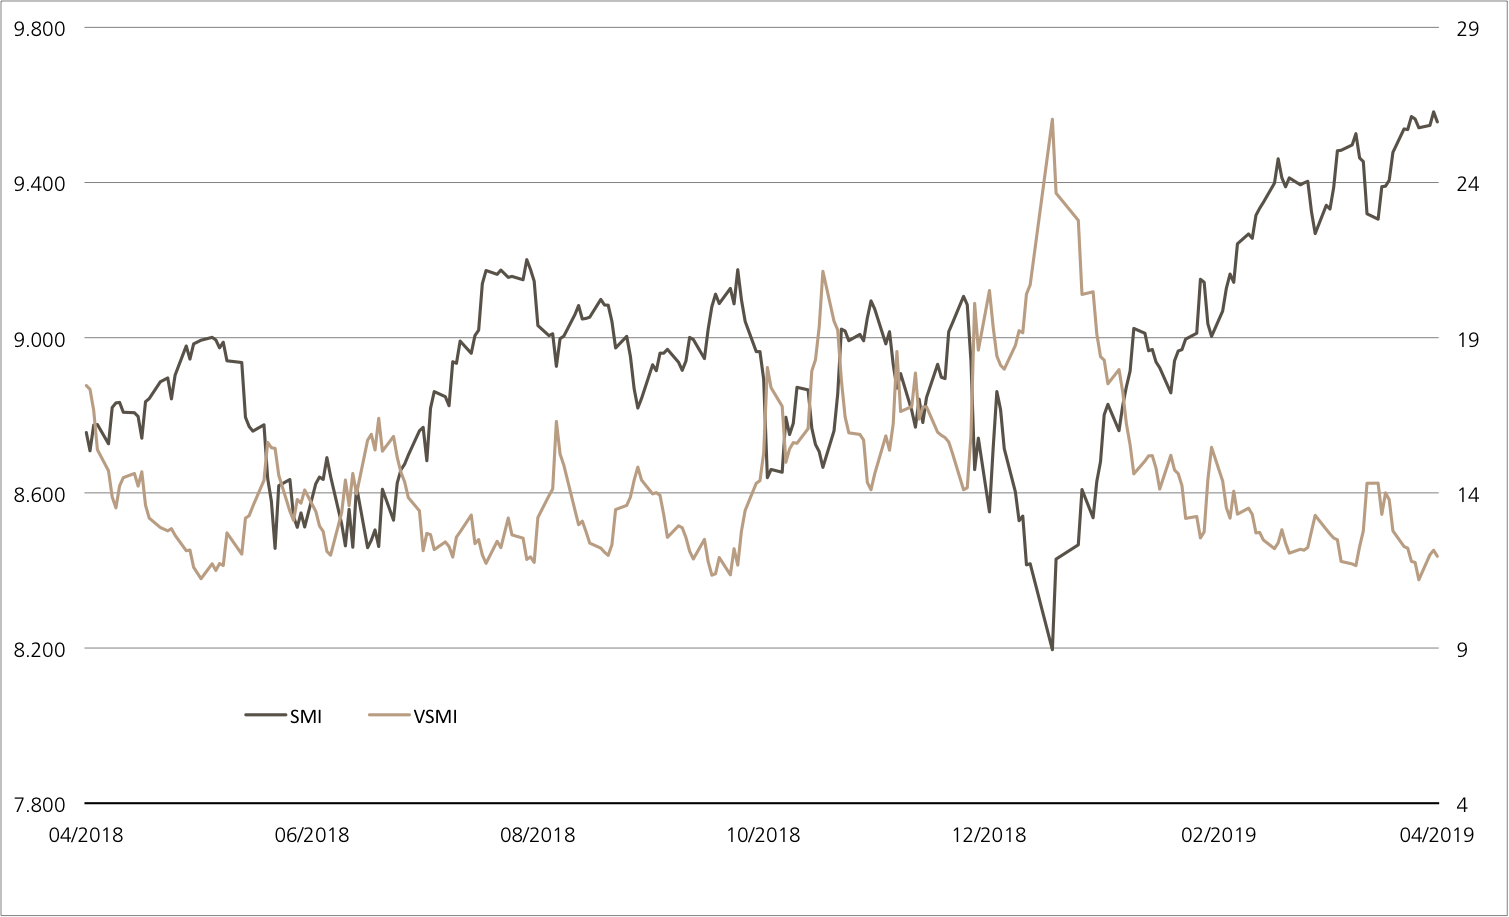
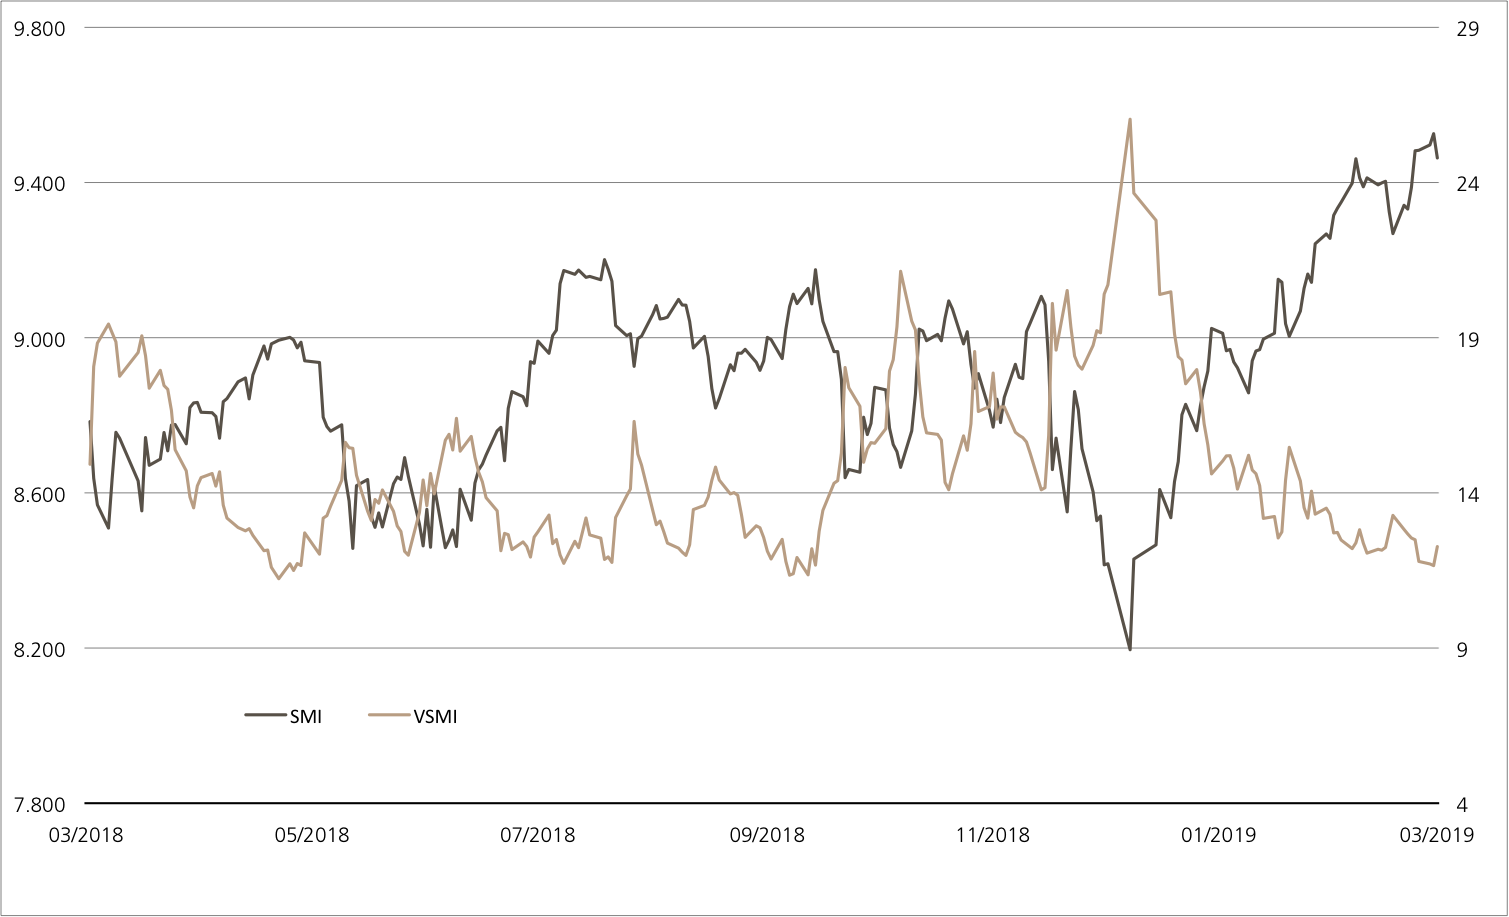
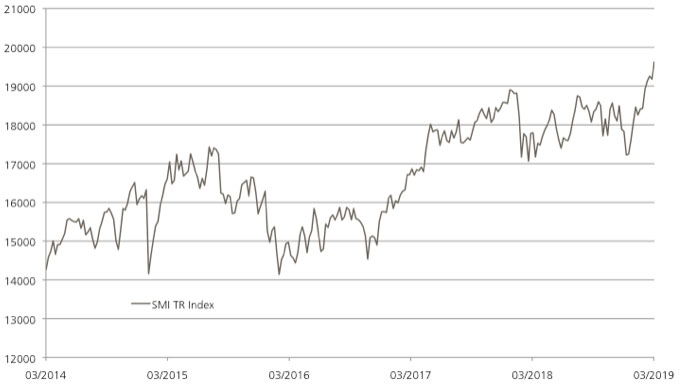
Halten die positiven Meldungen aus den Unternehmen an, könnte das den Kursen eine weitere Unterstützung bieten. In der Woche vor Ostern zog der SMI um 0.9 Prozent an. Seit Jahresbeginn summiert sich das Kursplus auf 13.5 Prozent. Der S&P 500 liegt sogar 15.9 Prozent vorne.* Neben den Bilanzen steht auch in der neuen Woche das Bruttoinlandsprodukt in den USA im Fokus, das am Freitag veröffentlicht wird. Einen Tag zuvor werden die Auftragseingänge langlebiger Güter bereits einen Hinweis geben, wie es um die wirtschaftliche Verfassung der USA bestellt ist.
Bank of America vs. Goldman Sachs vs. JP Morgan Chase (5 Jahre, nur zu illustrativen Zwecken, Angaben in %)*
Stand: 23.04.2019; Quelle: Thomson Reuters
¹) Bitte beachten Sie, dass vergangene Wertentwicklungen keine Indikationen für künftige Wertentwicklungen sind.
Wichtige Termine
| Datum | Uhrzeit | Unternehmen |
| 23.04.2019 | 13:30 | Twitter, 1. Quartal |
| 23.04.2019 | 22:15 | Ebay, 1. Quartal |
| 24.04.2019 | – | Tesla, 1. Quartal |
| 24.04.2019 | – | Novartis, 1. Quartal |
| 24.04.2019 | 07:00 | Credit Suisse, 1. Quartal |
| 24.04.2019 | 07:00 | SAP, 1. Quartal |
| 24.04.2019 | 22:00 | Microsoft, 3. Quartal |
| 25.04.2019 | – | Kuehne+Nagel, 1. Quartal |
| 25.04.2019 | – | Bristol Myers Squibb, 1. Quartal |
| 25.04.2019 | – | Starbucks, 1. Quartal |
| 25.04.2019 | 07:00 | Nokia, 1. Quartal |
| 25.04.2019 | 09:00 | Nintendo, Jahreszahlen |
| 25.04.2019 | 22:00 | Amazon, 1. Quartal |
| 25.04.2019 | 22:05 | Intel, 1. Quartal |
| 26.04.2019 | 15:00 | Schindler, 1. Quartal |
| 26.04.2019 | 07:00 | Deutsche Bank, 1. Quartal |
| 26.04.2019 | 07:30 | Renault, 1. Quartal |
| 26.04.2019 | 08:00 | Daimler, 1. Quartal |
Stand: 23.04.2019; Quelle: Thomson Reuters
Weitere Blogeinträge:
Zwischen Rezessionsängsten und Gewinnhoffnungen
Follow us on LinkedIn 27. November 2023 Zwischen Rezessionsängsten und Gewinnhoffnungen Bereits seit rund einem Montag geht es mit den Kursen in der Eurozone kontinuierlich aufwärts. Mehr als sieben [...]
Die KI-Fantasie ist zurück
Follow us on LinkedIn 20. November 2023 Die KI-Fantasie ist zurück Aufatmen an der Wall Street und darüber hinaus: Der Stillstand der Regierungsgeschäfte in den USA ist vorerst abgewendet. [...]
Powell gibt den Falken
Follow us on LinkedIn 13. November 2023 Powell gibt den Falken Jerome Powell ist in der vergangenen Woche mehrmals öffentlich aufgetreten. Am Mittwoch sprach der Fed-Präsident ein Grusswort zur [...]
