Weekly Hits: Ölmarkt & Luxussektor


KeyInvest Weekly Hits
Donnerstag, 14.03.2019
  • Thema 1: Ölmarkt – Weniger Druck in der Pipeline
  • Thema 2: Luxussektor – Swatch im Rampenlicht

Ölmarkt
Weniger Druck in der Pipeline

An den Energiemärkten ist derzeit oft von den «OPEC+» die Rede. Hinter diesem Begriff verbirgt sich eine Allianz aus der Organisation erdölexportierender Länder und weiteren Produzenten des schwarzen Goldes, allen voran Russland. Um einer drohenden Überversorgung entgegenzuwirken, hat diese Gruppe die Produktion gedrosselt. Bis dato scheint ihr Kalkül aufzugehen: Seit Anfang Jahr verteuerte sich die Nordseeölgattung Brent um 25 Prozent.¹ UBS CIO GWM traut der Notierung einen weiteren Anstieg zu. Der ETC (Symbol: TCOCIU) bietet eine transparente und kosteneffiziente Partizipation am UBS Bloomberg CMCI Brent Crude Oil USD TR Index. Eine Alternative zur direkten Positionierung im Energieträger ermöglicht der Early Redemption (ER) Kick-In GOAL (Symbol: KDHDDU) auf WTI. Das Zeichnungsprodukt ist mit einem Coupon von 10.00 Prozent p.a. ausgestattet. In die Laufzeit von 18 Monaten startet der Basiswert mit einem Sicherheitspolster von 32.5 Prozent.

Mit dem Jahreswechsel haben die OPEC+ die Ölproduktion um täglich 1.2 Millionen Barrel gedrosselt. Damit reagierte die Allianz auf die Korrektur des Energieträgers im vierten Quartal 2018. Obwohl sich die Notierung mittlerweile erholt hat, dürften die OPEC+ die Schlagzahl vorerst nicht erhöhen. Dafür spricht ein Interview des saudi-arabischen Energieministers Khalid al-Falih. Im Gespräch mit Reuters bekannte sich der Vertreter des führenden OPEC-Mitgliedes zu der Förderbremse. Ihm zufolge wäre es zu früh, vor dem Treffen der Gruppe im Juni etwas an dem Abkommen zu ändern. (Quelle: Thomson Reuters, Medienbericht, 11.03.2019)

UBS CIO GWM setzt sich in einer aktuellen Analyse mit der Nachfrageseite des globalen Ölmarktes auseinander. Die Experten stellen fest, dass China vier Monate infolge mehr als zehn Millionen Barrel Öl pro Tag eingeführt hat. Nach Ansicht von CIO GWM könnte sich dieser Trend fortsetzen. Während der Verbrauch des
weltgrössten Importeurs steigt, ist die inländische Produktion auf ein Mehrjahrestief gefallen. Als ein weiteres Argument für steigende Einfuhren nennen die Analysten eine mögliche Erhöhung der strategischen Reserven.

Generell nimmt China nach Ansicht von CIO GWM eine Art Schwamm-Funktion ein. Mit den steigenden Importen «saugt» Peking überschüssige Ölmengen ab und hilft damit, das Angebot zu verknappen. Befürchtungen, wonach die Nachfrage aus dem Reich der Mitte wegen der sich verlangsamenden Konjunktur abnehmen könnte, teilen die Experten nicht. Da CIO GWM im zweiten Quartal weltweit mit einer Verknappung am Ölmarkt rechnet, könnte Brent in den kommenden Monaten in den Bereich zwischen 70 und 80 US-Dollar klettern. (Quelle: UBS CIO GWM, Energy, «Crude oil: China’s sponge function», 11.03.2019)


Chancen:
Mit dem ETC (Symbol: TCOCIU) auf den UBS Bloomberg CMCI Brent Crude Oil TR Index können Anleger auf einen steigenden Ölpreis setzen. Dank der Positionierung über die gesamte Futures-Kurve erlaubt der Basiswert eine Diversifizierung in punkto Kontrakt-Fälligkeiten. Zum Einsatz kommt auch das optimierte CMCI-Rollverfahren – es kann negative Effekte in einer Contango-Situation reduzieren. Derweil basiert der ER Kick-In GOAL (Symbol: KDHDDU) auf dem nächstfälligen WTI-Future. Solange für diesen während der Laufzeit kein Tagesschlusskurs festgestellt wird, welcher auf oder unter der Barriere von 67.50 Prozent des Startniveaus liegt, wirft das Produkt am Laufzeitende eine Rendite von 10.00 Prozent p.a. ab. Wegen der Early Redemption Funktion besteht die Chance auf eine vorzeitige Rückzahlung samt anteiligen Coupon. Dazu muss WTI an einem Beobachtungstag auf oder über der Anfangsfixierung schliessen.

Risiken:
Die vorgestellten Produkte sind nicht kapitalgeschützt. BeimETC kommt es zu Verlusten, wenn der zugrunde liegende Index fällt. Schliesst der WTI-Preis beim Kick-In GOAL während der Laufzeit einmal auf oder unter dem Kick-In Level (Barriere) und kommt zudem das Early Redemption Feature nicht zum tragen, muss der Terminkontrakt am Verfalltag mindestens wieder auf Höhe des Ausübungspreises notieren. Andernfalls reduziert sich die Tilgung entsprechend dem Rückgang des nächstfälligen WTI-Futures. Der Coupon kommt in jedem Fall zur Auszahlung. Zudem trägt der Anleger bei Strukturierten Produkten das Emittentenrisiko, so dass das eingesetzte Kapital – unabhängig von der Entwicklung des Basiswertes – im Falle einer Insolvenz der UBS AG verloren gehen kann. 
Weitere UBS Produkte sowie Informationen zu Chancen und Risiken finden Sie unter ubs.com/keyinvest.
 
 
Brent-Rohöl (in US-Dollar je Barrel) 5 Jahre¹
Nachdem Brent Anfang Oktober 2018 den höchsten Stand seit annähernd vier Jahren erreicht hatte, fand der Aufwärtstrend ein jähes Ende. Mit dem Jahreswechsel dreht die Nordseegattung wieder nach oben.
 
Quelle: UBS AG, Bloomberg
Stand: 13.03.2019

UBS Bloomberg CMCI Brent Crude Oil TR Index: Zielgewichtungen der Fristigkeiten
Typisch für die CMCI-Methodik erstreckt sich das Engagement bei diesem Brent-Index über die gesamte Forwardkurve. Im Durchschnitt beträgt die Fälligkeit der gehaltenen Terminkontrakte 0.81 Jahre.
 
Quelle: UBS AG, Bloomberg
Stand: März 2019

 
¹) Bitte beachten Sie, dass vergangene Wertentwicklungen keine Indikationen für künftige Wertentwicklungen sind.
 
ETC auf den UBS Bloomberg CMCI Brent Crude Oil USD TR Index

Remove
Symbol TCOCIU
SVSP Name Tracker-Zertifikat
SVSP Code 1300
Basiswert UBS Bloomberg CMCI Brent Crude Oil USD TR Index
Bezugsverhältnis 10:1
Handelswährung USD
Verwaltungsgebühr 0.30% p.a.
Partizipation 100%
Verfall Open End
Emittentin UBS AG, London
Geld-/Briefkurs USD 91.95 / 92.45

Add
 

10.00% p.a. Early Redemption Kick-In GOAL auf WTI Crude Oil

Remove
Symbol KDHDDU
SVSP Name Barrier Reverse Convertible
SVSP Code 1230, Autocallable
Basiswert WTI Crude Oil
Handelswährung USD
Coupon 10.00% p.a.
Kick-In Level (Barriere)
67.50%
Verfall 28.09.2020
Emittentin UBS AG, London
Zeichnung bis 27.03.2019, 15:00 Uhr

Add
 

Weitere Produkte sowie Informationen zu Chancen und Risiken finden Sie unter: ubs.com/keyinvest Quelle: UBS AG, Bloomberg Stand: 13.03.2019
 
Marktübersicht
Index Stand Woche¹
SMI™ 9’387.43 Pkt. -0.2%
SLI™ 1’447.05 Pkt. -0.4%
S&P 500™ 2’810.92 Pkt. 1.4%
EURO STOXX™ 3’323.87 Pkt. 0.0%
S&P™ BRIC 40 4’289.27 Pkt. 0.2%
CMCI™ Compos. 929.97 Pkt. 1.0%
Gold (Feinunze) 1’309.30 USD 1.7%
Add

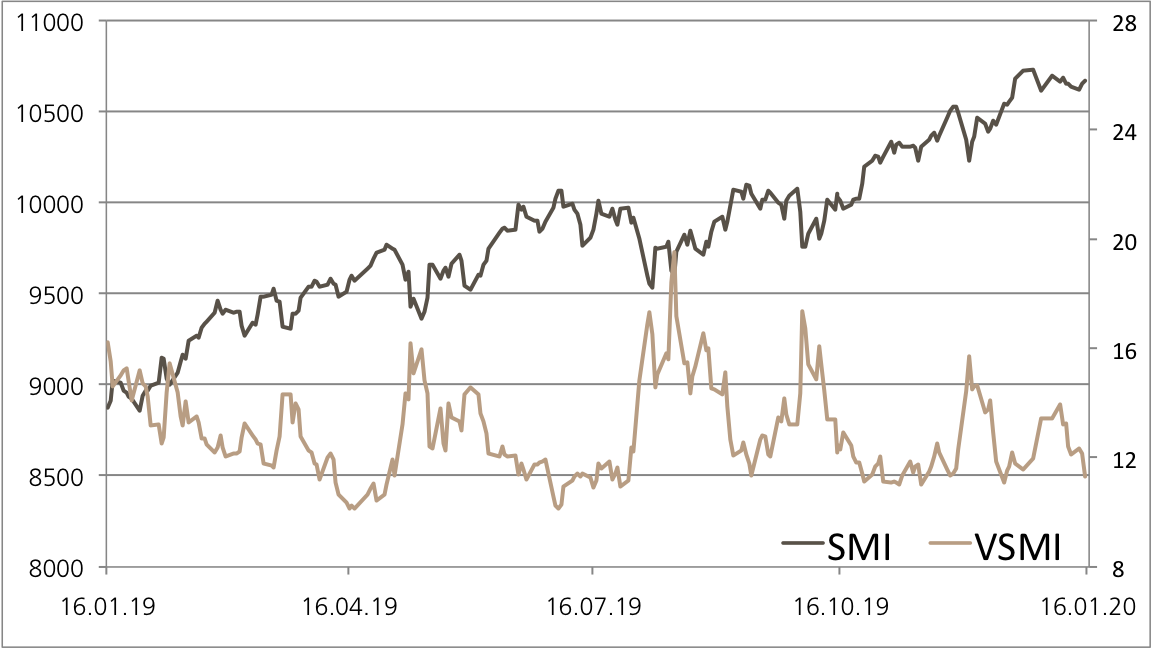
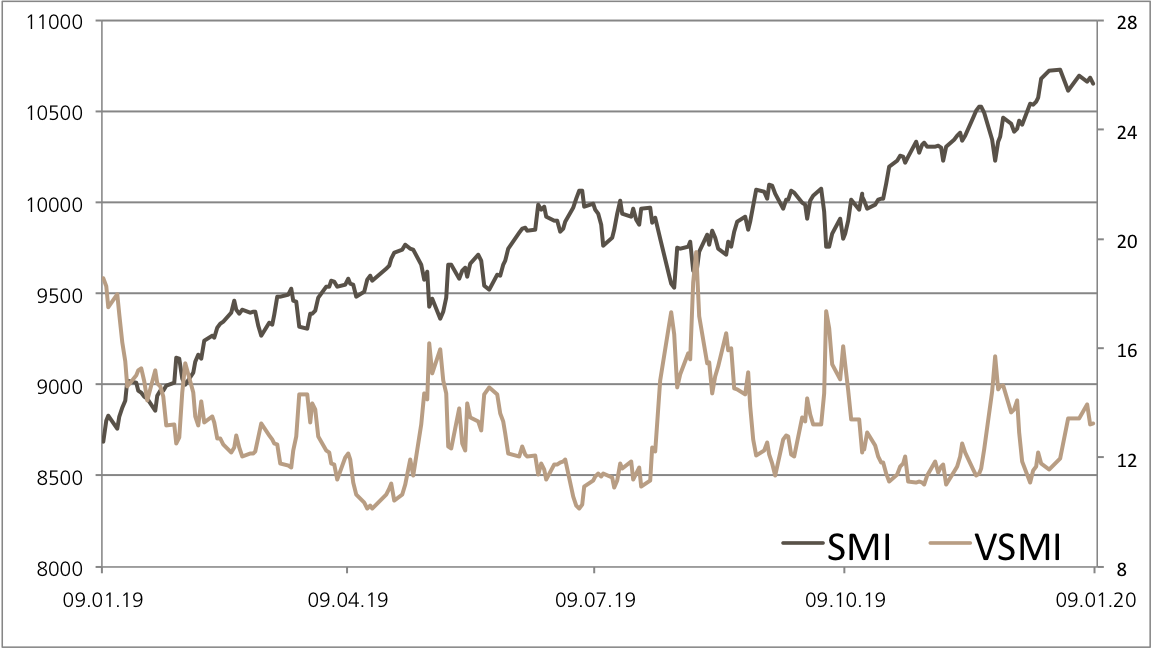
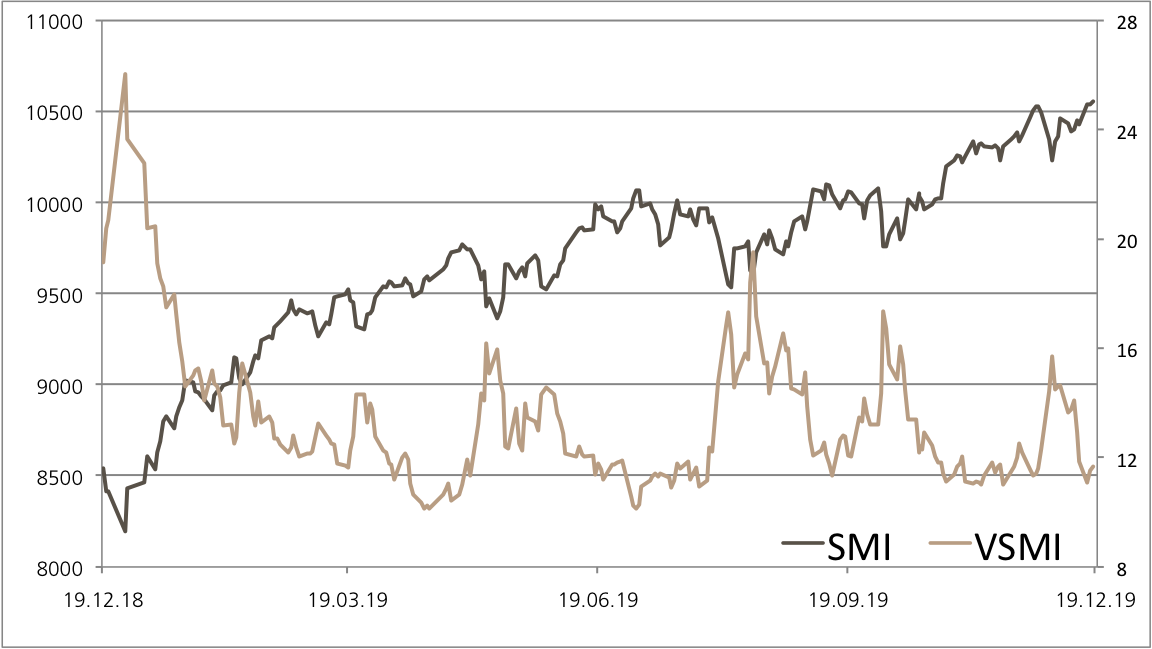
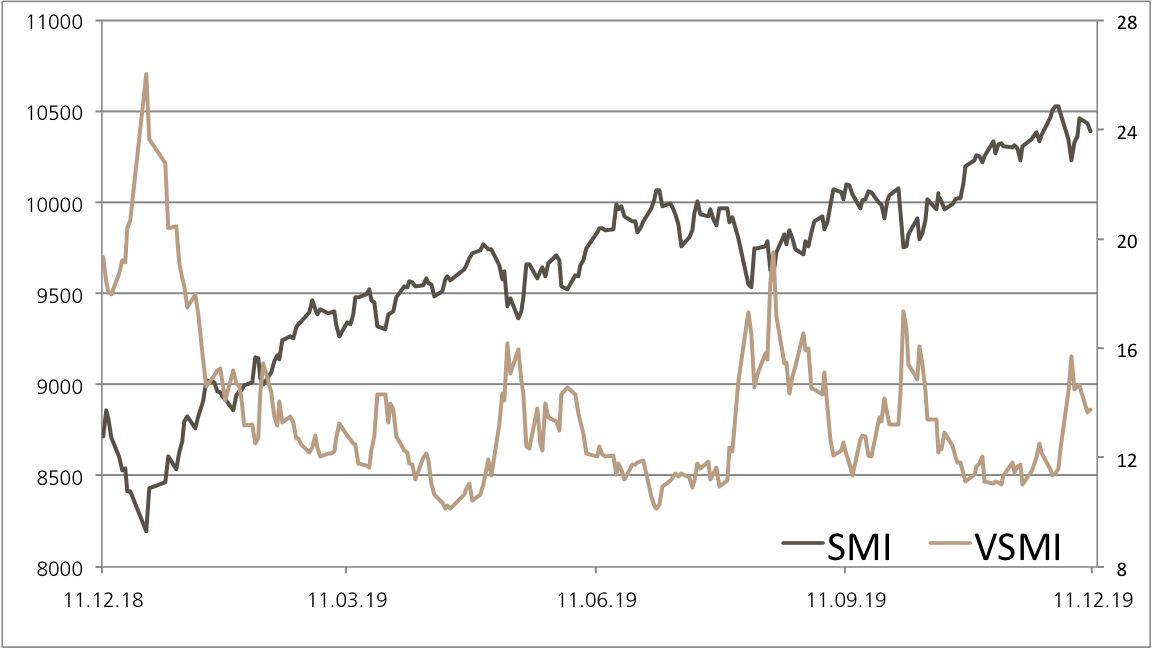
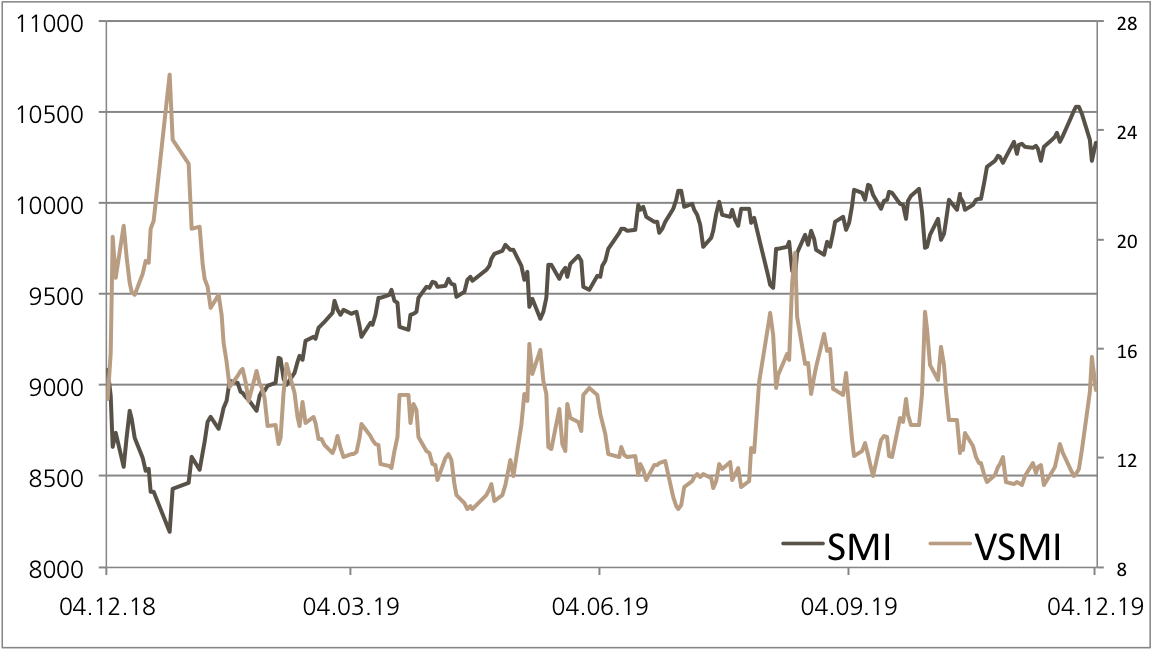
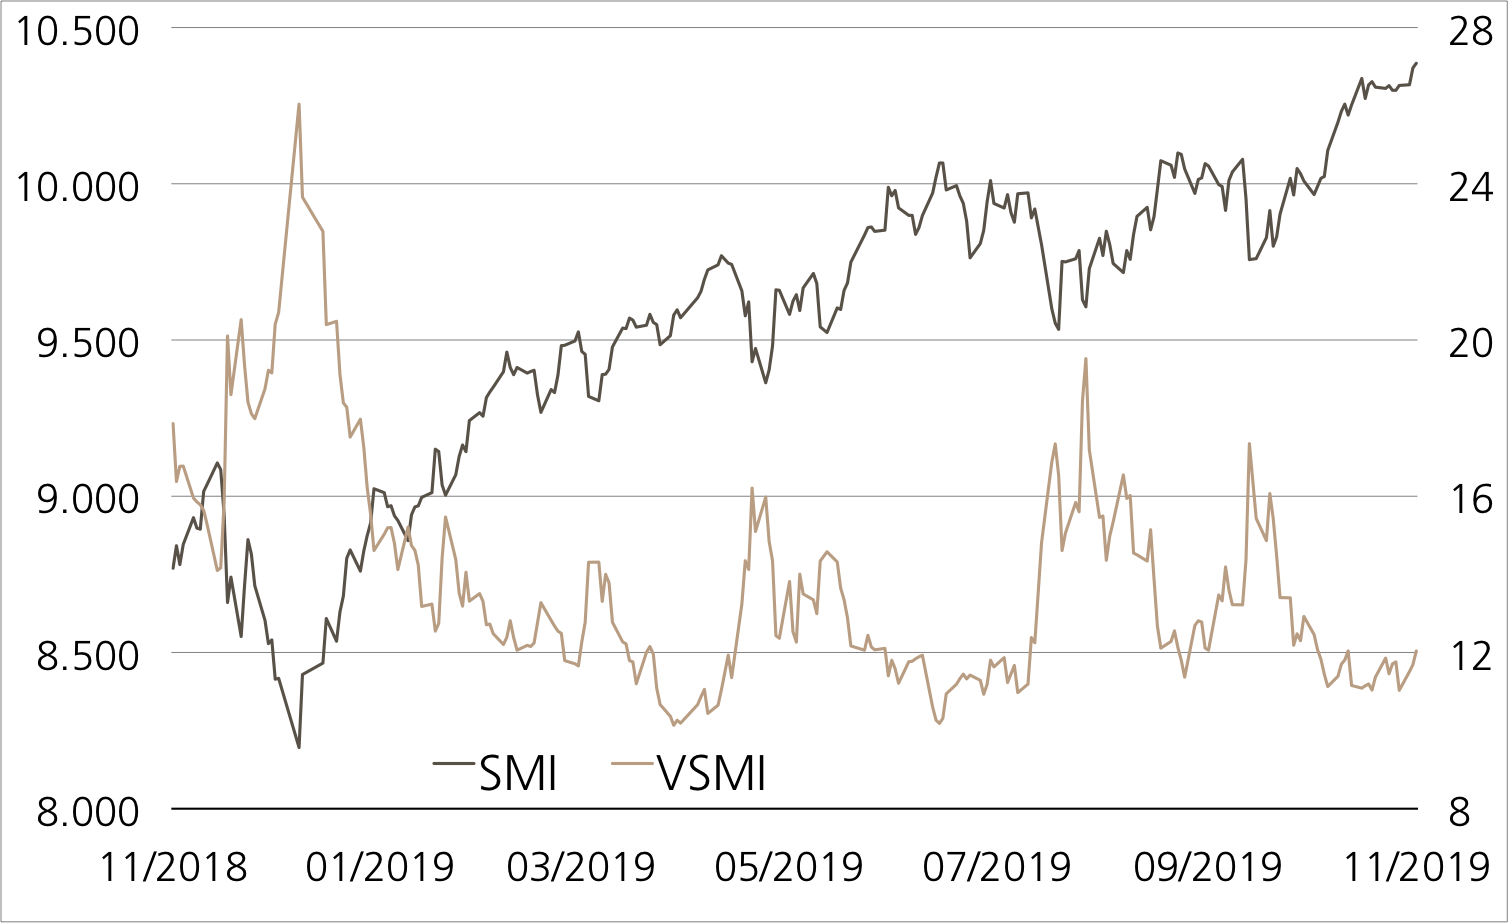
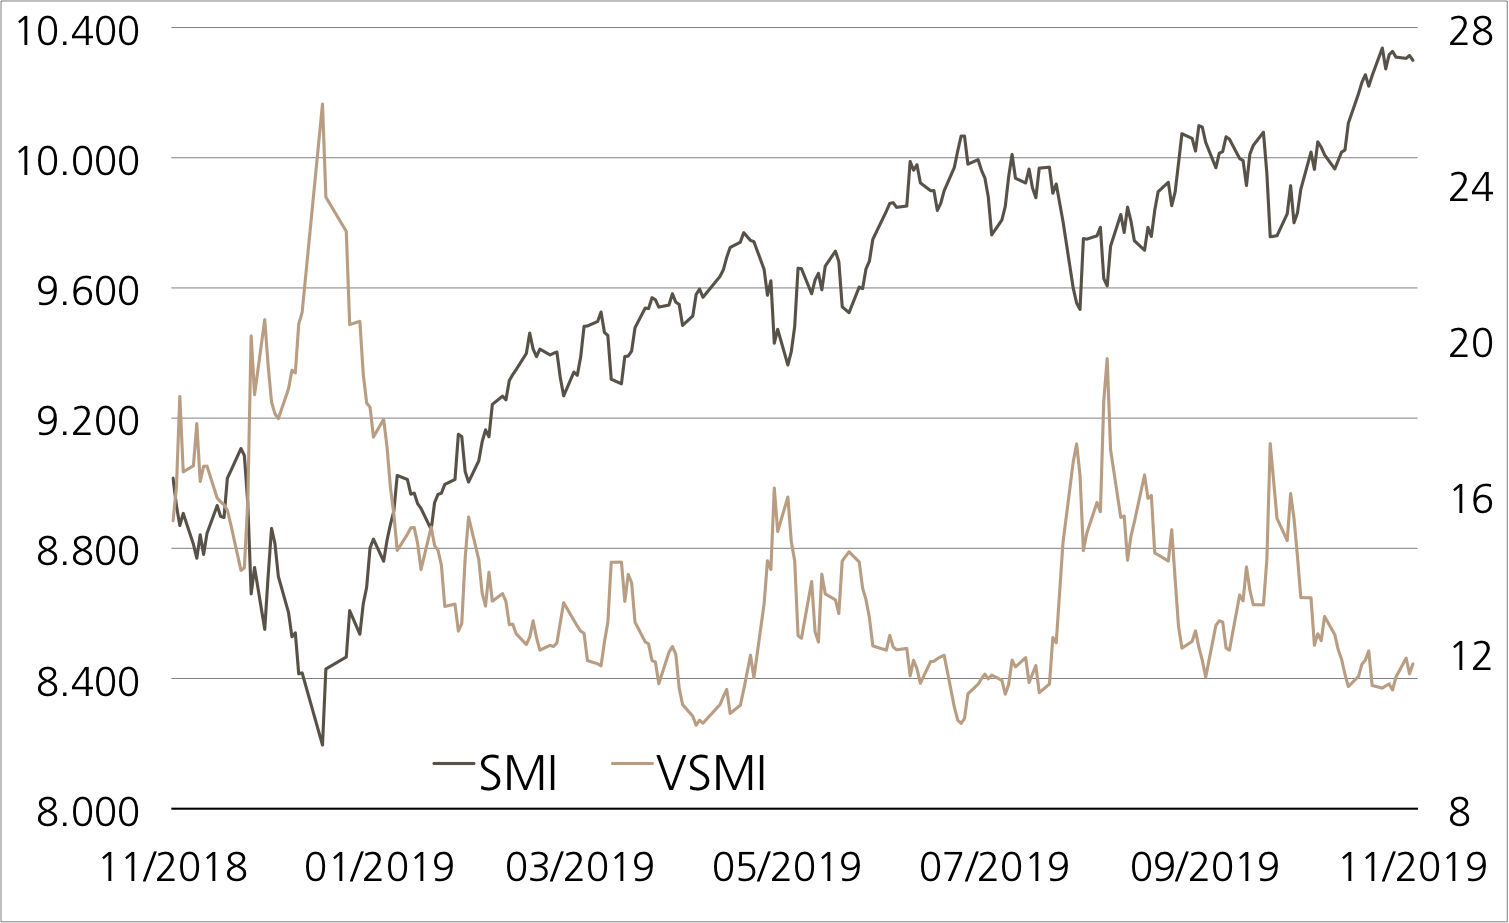
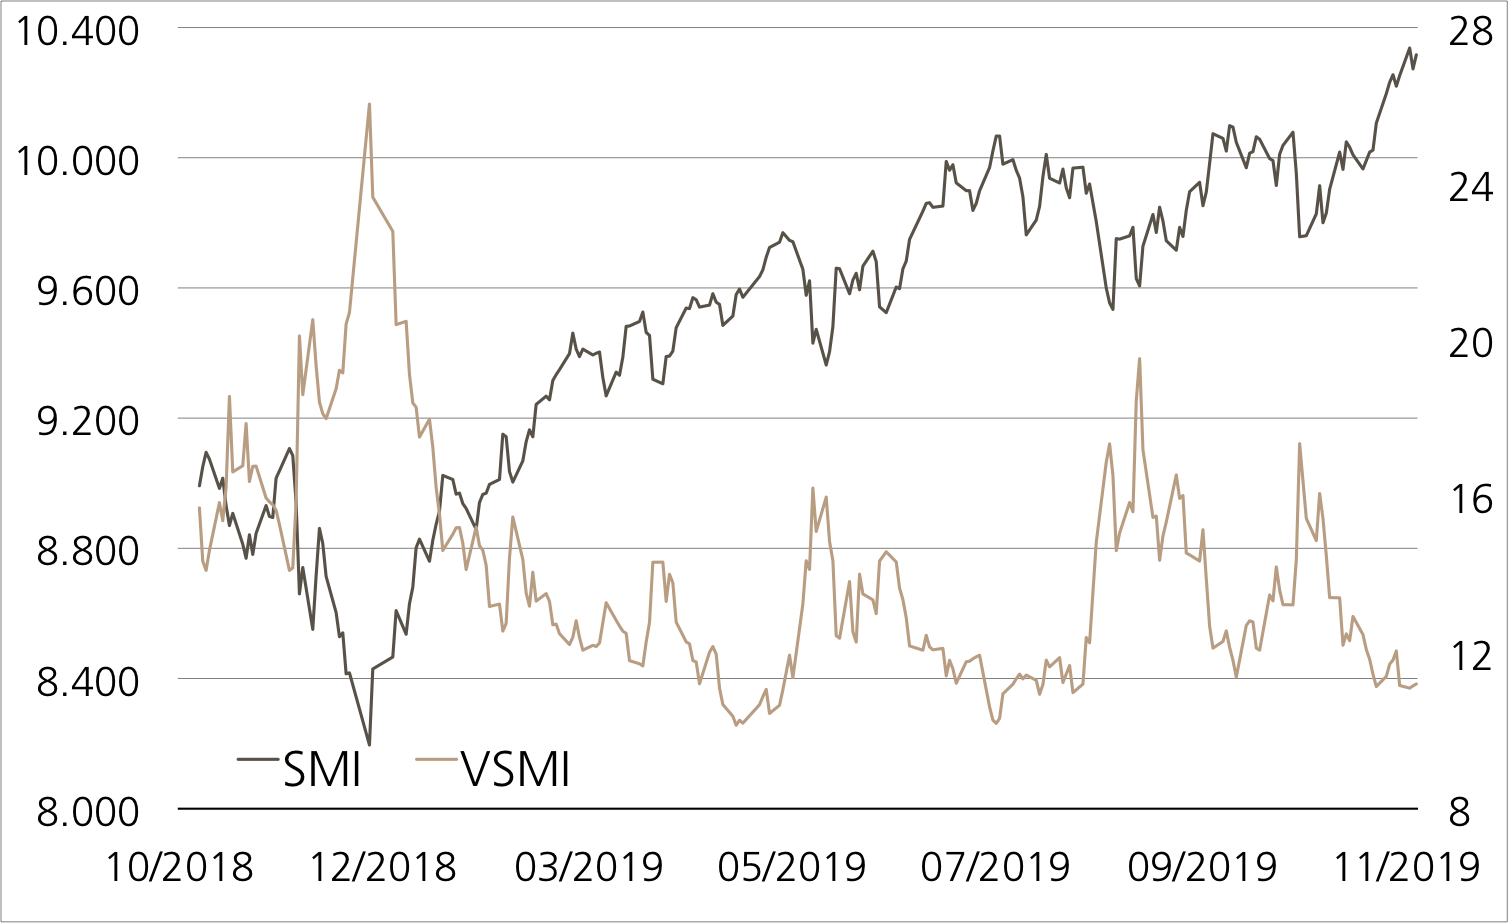
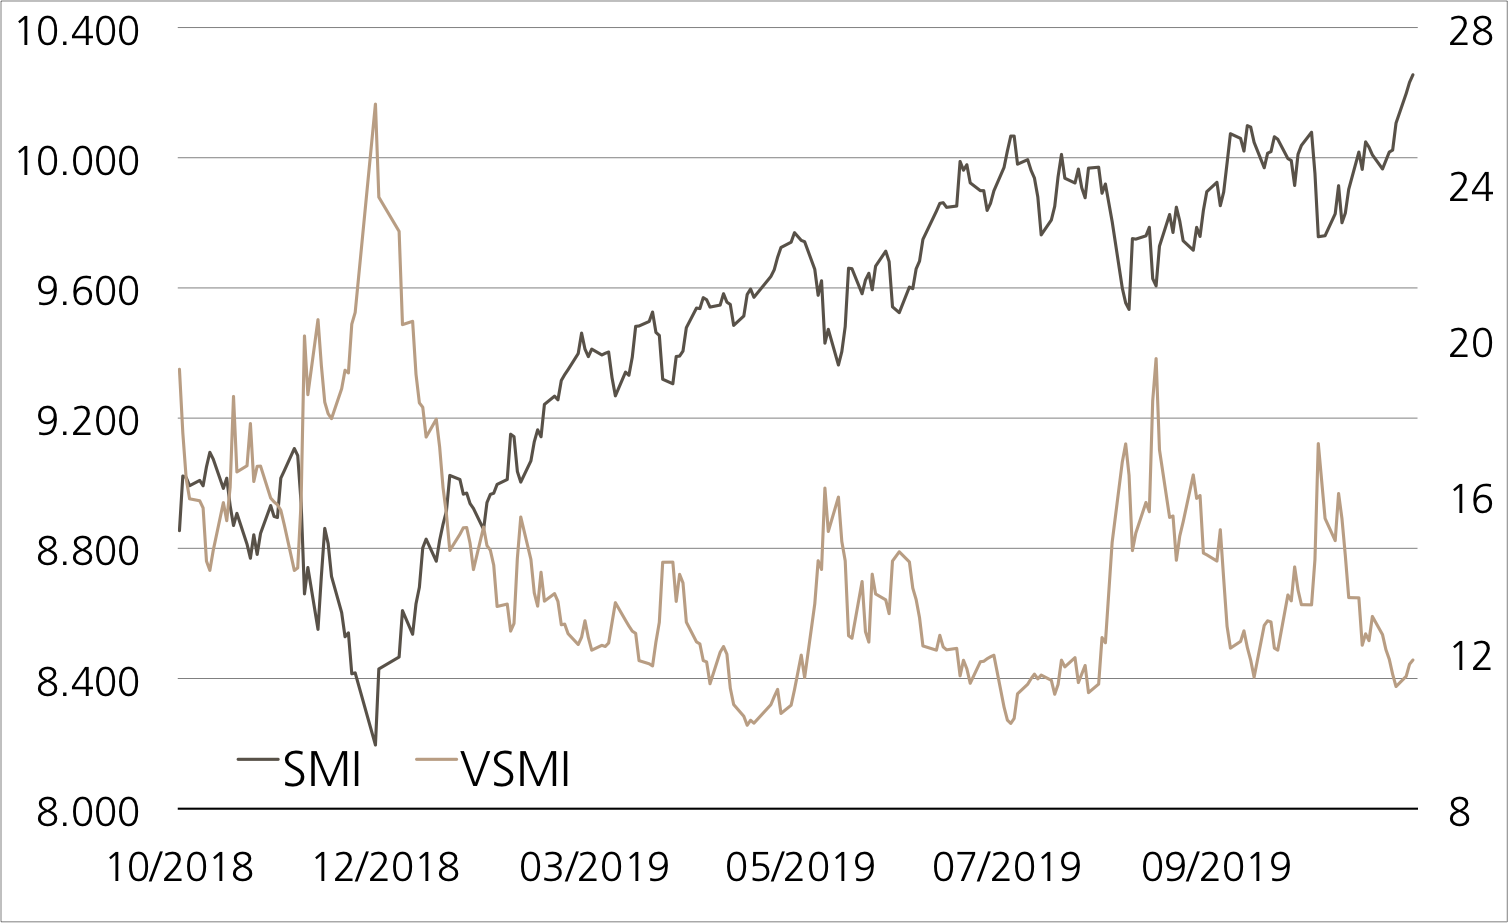
SMI™ vs. VSMI™ 1 Jahr

 
¹ Veränderung auf Basis des Schlusskurses des Vortages im Vergleich zum Schlusskurs vor einer Woche.
Der VSMI™ Index wird seit 2005 berechnet. Er zeigt die Volatilität der im SMI™ Index enthaltenen Aktien. Massgeblich für die Berechnung ist ein Portfolio, welches nicht auf Preisschwankungen, sondern ausschliesslich auf Veränderungen der Volatilität reagiert. Dabei greift die VSMI™ Methodik auf die quadrierten Volatilitäten, im Fachjargon „Varianzen“, der an der Eurex gehandelten SMI-Optionen mit einer konstanten Restlaufzeit von 30 Tagen zurück.


Luxussektor
Swatch im Rampenlicht

 
Heute findet die Bilanzmedienkonferenz von Swatch statt. Während das Unternehmen erste Kennzahlen für 2018 bereits publiziert hat, warten die Märkte gespannt auf den Ausblick des Managements. Ein positives Bild vom globalen Luxusmarkt haben zuletzt L’Oréal und LVMH gezeichnet. UBS bringt die beiden französischen Branchenvertreter und Swatch jetzt als Basiswerte für einen Callable worst of Kick-In GOAL (Symbol: KDGVDU) zusammen. Das Luxus-Trio macht einen Coupon in Höhe von 8.00 Prozent p.a. möglich. Zu dieser Renditechance gesellt sich ein Barriereabstand von anfänglich 40 Prozent für die drei Aktien.
 
2018 hat Swatch den Umsatz um 5.7 Prozent auf 8.5 Milliarden Schweizer Franken erhöht. Im ersten Semester hatte das Unternehmen noch ein zweistelliges Wachstum verbucht, ehe vor allem das Geschäft in Frankreich und Asien für Bremsspuren sorgte. Den Gewinn konnte der Uhrenkonzern um 14.8 Prozent auf 867 Millionen Franken verbessern. Gleichwohl verfehlte das Unternehmen die Analystenerwartungen. Mit dem Start in das neue Jahr zeigte sich das Management zufrieden und stellte für 2019 positives Wachstum in Aussicht. (Quelle: Thomson Reuters, Medienbericht, 31.01.2019) Bei der Medienkonferenz wird sich zeigen, ob CEO Nick Hayek den Ausblick bereits konkretisieren kann. Ebenfalls heute legt L’Oréal die Bilanz für 2018 vor. Laut vorläufigen Zahlen hat der Kosmetikartikelhersteller mit 7.1 Prozent des stärkste Umsatzwachstum seit zehn Jahren erzielt. Prozentual zweistellig dehnten sich die Erlöse im Luxussegment sowie in der kleineren Sparte «Active Cosmetics» aus. Eine neue Bestmarke erreichte der Konzern mit 18.3 Prozent bei der operativen Marge. (Quelle: L’Oréal, Medienmitteilung, 07.02.2019) Auch bei LVMH liefen die Geschäfte so gut wie nie zuvor. 2018 verbuchte das Unternehmen, zu dessen Portfolio unter anderem Handtaschen von Louis Vuitton, Hublot-Uhren oder Parfüm von Christian Dior zählen, ein organisches Umsatzwachstum von elf Prozent. Der operative Gewinn nahm um mehr als ein Fünftel zu. (Quelle: LVMH, Medienmitteilung, 29.01.2019)
 

Chancen:
Während die LVMH-Aktie nur noch knapp unter dem im vergangenen Jahr erreichten Allzeithoch handelt, hat L’Oréal gerade eine neue Bestmarke erreicht. Derweil trat Swatch zuletzt auf der Stelle.¹ Für den Callable worst of Kick-In GOAL (Symbol: KDGVDU) würde eine Seitwärtsbewegung bei allen drei Aktien reichen, um die Maximalrendite von 8.00 Prozent p.a. zu erzielen. Entscheidend ist, dass keine Aktie während der Laufzeit auf oder unter die Barriere fällt. Ungeachtet dessen verfügt die Emittentin über ein Kündigungsrecht – beginnend mit dem 20. März 2020 kann sie davon alle drei Monate Gebrauch machen.

Risiken:
Worst-of Kick-In GOALs sind nicht kapitalgeschützt. Notiert einer derBasiswerte während der Laufzeit einmal auf oder unter dem jeweiligen Kick-In Level (Barriere) und kommt zudem das Callable Feature nicht zum tragen, kann dieRückzahlung am Verfalltag durch Bartilgung entsprechend der (vom Strike aus)schwächsten Performance aus dem Trio erfolgen (höchstens jedoch zumNominalwert zuzüglich Coupon). In diesem Fall sind Verluste wahrscheinlich. Zudemträgt der Anleger bei den Strukturierten Produkten das Emittentenrisiko, so dass daseingesetzte Kapital – unabhängig von der Entwicklung der Basiswerte – im Falleeiner Insolvenz der UBS AG verloren gehen kann. 
Weitere UBS Produkte sowie Informationen zu Chancen und Risiken finden Sie unter ubs.com/keyinvest.
 
Swatch I vs. L’Oréal vs. LVMH (5 Jahre, nur zu illustrativen Zwecken, Angabe in %)¹
Quelle: UBS AGStand: 13.03.2019

 
8.00% p.a. Callable Kick-In GOAL auf Swatch I /  L’Oréal / LVMH
Remove
Symbol KDGVDU
SVSP Name Barrier Reverse Convertible
SVSP Code 1230, Callable
Basiswerte Swatch I /  L’Oréal / LVMH
Handelswährung CHF (Quanto)
Coupon 8.00% p.a.
Kick-In Level (Barriere) 60%
Verfall 22.03.2021
Emittentin UBS AG, London
Zeichnung bis 20.03.2019, 15:00 Uhr

Add
 

Termsheet Weitere Produkte sowie Informationen zu Chancen und Risiken finden Sie unter: ubs.com/keyinvest   Quelle: UBS AG Stand: 13.03.2019

 
¹) Bitte beachten Sie, dass vergangene Wertentwicklungen keine Indikationen für künftige Wertentwicklungen sind.


Die in diesem Dokument enthaltenen Informationen werden ausschliesslich zu Informations- und Werbezwecken zur Verfügung gestellt und stellen weder Empfehlungen noch Anlageberatung von UBS AG, einer ihrer Tochtergesellschaften oder verbundenen Unternehmen («UBS») dar. Dieses Dokument wird nicht von einer UBS Research Abteilung ausgegeben und ist deshalb nicht als unabhängige Anlageforschung zu erachten. Es stellt weder einen Verkaufsprospekt, noch ein Angebot oder eine Einladung zur Offertenstellung dar, irgendeine Art von Anlage zu tätigen. Beachten Sie bitte, dass die Anlagebeispiele die Ansichten von UBS Research möglicherweise nicht vollständig wiedergeben. Dieses Dokument und die darin beschriebenen Produkte und Dienstleistungen sind allgemeiner Natur und beziehen sich weder auf die persönlichen Anlageziele noch die finanzielle Situation oder besonderen Bedürfnisse eines spezifischen Empfängers. Anlageentscheide sollten stets im Portfoliokontext getroffen werden und Ihre persönliche Situation und Ihre entsprechende Risikobereitschaft und Risikofähigkeit berücksichtigen. Sie werden hiermit auf diese Risiken (die mitunter erheblich sein können) hingewiesen. Bevor Sie einen Anlageentscheid treffen, lesen Sie bitte die spezifischen Produkteinformationen und die Broschüre «Besondere Risiken im Effektenhandel». Bitte kontaktieren Sie Ihren Kundenberater, der Sie gerne bei Ihren Anlageideen unterstützt und Ihnen die spezifischen Produktinformationen zur Verfügung stellt. UBS übernimmt diesbezüglich keinerlei Haftung für das Verhalten von Dritten. Wir weisen Sie darauf hin, dass sich UBS das Recht vorbehält, Dienstleistungen, Produkte und Preise jederzeit ohne vorhergehende Ankündigung zu ändern, und dass sich die wiedergegebenen Informationen und Meinungen jederzeit ändern können. Es wird weder eine ausdrückliche noch stillschweigende Gewährleistung oder Garantie in Bezug auf die Richtigkeit, Vollständigkeit oder Verlässlichkeit der wiedergegebenen Informationen abgegeben, es sei denn, es handelt sich um Informationen, die sich auf die UBS AG beziehen. Zudem stellt dieses Dokument keine umfassende Beschreibung oder Zusammenfassung der genannten Märkte und Entwicklungen dar. Gewisse Zahlen beziehen sich auf vergangene Wertentwicklungen oder stellen simulierte Wertentwicklungen dar und sind somit keine zuverlässigen Indikatoren für künftige Ergebnisse. Bei einigen Zahlen handelt es sich möglicherweise lediglich um Prognosen, und Prognosen sind kein zuverlässiger Indikator für zukünftige Entwicklungen. Gewisse Diagramme und/oder Darstellungen von Wertentwicklungen basieren möglicherweise nicht auf 12-Monate-Perioden, was ihre Vergleichbarkeit und Aussagekraft reduziert. Wechselkurse können sich negativ auf den Wert, den Preis oder die Einnahmen von Produkten und Dienstleistungen auswirken, die in den Materialien genannt werden. Gebühren sind möglicherweise nicht enthalten und reduzieren die Wertentwicklung entsprechend. Die steuerliche Behandlung hängt von den individuellen Umständen jedes Kunden ab und kann sich in Zukunft ändern. UBS erbringt keine Rechts- oder Steuerberatungsdienste und gibt weder allgemeine noch auf die spezifischen Umstände und Bedürfnisse eines Kunden bezogene Erklärungen im Hinblick auf die steuerliche Behandlung von Anlagen oder der damit verbundenen Anlagerenditen ab. Die Empfänger sollten eine unabhängige rechtliche und steuerliche Beratung im Hinblick auf die Auswirkungen der Produkte/Dienstleistungen in der jeweiligen Rechtsordnung sowie die Eignung der Produkte und Dienstleistungen in Anspruch nehmen. UBS, ihre Verwaltungsräte, Geschäftsführer und Mitarbeiter oder Kunden halten oder hielten möglicherweise Anteile oder Hausse- und Baisse-Positionen («Longoder Short-Positionen») an den hierin genannten Wertpapieren oder sonstigen Finanzinstrumenten und können jederzeit als Auftraggeber oder Beauftrage Käufe und/oder Verkäufe tätigen. UBS fungiert oder fungierte möglicherweise als Marktmacher («Market-Maker») bei den Wertpapieren oder sonstigen Finanzinstrumenten. Des Weiteren unterhält oder unterhielt UBS möglicherweise eine Geschäftsbeziehung mit oder erbringt oder erbrachte Investmentbanking-, Kapitalmarktdienstleistungen und/oder sonstige Finanzdienstleistungen für die jeweiligen Unternehmen. Dieses Dokument und die darin enthaltenen Informationen sind ausschliesslich für Personen mit Domizil Schweiz gedacht. Sie dürfen unter keinen Umständen in Rechtsordnungen verbreitet werden, in denen eine solche Verbreitung gegen geltende Gesetze oder Regulierungen verstösst. Sie dürfen insbesondere nicht in den USA und/oder an USPersonen oder in Rechtsordnungen verteilt werden, in denen der Vertrieb durch uns eingeschränkt ist.Die im Dokument enthaltenen Informationen stammen, sofern nicht anders angegeben, von UBS. UBS übernimmt keine Gewährleistung (weder ausdrücklich noch stillschweigend) für Richtigkeit, Vollständigkeit und Aktualität der Informationen. Sie können jederzeit und ohne vorherige Ankündigung geändert werden. UBS ist nicht verpflichtet, die hierin enthaltenen Informationen zu aktualisieren oder auf dem neuesten Stand zu halten.Das vorliegende Material beinhaltet Daten, welche aus dem Backtesting von Daten resultieren, und wurde von UBS in gutem Glauben und unter Anwendung standardisierter Methoden erstellt. Diese Methoden basieren auf eigenen Modellen, empirischen Daten, Annahmen und anderen Informationen, die wir für korrekt und angemessen erachten. Gewisse Links führen zu Websites Dritter. Diese sind dem Einfluss der UBS vollständig entzogen, weshalb UBS für Richtigkeit, Vollständigkeit und Rechtmässigkeit des Inhalts solcher Websites sowie für darauf enthaltene Angebote und (Dienst-) Leistungen keinerlei Verantwortung übernimmt.Für gewisse Dienstleistungen und Produkte gelten gesetzliche Bestimmungen. Diese Dienstleistungen und Produkte können daher nicht weltweit uneingeschränkt angeboten werden.Hinweise zu den Grafiken: Nur für Illustrationszwecke. Vergangene Performance ist kein zuverlässiger Indikator für die künftige Performance. © UBS 2017. Das Schlüsselsymbol und UBS gehören zu den eingetragenen und nicht eingetragenen Markenzeichen von UBS. Alle Rechte bleiben vorbehalten.  Der SMI™ Index sowie entsprechende Marken und der SLI™ Index sowie entsprechende Marken und der der Swiss Performance Index™ Index (SPITM) sowie entsprechende Marken und der VSMI™ sowie entsprechende Marken sind Eigentum der SIX Swiss Exchange AG. Alle Rechte vorbehalten. Der S&P 500™ Index sowie entsprechende Marken und der S&P 500 Industrials Index™ sowie entsprechende Marken sind Eigentum der Standard & Poor›s Financial Services LLC. Alle Rechte vorbehalten. Der Euro STOXX 50™ Index sowie entsprechende Marken und der STOXX Europe 600 Banks Index sowie entsprechende Marken sind Eigentum der Stoxx AG. Alle Rechte vorbehalten. Der CMCI™ Composite Index sowie entsprechende Marken sind Eigentum der UBS AG. Alle Rechte vorbehalten. Der DAX™ Index sowie entsprechende Marken sind Eigentum der Deutsche Börse AG. Alle Rechte vorbehalten. Der JPM™ German Government Bond Index sowie entsprechende Marken sind Eigentum der JPM International Limited. Alle Rechte vorbehalten. Der NIKKEI 225™ Index sowie entsprechende Marken sind Eigentum der Nihon Keizai Shimbun Incorporation. Alle Rechte vorbehalten. Der EPRA Index™ sowie entsprechende Marken sind Eigentum der European Public Real Estate Association. Alle Rechte vorbehalten. Der FTSE™ Index sowie entsprechende Marken sind Eigentum der London Stock Exchange Group Holdings Limited. Alle Rechte vorbehalten. Der MSCI™ World Index sowie entsprechende Marken sind Eigentum der MSCI Incorporation. Alle Rechte vorbehalten. Der KOSPI™ Index sowie entsprechende Marken sind Eigentum der Korea Exchange Incorporation. Alle Rechte vorbehalten. Der HSCEI™ Index, der Hang Seng China EnterprisesTM Index sowie entsprechende Marken sind Eigentum der Hang Seng Data Services Limited. Alle Rechte vorbehalten.

Weekly Hits: Ölmarkt & Luxussektor2019-03-14T10:11:25+01:00

Weekly Hits: Électromobilité & Un trio de sportifs

KeyInvest Weekly Hits

Vendredi, 08.03.2019

  • Thème 1: Électromobilité - En direction de Genève chargé à bloc
  • Thème 2: Nike / adidas / Under Armour - Un trio de sportifs

Électromobilité
En direction de Genève chargé à bloc

Genève ouvre cette semaine les portes de la 89e édition de son Salon international de l’automobile. Pendant onze jours, la Suisse romande accueillera les professionnels de la branche venus présenter leurs derniers modèles et l’électromobilité sera sous le feu des projecteurs. UBS participe depuis peu à la mutation du secteur automobile avec le PERLES (symbole : ECARSU) sur l’« Electric Car Beneficiaries Basket ». Ce produit offre la possibilité de miser de manière diversifiée sur les bénéficiaires potentiels de l’engouement suscité par l’électromobilité. Tesla, le pionner de la voiture électrique, Toyota et Volkswagen constituent la base de l’Early Redemption (ER) Kick-In GOAL (symbole : KANGDU). Pour le Barrier Reverse Convertible qui arrive à échéance en novembre, l’opportunité de rendement s’élève à 27,4%. Ce potentiel de gain s’accompagne d’un écart de la barrière de 34,5% pour Tesla, le Worst Performer actuel.

Les représentants des médias ont été invités à venir au salon deux jours avant l’ouverture officielle pour découvrir plus de 100 premières européennes et mondiales dévoilées par les 70 exposants. S’ils ont pu voir de nombreux modèles classiques puissants à l’image du « Bentayga Speed » de Bentley Motors, un SUV de 635 chevaux capable d’accélérer de 0 à 100 km/heure en moins de quatre secondes et d’atteindre une vitesse de pointe de 306 km/h, ils ont également pu admirer bon nombre de nouveautés, notamment des véhicules dotés de types de motorisation innovants comme la pile à combustible, mais aussi des voitures électriques et hybrides. Seat, la filiale de Volkswagen, expose par exemple son premier véhicule électrique. Le constructeur Volkswagen, quant à lui, montre dans une étude une variante totalement électrique de la légendaire Coccinelle Dune. De son côté, Toyota arrive en Suisse avec deux nouveaux modèles hybrides. Si le groupe nippon a équipé la Prius d’un système de traction intégrale intelligent, il a favorisé le confort et le design pour son modèle Camry. (Source : Geneva International Motor Show, communiqué de presse, 20.02.2019)

En revanche, les 660 000 visiteurs attendus ne trouveront pas de stand Tesla au salon. Le constructeur américain de voitures électriques n’est toutefois pas en reste puisque son CIO, Elon Musk, a annoncé sur Twitter peu avant le salon que son SUV, le modèle Y, serait présenté le 14 mars à Los Angeles. De part et d’autre de l’Atlantique, l’électromobilité progresse à grands pas avec les nouveautés à venir. L’industrie automobile allemande, pour ne citer qu’elle, compte investir plus de 40 milliards d’euros dans ce domaine au cours des trois prochaines années. Les constructeurs allemands souhaitent en même temps tripler leur offre de véhicules électriques qui compte à ce jour une centaines de modèles. (Source : Verband der Automobilindustrie VDA, communiqué de presse, 02.03.2019)

Opportunités: UBS Evidence Lab a ciblé ses recherches sur les bénéficiaires des tendances mondiales misant sur l’électromobilité. À l’issue de cette analyse, une commission spécialisée a identifié huit entreprises prometteuses dans le secteur de la sous-traitance. Ces entreprises composent l’« Electric Car Beneficiaries Basket ». La liste comprend des sous-traitants tels que Aptiv, Continental et Valeo ou encore des fabricants de semi-conducteurs comme Infineon et Intel. Le PERLES (symbole : ECARSU) reproduit fidèlement le panier d’actions. Une évolution stable des cours de Tesla, Toyota et Volkswagen suffit pour dégager un rendement de 27,4% avec l’ER Kick-In GOAL (symbole : KANGDU), à condition qu’aucun des titres ne tombe au niveau ou en dessous de sa barrière. Étant donné que le trio de constructeurs automobiles s’est replié depuis l’émission du produit, le Kick-In GOAL cote nettement en dessous du pair. Si les trois sous-jacents venaient à remonter et atteindre ou dépasser le niveau du Strike lors d’un jour d’observation, la fonction Early Redemption deviendrait exigible. Dans ce cas-là, les investisseurs se verraient rembourser le nominal et le pro rata du coupon par anticipation.

Risques: les produits présentés n’offrent pas de protection du capital. Une évolution négative de l’actif sous-jacent entraîne des pertes correspondantes pour le PERLES. Si, pendant la durée de l’investissement, un des sous-jacents du Worst of Kick-In GOAL atteint une seule fois le niveau de sa barrière («Kick-In Level») ou descend en dessous, et que la fonction de remboursement anticipé ne s’applique pas, le montant remboursé en espèces à maturité par amortissement est basé sur la performance la plus faible (base Strike) du trio (au maximum toutefois à la valeur nominale majorée du coupon). Dans un tel cas, des pertes sont probables. Par ailleurs, avec les produits structurés, l’investisseur supporte le risque d’émetteur. Cela signifie qu’en cas d’insolvabilité d’UBS SA, le capital investi peut être perdu, indépendamment de l’évolution du sous-jacent.

Vous trouverez davantage de produits UBS et des informations sur les opportunités et les risques à l’adresse ubs.com/keyinvest.

Aptiv vs. Continental vs. Valeo
(5 ans, aux fins d’illustration uniquement, données en %)¹

Les équipementiers automobiles Aptiv, Continental et Valeo sont impliqués dans le développement de l’électromobilité et font par conséquent partie des titres qui composent l’« Electric Car Beneficiaries Basket ». Le trio a finalement grimpé en bourse.

Source: UBS AG, Bloomberg

Valeurs du: 06.03.2019

Tesla vs. Toyota vs. Volkswagen VZ
(5 ans, aux fins d’illustration uniquement, données en %)¹

Sur cinq ans, le constructeur de voitures électriques Tesla s’est démarqué des constructeurs de masse Toyota et Volkswagen. Malmené par le scandale du diesel, Volkswagen est le seul titre du trio à avoir perdu des plumes.

Source: UBS AG, Bloomberg

Valeurs du: 06.03.2019

¹) La performance passée n’indique pas les résultats futures.
²) Les condition des ETTs sont vérifiés annuellement et peuvent être ajustées avec un délai de 13 mois après la publication.

PERLES sur Electric Car Beneficiaries Basket

Symbol ECARSU
SVSP Name Tracker Certifikat
SVSP Code 1300
Sous-jacent Electric Car Beneficiaries Basket
Devise CHF
Rapport de souscription 1:1
Frais de gestion 0.50% p.a.
Participation 100%
Echéance 26.09.2025
Émetteur UBS AG, London
Bid/Ask CHF 94.69 / 95.65
 

12.50% p.a. Early Redemption Kick-In GOAL sur Tesla / Toyota Motor / Volkswagen VZ

Symbol KANGDU
SVSP Name Barrier Reverse Convertible
SPVSP Code 1230 (Auto-Callable)
Sous-jacent Tesla / Toyota Motor / Volkswagen VZ
Devise CHF (Quanto)
Coupon 12.50% p.a.
Rendement latéraux 25.97% (37.11% p.a.)
Kick-In Level (Distance) Tesla: USD 184.434 (33.23%)
Toyota: JPY 4’176.61 (36.66%)
Volkswagen VZ: EUR 98.648 (35.18%)
Echéance 22.11.2019
Émetteur UBS AG, London
Bid/Ask 85.55% / 86.55%
 

Vous trouverez davantage de produits UBS et des informations sur les opportunités et les risques à l’adresse ubs.com/keyinvest.

Source: UBS AG, Bloomberg

Valeurs du: 06.03.2019

Apérçu du marché

Index Citation Semaine¹
SMI™ 9’403.16 Pt. -0.1%
SLI™ 1’452.24 Pt. 0.1%
S&P 500™ 2’771.45 Pt. -0.7%
Euro STOXX 50™ 3’324.67 Pt. 1.3%
S&P™ BRIC 40 4’282.27 Pt. 0.9%
CMCI™ Compos. 920.95 Pt. -1.0%
Gold (troy ounce) 1’287.60 USD -2.5%

¹ Changement basé sur le cours de clôture du jour précédent par rapport au cours de clôture de la semaine dernière.

SMI™ vs. VSMI™ 1 année

L’index VSMI™ est calculé depuis 2005. Il affiche la volatilité des actions inclus dans le SMI™ index. Pour la calculation, un portefeuille est utilisé qui ne réagit qu’au variations de la volatilité au lieu des variations des prix. En le faisant, la méthodologie du VSMI™ utilise la volatilité carré, connu sous le terme variance, des options sur le SMI avec 30 jours jusqu’à l’échéance négociées à la Bourse Eurex.

Source: UBS AG, Bloomberg

Valeurs du: 06.03.2019

Nike / adidas / Under Armour
Un trio de sportifs

Grâce à leurs solides résultats, les fabricants d’articles de sport américains Nike et Under Armour ont enfin pu marquer des points auprès des investisseurs. Les résultats d’adidas, en revanche, n’ont pas encore été communiqués. Le numéro 2 mondial présentera son bilan 2018 le 13 mars. C’est également à cette date que s’achèvera la période de souscription pour un Worst of Kick-In GOAL sur Nike, adidas et Under Armour. Ce produit libellé en dollar américain est doté d’un coupon de 11,00% p.a. Pendant la période de 12 mois, les sous-jacents disposent d’une marge de sécurité de 45%.

Nike, premier groupe mondial d’articles de sport, publie ses bilans en décalé et a donc déjà révélé ses résultats pour le deuxième trimestre de l’exercice fiscal 2019. Dans les trois mois qui ont précédé le 30 novembre 2018, le géant de la branche a signé des résultats supérieurs aux prévisions moyennes des analystes. La stratégie consistant à lancer plus rapidement de nouveaux produits tout en accélérant la collaboration avec des commerçants en ligne porte donc ses fruits. Aux États-Unis, Nike a augmenté son chiffre d’affaires en ligne de 41% pendant le trimestre. En Chine, le groupe a enregistré une croissance de 26,4% malgré le conflit commercial. (Source : Thomson Reuters, article de presse, 20.12.2018) Après la publication du rapport intermédiaire, l’action Nike a rapidement grimpé et la grande capitalisation a récemment atteint un pic historique.¹

Bien qu’Under Armour cote encore largement en dessous des records historiques, ce représentant de la branche américaine a finalement aussi connu une forte accélération.¹ Au quatrième trimestre 2018, l’entreprise a amélioré sa marge brute de 160 points de base et elle s’élève désormais à 45,1%. Si l’on fait abstraction des effets exceptionnels, Under Armour a gagné 0,09 dollar américain par action. En moyenne, les analystes tablaient sur une marge inférieure à 45% et sur un excédent de seulement 0,04 dollar américain par action. (Source : Thomson Reuters, article de presse, 12.02.2019) Les observateurs de la branche attendent maintenant avec impatience le bilan d’adidas. Le groupe bavarois historique présentera ses résultats le 13 mars, soit seulement huit jours avant que l’entreprise au célèbre logo « Swoosh », Nike, ne présente son bilan du trimestre suivant.

Opportunités: Le Worst of Kick-In GOAL (symbole : KDFTDU) arrive donc sur le marché à une période riche en évènements pour le secteur. Toutefois, les actions de Nike, adidas et Under Armour ne doivent pas nécessairement se donner à fond pour que le produit rapporte un rendement maximal de 11,00% p.a. à la date du rachat. Ce qui compte, c’est qu’aucun des trois sous-jacents n’atteigne ou ne descende en dessous de la barrière fixée à 55% du cours initial pendant la période des 12 mois.

Risques: les Kick-In GOALs ne bénéficient d’aucune protection du capital. Si, pendant la durée de l’investissement, l’un des sous-jacents atteint une seule fois la barrière respective (« Kick-In Level ») ou est inférieur à celle-ci, le remboursement par amortissement en espèces à l’échéance est basé sur la performance la plus faible (base Strike) du trio (au maximum toutefois à la valeur nominale majorée du coupon). Dans un tel cas, des pertes sont probables. Par ailleurs, avec les produits structurés, l’investisseur supporte le risque d’émetteur. Cela signifie qu’en cas d’insolvabilité d’UBS SA, le capital investi peut être perdu, indépendamment de l’évolution du sous-jacent.

Vous trouverez davantage de produits UBS et des informations sur les opportunités et les risques à l’adresse ubs.com/keyinvest.

Nike vs. adidas vs. Under Armour
(5 ans, aux fins d’illustration uniquement, données en %)¹

Source: UBS AG, Bloomberg

Valeurs du: 06.03.2019

11.00% p.a. Worst of Kick-In GOAL sur Nike / adidas / Under Armour

Symbol KDFTDU
SVSP Name Barrier Reverse Convertible
SPVSP Code 1230
Sous-jacent Nike / adidas / Under Armour
Devise USD (Quanto)
Coupon 11.00% p.a.
Strike Level 100%
Kick-In Level (Barrière)
55%
Echéance 13.03.2020
Émetteur UBS AG, London
Date de fixation du prix 13.03.2019, 15:00 h
 

Vous trouverez davantage de produits UBS et des informations sur les opportunités et les risques à l’adresse ubs.com/keyinvest.

Source: UBS AG, Bloomberg

Valeurs du: 06.03.2019

¹) La performance passée n’indique pas les résultats futures.
²) Les condition des ETTs sont vérifiés annuellement et peuvent être ajustées avec un délai de 13 mois après la publication.

This material has been prepared by UBS AG or one of its affiliates («UBS»). This material is for distribution only as permitted by law. It is not prepared for the needs of any specific recipient. It is published solely for information and is not a solicitation or offer to buy or sell any securities or related financial instruments (“Instruments”). UBS makes no representation or warranty, either express or implied, on the completeness or reliability of the information contained in this document (“Information”) except that concerning UBS AG and its affiliates. The Information should not be regarded by recipients as a substitute for using their own judgment. Any opinions expressed in this material may change without notice and may be contrary to opinions expressed by other business areas of UBS as a result of using different assumptions or criteria. UBS is under no obligation to update the Information. UBS, its officers, employees or clients may have or have had an interest in the Instruments and may at any time transact in them. UBS may have or have had a relationship with entities referred to in the Information. Neither UBS nor any of its affiliates, or their officers or employees, accepts any liability for any loss arising from use of the Information. This presentation is not a basis for entering into a transaction. Any transaction between you and UBS will be subject to the detailed provisions of the term sheet, confirmation or electronic matching systems relating to that transaction. Clients wishing to effect transactions should contact their local sales representative.
This information is communicated by UBS AG and/or its affiliates («UBS»). * (see below) UBS may from time to time, as principal or agent, have positions in, or may buy or sell, or make a market in any securities, currencies, financial instruments or other assets underlying the product to which this website relates (the «Structured Product»). UBS may provide investment banking and other services to and/or have officers who serve as directors of the companies referred to in this website. UBS’s trading and/or hedging activities related to the Structured Product may have an impact on the price of the underlying asset and may affect the likelihood that any relevant barrier or relevant trigger event is crossed or triggered. UBS has policies and procedures designed to minimise the risk that officers and employees are influenced by any conflicting interest or duty and that confidential information is improperly disclosed or made available. UBS may pay or receive brokerage or retrocession fees in connection with the Structured Product described herein. In respect of any Structured Product that is a security, UBS may, in certain circumstances, sell the Structured Product to dealers and other financial institutions at a discount to the issue price or rebate to them for their own account some proportion of the issue price. Further information is available on request. Structured Products are complex and may involve a high risk of loss. Prior to purchasing the Structured Product you should consult with your own legal, regulatory, tax, financial and accounting advisors to the extent you consider it necessary, and make your own investment, hedging and trading decisions (including decisions regarding the suitability of the Structured Product) based upon your own judgement and advice from those advisers you consider necessary. Save as otherwise expressly agreed in writing, UBS is not acting as your financial adviser or fiduciary in relation to the Product. UBS generally hedges its exposure to Structured Products, although it may elect not to hedge or to partially hedge any Structured Product. UBS’s hedging activity may be conducted through transactions in the underlying asset, index or instrument or in options, futures or other derivatives related to the underlying asset, index or instrument on publicly traded markets or otherwise, and may have an impact on the price of the under-lying asset. If a transaction is cash settled, UBS will generally unwind or offset any hedge it has for such Structured Product in close proximity to the relevant valuation time or period. In some cases, this activity may affect the value of the Structured Product. Unless stated otherwise in this document, (i) this document is for information purposes only and should not be construed as an offer, personal recommendation or solicitation to purchase the Structured Product and should not be treated as giving investment advice, and (ii) the terms of any investment in the Structured Product will be exclusively subject to the detailed provisions, including risk considerations, contained in the more detailed legal documentation that relates to the Structured Product (being the confirmation, information memorandum, prospectus or other issuer documentation as relevant). UBS makes no representation or warranty relating to any information herein which is derived from independent sources. This document shall not be copied or reproduced without UBS’s prior written permission. In respect of any Structured Product that is a security, no action has been or will be taken in any jurisdiction that would permit a public offering of the Product, save where explicitly stated in the issuer documentation. The Structured Product must be sold in accordance with all applicable selling restrictions in the jurisdictions in which it is sold.
© UBS 2018. All rights reserved. UBS prohibits the forwarding of this information without the approval of UBS.
Weekly Hits: Électromobilité & Un trio de sportifs2019-03-08T10:23:30+01:00

Weekly Hits: Elektromobilität & Ein sportliches Trio


KeyInvest Weekly Hits
Donnerstag, 07.03.2019
  • Thema 1: Elektromobilität – Vollgeladen nach Genf
  • Thema 2: Nike / adidas / Under Armour – Ein sportliches Trio
  • Thema 3: Rohstoffmonitor – Februar 2019

Elektromobilität
Vollgeladen nach Genf

Heute öffnet der 89. Genfer-Autosalon seine Tore. Elf Tage lang präsentiert der Sektor in der Westschweiz die neuesten Modelle. Ein Schwerpunkt liegt auf der Elektromobilität. UBS hat den Umbruch im Automobilsektor unlängst mit PERLES (Symbol: ECARSU) auf den «Electric Car Beneficiaries Basket» aufgegriffen. Das Produkt bietet die Möglichkeit, diversifiziert auf potenzielle Profiteure des E-Trends zu setzen. Der Elektroautopionier Tesla bildet zusammen mit Toyota und Volkswagen die Basis für den Early Redemption (ER) Kick-In GOAL (Symbol: KANGDU). Bei dem im November fälligen Barrier Reverse Convertible beläuft sich die Renditechance auf 26.0 Prozent. Diesem Gewinnpotenzial steht beim aktuellen Worst-Performer Tesla ein Barriereabstand von 33.2 Prozent gegenüber.

Bereits zwei Tage vor der offiziellen Eröffnung waren die Medienvertreter auf das Messegelände eingeladen. Sie konnten dabei sein, wie 70 Aussteller mehr als 100 Welt- und Europa-Premieren vorstellten. Zu sehen gab es auf der einen Seite zahlreiche Klassiker. Beispielsweise reiste Bentley Motors mit dem «Bentayga Speed» an. Dabei handelt es sich um einen 635 PS starken SUV der in weniger als vier Sekunden von 0 auf 100 km/h beschleunigt und eine Spitzengeschwindigkeit von 306 km/h erreicht. Neben hochmotorisierten Autos säumen viele Fahrzeuge mit innovativen Antriebsarten wie Brennstoffzellen, Elektro oder Hybrid die Liste der Neuheiten. Beispielsweise stellt die Volkswagen-Tochter Seat ihr erstes Elektrofahrzeug vor. VW selbst zeigt in einer Studie eine vollelektrische Abwandlung des legendären Dune-Buggys. Mit zwei neuen Hybridmodellen kommt Toyota in die Schweiz. Während die Japaner den Prius mit einem intelligenten Allradsystem ausgestattet haben, stehen beim Camry Komfort und Design im Fokus. (Quelle: Geneva International Motor Show, Medienmitteilung, 20.02.2019)  Tesla werden die erwarteten rund 660’000 Besucher nicht als Aussteller antreffen. Allerdings liess der CEO des US-Elektroautobauers kurz vor dem Autosalon mit einer Neuheit aufhorchen. Per Twitter kündigte Elon Musk die Vorstellung des Model Y an. Der SUV soll am 14. März in Los Angeles präsentiert werden. Die diesseits wie jenseits des Atlantiks anstehenden Neuheiten machen den Vormarsch der Elektromobilität einmal mehr deutlich. Allein die deutsche Automobilindustrie möchte in den kommenden drei Jahren in diesem Bereich mehr als 40 Milliarden Euro investieren. Gleichzeitig soll sich das Modellangebot der deutschen Hersteller bis dahin auf rund 100 E-Modelle verdreifachen. (Quelle: Verband der Automobilindustrie VDA, Medienmitteilung, 02.03.2019)


Chancen:
UBS Evidence Lab hat sich gezielt auf die Suche nach Gewinnern des globalen E-Trends gemacht. Am Ende dieser Analyse legte ein Fachausschuss acht aussichtsreiche Zulieferunternehmen fest. Sie bilden den «Electric Car Beneficiaries Basket». Die Liste reicht von Zulieferern wie Aptiv, Continental oder Valeo bis zu den Halbleiterherstellern Infineon und Intel. PERLES (Symbol: ECARSU) bilden den Aktienkorb im Bezugsverhältnis 1:1 ab. Ein stabiler Kursverlauf von Tesla, Toyota und Volkswagen reicht, um mit dem ER Kick-In GOAL (Symbol: KANGDU) eine Rendite von 26.0 Prozent einzufahren. Entscheidend hierfür ist, dass keine Aktie auf oder unter die jeweilige Barriere fällt. Da das Auto-Trio seit der Produktemission nachgeben hat, notiert der Kick-In GOAL deutlich unter pari. Sollten die drei Basiswerte nach oben drehen und an einem Beobachtungstag geschlossen auf oder über dem Strike zu finden sein, würde die Early Redemption Funktion greifen. Neben dem Nominal erhalten Anleger in diesem Szenario den anteiligen Coupon vorab zurückbezahlt.

Risiken:
Die vorgestellten Produkte sind nicht kapitalgeschützt. Eine negativeEntwicklung des Basiswerts führt beim PERLES zu entsprechenden Verlusten. Notiert einer der Basiswerte beim Worst of Kick-In GOAL während der Laufzeit einmal auf oder unter dem jeweiligen Kick-In Level (Barriere) und kommt zudem das Early Redemption Feature nicht zum Tragen, kann die Rückzahlung am Verfalltag durch Bartilgung entsprechend der (vom Strike aus) schwächsten Performance aus dem Trio erfolgen (höchstens jedoch zum Nominalwert zuzüglich Coupon). In diesem Fall sind Verluste wahrscheinlich. Zudem trägt der Anleger bei Strukturierten Produkten das Emittentenrisiko, so dass das eingesetzte Kapital – unabhängig von der Entwicklung des Basiswertes – im Falle einer Insolvenz der UBS AG verloren gehen kann. 
Weitere UBS Produkte sowie Informationen zu Chancen und Risiken finden Sie unter ubs.com/keyinvest.
 
 
Aptiv vs. Continental vs. Valéo (5 Jahre, nur zu illustrativen Zwecken, Angaben in %)¹
Die Autozulieferer Aptiv, Continental und Valéo sind in die Entwicklung der E-Mobilität involviert und zählen daher zu den Bestandteilen des «Electric Car Beneficiaries Basket» – an der Börse beschleunigte das Trio zuletzt.
 
Quelle: UBS AG, Bloomberg
Stand: 06.03.2019

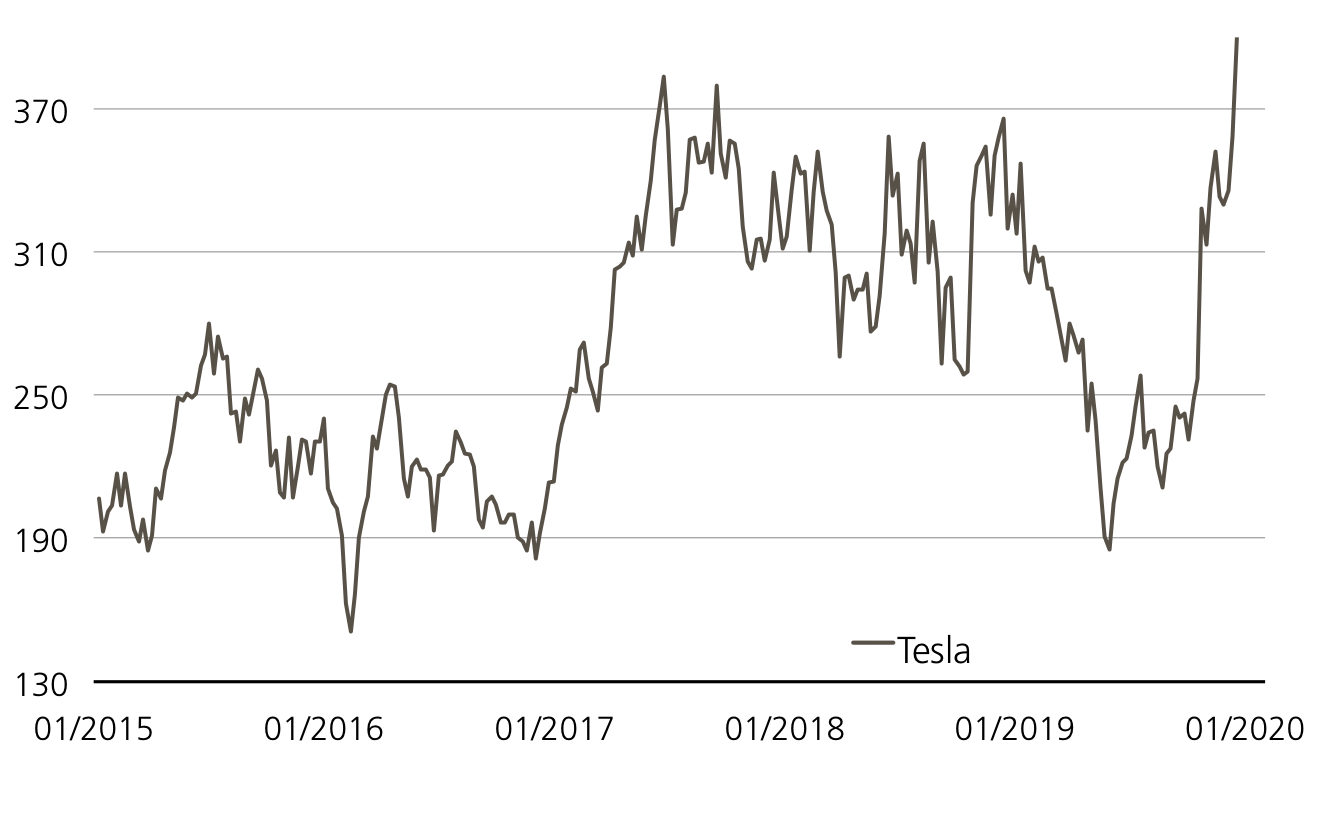
Tesla vs. Toyota vs. Volkswagen VZ (5 Jahre, nur zu illustrativen Zwecken, Angaben in %)¹
Auf Sicht von fünf Jahren fuhr der Elektroautobauer Tesla den Massenherstellern Toyota und Volkswagen davon. Als einziges Papier aus dem Trio musste die vom Dieselskandal gebeutelte VW-Aktie Federn lassen.
 
Quelle: UBS AG, Bloomberg
Stand: 06.03.2019

 
¹) Bitte beachten Sie, dass vergangene Wertentwicklungen keine Indikationen für künftige Wertentwicklungen sind.
 
PERLES auf den Electric Car Beneficiaries Basket

Remove
Symbol ECARSU
SVSP Name Tracker-Zertifikat
SVSP Code 1300
Basiswert Electric Car Beneficiaries Basket
Bezugsverhältnis 1:1
Handelswährung CHF
Verwaltungsgebühr 0.50% p.a.
Partizipation 100%
Verfall 26.09.2025
Emittentin UBS AG, London
Geld-/Briefkurs CHF 94.69 / 95.65

Add
 

12.50% p.a. Early Redemption Kick-In GOAL auf Tesla / Toyota Motor / Volkswagen VZ

Remove
Symbol KANGDU
SVSP Name Barrier Reverse Convertible
SVSP Code 1230 (Auto-Callable)
Basiswerte Tesla / Toyota Motor / Volkswagen VZ
Handelswährung CHF (Quanto)
Coupon 12.50% p.a.
Seitwärtsrendite
25.97% (37.11% p.a.)
Kick-In Level
(Abstand)
Tesla: USD 184.434
(33.23%)
Toyota: JPY 4’176.61
(36.66%)
Volkswagen VZ: EUR 98.648
(35.18%)
Verfall 22.11.2019
Emittentin UBS AG, London
Geld-/Briefkurs 85.55% / 86.55%

Add
 

Weitere Produkte sowie Informationen zu Chancen und Risiken finden Sie unter: ubs.com/keyinvest Quelle: UBS AG, Bloomberg Stand: 06.03.2019
 
Marktübersicht
Index Stand Woche¹
SMI™ 9’403.16 Pkt. -0.1%
SLI™ 1’452.24 Pkt. 0.1%
S&P 500™ 2’771.45 Pkt. -0.7%
EURO STOXX 50™ 3’324.67 Pkt. 1.3%
S&P™ BRIC 40 4’282.27 Pkt. 0.9%
CMCI™ Compos. 920.95 Pkt. -1.0%
Gold (Feinunze) 1’287.60 USD -2.5%
Add

SMI™ vs. VSMI™ 1 Jahr

 
¹ Veränderung auf Basis des Schlusskurses des Vortages im Vergleich zum Schlusskurs vor einer Woche.
Der VSMI™ Index wird seit 2005 berechnet. Er zeigt die Volatilität der im SMI™ Index enthaltenen Aktien. Massgeblich für die Berechnung ist ein Portfolio, welches nicht auf Preisschwankungen, sondern ausschliesslich auf Veränderungen der Volatilität reagiert. Dabei greift die VSMI™ Methodik auf die quadrierten Volatilitäten, im Fachjargon „Varianzen“, der an der Eurex gehandelten SMI-Optionen mit einer konstanten Restlaufzeit von 30 Tagen zurück.


Nike / adidas / Under Armour
Ein sportliches Trio

 
Mit starken Resultaten konnten die US-Sportartikelhersteller Nike und Under Armour zuletzt bei den Investoren punkten. Dagegen stehen die Zahlen von adidas noch aus. Die globale Nummer 2 stellt die Bilanz für 2018 am 13. März vor. Am selben Tag endet die Zeichnungsfrist für einen Worst of Kick-In GOAL auf Nike, adidas und Under Armour. Das in US-Dollar denominierte Produkt bringt einen Coupon in Höhe von 11.00 Prozent p.a. mit. Während der zwölfmonatigen Laufzeit verfügen die Basiswerte über ein Sicherheitspolster von 45 Prozent.


Der weltgrösste Sportartikelkonzern bilanziert in einem gebrochenen Geschäftsjahr. Daher hat Nike bereits am 20. Dezember die Resultate für das zweite Quartal der Fiskalperiode 2019 vorgelegt. In den drei Monaten bis zum 30. November 2018 schnitt der Branchenkrösus besser ab, als von Analysten im Schnitt erwartet. Damit macht sich die Strategie, neue Produkte schneller zu lancieren und gleichzeitig die Zusammenarbeit mit Internethändlern zu forcieren, bezahlt. In den USA steigerte Nike die Online-Umsätze im Quartal um 41 Prozent. Trotz Handelsstreit verbuchte der Konzern in China ein Wachstum von 26.4 Prozent. (Quelle: Thomson Reuters, Medienbericht, 20.12.2018) Nach dem Zwischenbericht drehte die Nike-Aktie dynamisch nach oben – kürzlich markierte der Large Cap ein Allzeithoch.¹

Wenngleich Under Armour noch deutlich unter der historischen Bestmarke notiert, zeigte sich auch dieser US-Branchenvertreter zuletzt sprintstark.¹  Im vierten Quartal 2018 hat das Unternehmen die Bruttomarge um 160 Basispunkte auf 45.1 Prozent verbessert. Unter Ausklammerung von Einmaleffekten verdiente Under Armour neun US-Cent je Aktie. Analysten hatten im Schnitt mit einer Marge von weniger als 45 Prozent sowie einen Überschuss von lediglich vier Cent je Anteilsschein gerechnet. (Quelle: Thomson Reuters, Medienbericht, 12.02.2019) Gespannt warten Branchenbeobachter nun auf die Bilanz von adidas. Am 13. März wird der bayrische Traditionskonzern sein Zahlenwerk präsentieren. Übrigens: Nur acht Tage später meldet sich bereits wieder Nike zu Wort. Dann legt das Unternehmen mit dem bekannten «Swoosh»-Logo die nächste Quartalsbilanz vor.
 

Chancen:
Der Worst of Kick-In GOAL (Symbol: KDFTDU) kommt also während einer für den Sektor ereignisreichen Zeit an den Markt. Allerdings müssen sich die Aktien von Nike, adidas und Under Armour nicht besonders sportlich entwickeln, damit das Produkt zum Rückzahlungstermin die Maximalrendite von 11.00% p.a. abwirft. Entscheidend ist, dass keiner der drei Basiswerte während der zwölfmonatigen Laufzeit auf oder unter die Barriere bei 55 Prozent der Anfangsnotierung fällt.

Risiken:
Kick-In GOALs sind nicht kapitalgeschützt. Notiert einer der Basiswertewährend der Laufzeit einmal auf oder unter dem jeweiligen Kick-In Level (Barriere),kann die Rückzahlung am Verfalltag durch Bartilgung entsprechend der (vom Strike aus) schwächsten Performance aus dem Trio erfolgen (höchstens jedoch zumNominalwert zuzüglich Coupon). In diesem Fall sind Verluste wahrscheinlich. Zudemträgt der Anleger bei Strukturierten Produkten das Emittentenrisiko, so dass daseingesetzte Kapital – unabhängig von der Entwicklung des Basiswertes – im Falleeiner Insolvenz der UBS AG verloren gehen kann.
Weitere UBS Produkte sowie Informationen zu Chancen und Risiken finden Sie unter ubs.com/keyinvest.
 
Nike vs. adidas vs. Under Armour (5 Jahre, nur zu illustrativen Zwecken, Angabe in %)¹
Quelle: UBS AGStand: 06.03.2019

 
11.00% p.a. Worst of Kick-In GOAL auf Nike / adidas / Under Armour
Remove
Symbol KDFTDU
SVSP Name Barrier Reverse Convertible
SVSP Code 1230
Basiswerte Nike / adidas / Under Armour
Handelswährung USD (Quanto)
Coupon 11.00% p.a.
Strike Level 100%
Kick-In Level (Barriere) 55%
Verfall 13.03.2020
Emittentin UBS AG, London
Zeichnung bis 13.03.2019, 15:00 Uhr

Add
 

Termsheet Weitere Produkte sowie Informationen zu Chancen und Risiken finden Sie unter: ubs.com/keyinvest   Quelle: UBS AG Stand: 06.03.2019

 
¹) Bitte beachten Sie, dass vergangene Wertentwicklungen keine Indikationen für künftige Wertentwicklungen sind.


Rohstoffmonitor
Februar 2019

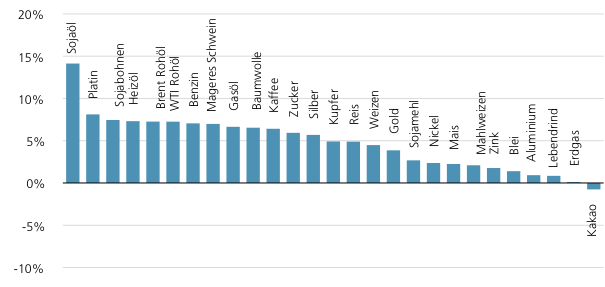
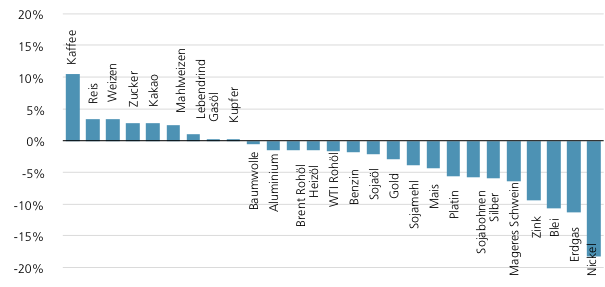
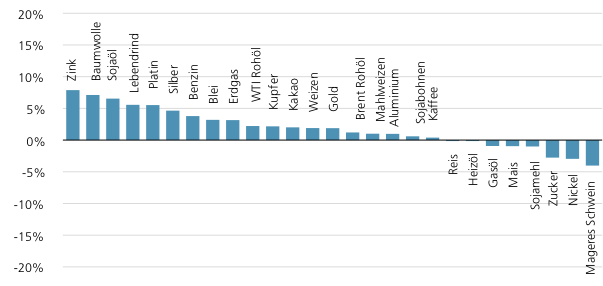
Performance Einzelrohstoffe:Mehr als die Hälfte der im CMCI-Universum enthaltenen Einzelwaren verzeichnete im Februar Zugewinne. Mit Nickel ist der Januar-Sieger erneut auf der Gewinnerseite zu finden. Damit setzte sich die auf die Korrektur im zweiten Semester 2018 folgende Erholung fort. Nach den ersten beiden Monaten des neuen Jahres steht für das Legierungsmetall ein Plus von mehr als einem Fünftel zu Buche. Zu dieser Rallye passen aktuelle Zahlen der International Nickel Study Group (INSG): Demnach hat sich das Angebotsdefizit im globale Nickelmarkt 2018 gegenüber dem Vorjahr ausgeweitet. 

Monatsperformance Einzelrohstoffe im Februar 2019¹

Total-Return-Performance der UBS Bloomberg CMCI Einzelrohstoff-Indizes im Februar 2019 in US-Dollar.


Stand: 28.02.2019Quelle: UBS AG

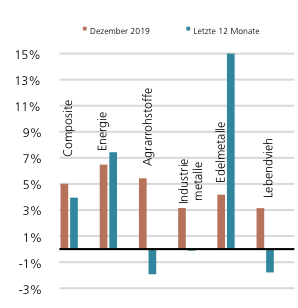
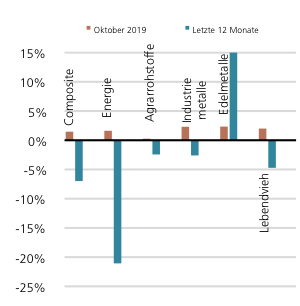
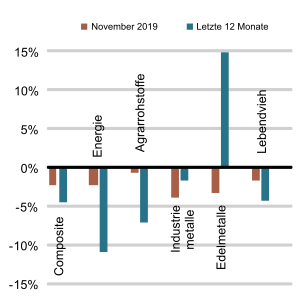
CMCI™ Sektor-Indizes:Das Verhältnis aus Produktion und Nachfrage ist auch für die Energiepreise von zentraler Bedeutung. Im vergangenen Herbst hatte die Sorge vor einem Überangebot für einen regelrechten Absturz beim Ölpreis gesorgt. Die OPEC steuerte gemeinsam mit weiteren Förderländern gegen und drosselte die Produktion. Offenbar geht das Kalkül der «OPEC+»-Allianz auf. Im Februar schnitten die Energieträger mit einem Plus von fünf Prozent noch besser ab als das Segment der Industriemetalle (+3.5%). Dagegen bildeten Agrarrohstoffe mit einem Minus von 2.6 Prozent das Schlusslicht. Unter Druck standen zudem die Edelmetalle – die deutlich aufgehellte Kapitalmarktstimmung bremste Gold und Silber aus.
 
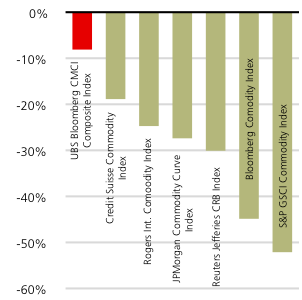
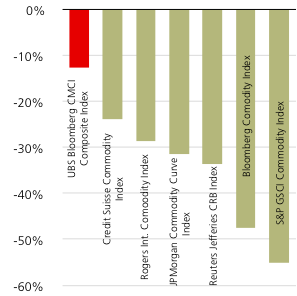
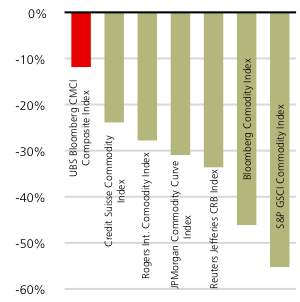
Rohstoff-Index-Vergleich seit CMCI™-Lancierung im Januar 2007¹
Performance ausgesuchter Rohstoff-Indizes imVergleich zum UBS Bloomberg CMCI™Composite Index seit dessen Lancierung imJanuar 2007. 
Quelle: UBS AG
Stand: 28.02.2019

Performance UBS Bloomberg CMCI™ Sektor-Indizes¹
Total-Return-Performance der einzelnen UBS Bloomberg CMCI™ Sektor-Indizes im Februar 2019.
Quelle: UBS AG
Stand: 28.02.2019

 
Meistgehandelte UBS ETCs auf CMCI™:Das wiedererstarkte Industriemetall Nickel ist auch unter den meistgehandelten UBS ETCs des vergangenen Monats zu finden. Den grössten Anteil am Gesamtvolumen hatte im Februar jedoch ein auf der Ölgattung Brent basierendes Partizipationsprodukt.
 
Meistgehandelte UBS ETCs auf UBS Bloomberg CMCI™ Indizes im Februar 2019
Produkt Symbol Währung Monatsperformance¹ Anteil am Gesamtvolumen
UBS ETC on CMCI Brent Crude Oil TCOCI USD 6.9% 40.0%
UBS ETC on CMCI WTI Crude Oil ECLCI EUR 5.0% 9.0%
UBS ETC on CMCI WTI Crude Oil TCLCI USD 5.0% 7.4%
UBS ETC on CMCI Coffee Arabica EKCCIU EUR -8.8% 6.8%
UBS ETC on CMCI WTI Crude Oil TCLCIU USD 5.4% 6.4%
UBS ETC on CMCI Composite TCMCI USD 2.3% 4.7%
UBS ETC on CMCI Agriculture TAGCI USD -2.9% 3.3%
UBS ETC on CMCI Coffee TKCCIU USD -7.7% 2.1%
UBS ETC on CMCI Nickel TLNCI USD 4.6% 2.0%
Add
Prozentual meistgehandelte UBS ETCs im Vergleich zum Gesamtlvolumen aller UBS ETCs auf CMCI Indizes an der SIX Structured Products Exchange.
Quelle: UBS AG
Stand: 28.02.2019
 

Die in diesem Dokument enthaltenen Informationen werden ausschliesslich zu Informations- und Werbezwecken zur Verfügung gestellt und stellen weder Empfehlungen noch Anlageberatung von UBS AG, einer ihrer Tochtergesellschaften oder verbundenen Unternehmen («UBS») dar. Dieses Dokument wird nicht von einer UBS Research Abteilung ausgegeben und ist deshalb nicht als unabhängige Anlageforschung zu erachten. Es stellt weder einen Verkaufsprospekt, noch ein Angebot oder eine Einladung zur Offertenstellung dar, irgendeine Art von Anlage zu tätigen. Beachten Sie bitte, dass die Anlagebeispiele die Ansichten von UBS Research möglicherweise nicht vollständig wiedergeben. Dieses Dokument und die darin beschriebenen Produkte und Dienstleistungen sind allgemeiner Natur und beziehen sich weder auf die persönlichen Anlageziele noch die finanzielle Situation oder besonderen Bedürfnisse eines spezifischen Empfängers. Anlageentscheide sollten stets im Portfoliokontext getroffen werden und Ihre persönliche Situation und Ihre entsprechende Risikobereitschaft und Risikofähigkeit berücksichtigen. Sie werden hiermit auf diese Risiken (die mitunter erheblich sein können) hingewiesen. Bevor Sie einen Anlageentscheid treffen, lesen Sie bitte die spezifischen Produkteinformationen und die Broschüre «Besondere Risiken im Effektenhandel». Bitte kontaktieren Sie Ihren Kundenberater, der Sie gerne bei Ihren Anlageideen unterstützt und Ihnen die spezifischen Produktinformationen zur Verfügung stellt. UBS übernimmt diesbezüglich keinerlei Haftung für das Verhalten von Dritten. Wir weisen Sie darauf hin, dass sich UBS das Recht vorbehält, Dienstleistungen, Produkte und Preise jederzeit ohne vorhergehende Ankündigung zu ändern, und dass sich die wiedergegebenen Informationen und Meinungen jederzeit ändern können. Es wird weder eine ausdrückliche noch stillschweigende Gewährleistung oder Garantie in Bezug auf die Richtigkeit, Vollständigkeit oder Verlässlichkeit der wiedergegebenen Informationen abgegeben, es sei denn, es handelt sich um Informationen, die sich auf die UBS AG beziehen. Zudem stellt dieses Dokument keine umfassende Beschreibung oder Zusammenfassung der genannten Märkte und Entwicklungen dar. Gewisse Zahlen beziehen sich auf vergangene Wertentwicklungen oder stellen simulierte Wertentwicklungen dar und sind somit keine zuverlässigen Indikatoren für künftige Ergebnisse. Bei einigen Zahlen handelt es sich möglicherweise lediglich um Prognosen, und Prognosen sind kein zuverlässiger Indikator für zukünftige Entwicklungen. Gewisse Diagramme und/oder Darstellungen von Wertentwicklungen basieren möglicherweise nicht auf 12-Monate-Perioden, was ihre Vergleichbarkeit und Aussagekraft reduziert. Wechselkurse können sich negativ auf den Wert, den Preis oder die Einnahmen von Produkten und Dienstleistungen auswirken, die in den Materialien genannt werden. Gebühren sind möglicherweise nicht enthalten und reduzieren die Wertentwicklung entsprechend. Die steuerliche Behandlung hängt von den individuellen Umständen jedes Kunden ab und kann sich in Zukunft ändern. UBS erbringt keine Rechts- oder Steuerberatungsdienste und gibt weder allgemeine noch auf die spezifischen Umstände und Bedürfnisse eines Kunden bezogene Erklärungen im Hinblick auf die steuerliche Behandlung von Anlagen oder der damit verbundenen Anlagerenditen ab. Die Empfänger sollten eine unabhängige rechtliche und steuerliche Beratung im Hinblick auf die Auswirkungen der Produkte/Dienstleistungen in der jeweiligen Rechtsordnung sowie die Eignung der Produkte und Dienstleistungen in Anspruch nehmen. UBS, ihre Verwaltungsräte, Geschäftsführer und Mitarbeiter oder Kunden halten oder hielten möglicherweise Anteile oder Hausse- und Baisse-Positionen («Longoder Short-Positionen») an den hierin genannten Wertpapieren oder sonstigen Finanzinstrumenten und können jederzeit als Auftraggeber oder Beauftrage Käufe und/oder Verkäufe tätigen. UBS fungiert oder fungierte möglicherweise als Marktmacher («Market-Maker») bei den Wertpapieren oder sonstigen Finanzinstrumenten. Des Weiteren unterhält oder unterhielt UBS möglicherweise eine Geschäftsbeziehung mit oder erbringt oder erbrachte Investmentbanking-, Kapitalmarktdienstleistungen und/oder sonstige Finanzdienstleistungen für die jeweiligen Unternehmen. Dieses Dokument und die darin enthaltenen Informationen sind ausschliesslich für Personen mit Domizil Schweiz gedacht. Sie dürfen unter keinen Umständen in Rechtsordnungen verbreitet werden, in denen eine solche Verbreitung gegen geltende Gesetze oder Regulierungen verstösst. Sie dürfen insbesondere nicht in den USA und/oder an USPersonen oder in Rechtsordnungen verteilt werden, in denen der Vertrieb durch uns eingeschränkt ist.Die im Dokument enthaltenen Informationen stammen, sofern nicht anders angegeben, von UBS. UBS übernimmt keine Gewährleistung (weder ausdrücklich noch stillschweigend) für Richtigkeit, Vollständigkeit und Aktualität der Informationen. Sie können jederzeit und ohne vorherige Ankündigung geändert werden. UBS ist nicht verpflichtet, die hierin enthaltenen Informationen zu aktualisieren oder auf dem neuesten Stand zu halten.Das vorliegende Material beinhaltet Daten, welche aus dem Backtesting von Daten resultieren, und wurde von UBS in gutem Glauben und unter Anwendung standardisierter Methoden erstellt. Diese Methoden basieren auf eigenen Modellen, empirischen Daten, Annahmen und anderen Informationen, die wir für korrekt und angemessen erachten. Gewisse Links führen zu Websites Dritter. Diese sind dem Einfluss der UBS vollständig entzogen, weshalb UBS für Richtigkeit, Vollständigkeit und Rechtmässigkeit des Inhalts solcher Websites sowie für darauf enthaltene Angebote und (Dienst-) Leistungen keinerlei Verantwortung übernimmt.Für gewisse Dienstleistungen und Produkte gelten gesetzliche Bestimmungen. Diese Dienstleistungen und Produkte können daher nicht weltweit uneingeschränkt angeboten werden.Hinweise zu den Grafiken: Nur für Illustrationszwecke. Vergangene Performance ist kein zuverlässiger Indikator für die künftige Performance. © UBS 2017. Das Schlüsselsymbol und UBS gehören zu den eingetragenen und nicht eingetragenen Markenzeichen von UBS. Alle Rechte bleiben vorbehalten.  Der SMI™ Index sowie entsprechende Marken und der SLI™ Index sowie entsprechende Marken und der der Swiss Performance Index™ Index (SPITM) sowie entsprechende Marken und der VSMI™ sowie entsprechende Marken sind Eigentum der SIX Swiss Exchange AG. Alle Rechte vorbehalten. Der S&P 500™ Index sowie entsprechende Marken und der S&P 500 Industrials Index™ sowie entsprechende Marken sind Eigentum der Standard & Poor›s Financial Services LLC. Alle Rechte vorbehalten. Der Euro STOXX 50™ Index sowie entsprechende Marken und der STOXX Europe 600 Banks Index sowie entsprechende Marken sind Eigentum der Stoxx AG. Alle Rechte vorbehalten. Der CMCI™ Composite Index sowie entsprechende Marken sind Eigentum der UBS AG. Alle Rechte vorbehalten. Der DAX™ Index sowie entsprechende Marken sind Eigentum der Deutsche Börse AG. Alle Rechte vorbehalten. Der JPM™ German Government Bond Index sowie entsprechende Marken sind Eigentum der JPM International Limited. Alle Rechte vorbehalten. Der NIKKEI 225™ Index sowie entsprechende Marken sind Eigentum der Nihon Keizai Shimbun Incorporation. Alle Rechte vorbehalten. Der EPRA Index™ sowie entsprechende Marken sind Eigentum der European Public Real Estate Association. Alle Rechte vorbehalten. Der FTSE™ Index sowie entsprechende Marken sind Eigentum der London Stock Exchange Group Holdings Limited. Alle Rechte vorbehalten. Der MSCI™ World Index sowie entsprechende Marken sind Eigentum der MSCI Incorporation. Alle Rechte vorbehalten. Der KOSPI™ Index sowie entsprechende Marken sind Eigentum der Korea Exchange Incorporation. Alle Rechte vorbehalten. Der HSCEI™ Index, der Hang Seng China EnterprisesTM Index sowie entsprechende Marken sind Eigentum der Hang Seng Data Services Limited. Alle Rechte vorbehalten.
Weekly Hits: Elektromobilität & Ein sportliches Trio2019-03-13T11:16:56+01:00

Weekly Hits:Marchés actions suisse & Secteur des télécommunications

KeyInvest Weekly Hits

Vendredi, 01.03.2019

  • Thème 1: Marchés actions suisse - Jamais aussi prêt du sommet
  • Thème 2: Secteur des télécommunications - Entrée dans l’ère de la 5G

Marchés actions suisse
Jamais aussi prêt du sommet

Cette année, l’indice directeur suisse devance ses homologues européens. Depuis le début de l’année, le baromètre a gagné 11,5%, en avance de près de deux points de pourcentage par rapport à l’Euro STOXX 50™ et au DAX™. Dans ce contexte de trajectoire haussière dynamique, il ne manque que 150 points, soit 1,6% au SMI™ pour atteindre le niveau record. Les blue chips suisses y ont contribué en janvier 2018 à hauteur de 9616 points¹. La variante Total Return de l’indice – soit celle qui intègre les dividendes dans le calcul de la performance, a déjà atteint un nouveau niveau record. Avec ETT (symbole: ETSMI) sur le SMI™ Total Return Index, les investisseurs ont la possibilité de prendre part pleinement à cette escalade². Le nouveau Worst of Kick-In GOAL (symbole: KDESDU) sur Nestlé, Novartis et Roche se débrouillera en revanche sans hausse des cours pour générer un rendement maximal de 5,00% sur un an..

Chiffres, chiffres, chiffres: Partout dans le monde, les sociétés sont actuellement en pleine fièvre des rapports annuels. Alors que la saison tire déjà à sa fin aux Etats-Unis, il reste encore beaucoup à faire en Suisse. Par exemple, au 28 février (à l’issue de la rédaction du présent article), ABB et Adecco n’avaient toujours pas clôturé leurs comptes. Ce même jour, Novartis tenait son assemblée générale. Un évènement important, à l’occasion duquel les actionnaires doivent se prononcer sur la scission programmée de la division soins ophtalmiques Alcon. Le groupe envisage de pouvoir clôturer la transaction au deuxième trimestre 2019.

Le patron de Novartis, Vas Narasimhan, a surpris le marché avec ses résultats annuels. Aux rênes de la société depuis seulement un an, il est parvenu à dégager une croissance du chiffre d’affaires net de 6% par rapport à l’année précédente à 51,9 milliards d’USD. L’objectif de taux de croissance pour 2018 a par conséquent été atteint. En particulier, le secteur «Innovative Medicines» a affiché une progression de 8%. La société pharmaceutique table en 2019 sur une croissance du chiffre d’affaires d’un pourcentage moyen à un chiffre. (Source : Novartis, communiqué de presse du 30.01.2019). Nestlé a également tenu ses promesses. En 2018, ce géant du secteur alimentaire a affiché une croissance organique de 3%, alors que sa marge opérationnelle sur une base ajustée gagnait 50 points de base à 17%. Pour 2019, le CEO, Mark Schneider, table sur une progression additionnelle de la croissance organique. Par ailleurs, d’après les objectifs établis pour 2020, le résultat opérationnel ajusté devrait progresser (de 17,5% à 18,5%). (Source: Nestlé, communiqué de presse du 14.02.2019)
D’un autre côté, d’autres sociétés du SMI™ n’ont pas aussi bien tiré leur épingle du jeu. Par exemple, Swatch et Julius Bär ont déçu les attentes du marché. Cependant, d’autres sociétés ont affiché de bons résultats dans les secteurs du luxe et de la finance. Ainsi, Richemont n’a pas déçu ses prévisions, tandis que Credit Suisse et Zurich Assurance ont dépassé les attentes. Il en va de même pour Roche. La société pharmaceutique a surpris avec une croissance de son chiffre d’affaires de 7% et une progression de son résultat opérationnel core de 8%. Par ailleurs, Roche a revu à la hausse son dividende pour 2018 à 8,70 francs par part, soit la 32e augmentation consécutive.

Opportunités: Pour les investisseurs axés sur les dividendes et les potentiels de hausse des cours des blue chips suisses, l’ETT émis par UBS (symbole: ETSMI) sur le SMI™ Total Return Index peut s’avérer intéressant. Ce produit contribue largement – déduction faite d’une commission de gestion de 0,25% par an – à l’évolution du cours du sous-jacent². Les âmes plus conservatrices pourront également investir dans le marché actions suisse à des fins de protection partielle. Le Worst of Kick-In GOAL en souscription (symbole : KDESDU) sur Nestlé, Novartis et Roche dispose d’une marge de sécurité de 25%. Si ce trio du SMI fortement pondéré parvient à se maintenir au-dessus de la barrière sur une durée d’un an, le produit dégagera un rendement maximal de 5%.

Risques: les produits présentés n’offrent pas de protection du capital. Avec un ETT, dès que l’indice sous-jacent tombe en-dessous du prix d’entrée, des pertes se produisent. Si, pendant la durée de l’investissement, l’un des sous-jacents du Worst of Kick-In GOAL atteint une seule fois le «Kick-In Level» correspondant ou est inférieur à celui-ci, le remboursement par amortissement en espèces à l’échéance est basé sur la performance la plus faible (base Strike) du trio (au maximum toutefois à la valeur nominale majorée du coupon). Dans un tel cas, des pertes sont probables. Par ailleurs, avec les produits structurés, l’investisseur supporte le risque d’émetteur. Cela signifie qu’en cas d’insolvabilité d’UBS SA, le capital investi peut être perdu, indépendamment de l’évolution du sous-jacent.

Vous trouverez davantage de produits UBS et des informations sur les opportunités et les risques à l’adresse ubs.com/keyinvest.

SMI™ Total Return-Index¹

La variante de rendement total du SMI™ a récemment bondi, atteignant un nouveau plafond absolu en février 2019. Le nouveau record a été atteint le 26 février, à 19 399 points.

Source: UBS AG, Bloomberg

Valeurs du: 27.02.2019

Nestlé vs. Novartis vs. Roche
(5 ans, aux fins d’illustration uniquement, données en %)¹

On observe des trajectoires différentes pour les actions de Nestlé, Novartis et Roche sur cinq ans. Si les deux premières fortes pondérations du SMI ont fortement augmenté, Roche ne dégage qu’une modeste progression.

Source: UBS AG, Bloomberg

Valeurs du: 27.02.2019

¹) La performance passée n’indique pas les résultats futures.
²) Les condition des ETTs sont vérifiés annuellement et peuvent être ajustées avec un délai de 13 mois après la publication.

ETT sur SMI™ TR Index

Symbol ETSMI
SVSP Name Tracker Certifikat
SVSP Code 1300
Sous-jacent SMI™ TR Index
Devise CHF
Rapport de souscription 100:1
Frais de gestion 0.25%
Participation 100%
Echéance Open End
Émetteur UBS AG, London
Bid/Ask CHF 190.10 / 191.10
 

5.00% p.a. Worst of Kick-In GOAL sur Nestlé, Novartis, Roche

Symbol KDESDU
SVSP Name Barrier Reverse Convertible
SPVSP Code 1230
Sous-jacent Nestlé, Novartis, Roche
Devise CHF
Coupon 5.00% p.a.
Kick-In Level 75%
Echéance 06.03.2020
Émetteur UBS AG, London
Date de fixation du prix 06.03.2019
 

Vous trouverez davantage de produits UBS et des informations sur les opportunités et les risques à l’adresse ubs.com/keyinvest.

Source: UBS AG, Bloomberg

Valeurs du: 27.02.2019

Apérçu du marché

Index Citation Semaine¹
SMI™ 9’412.19 1.0%
SLI™ 1’451.49 1.2%
S&P 500™ 2’792.38 0.3%
Euro STOXX 50™ 3’282.77 0.7%
S&P™ BRIC 40 4’245.58 1.6%
CMCI™ Compos. 930.61 0.2%
Gold (troy ounce) 1’321.20 USD -2.0%

¹ Changement basé sur le cours de clôture du jour précédent par rapport au cours de clôture de la semaine dernière.

SMI™ vs. VSMI™ 1 année

L’index VSMI™ est calculé depuis 2005. Il affiche la volatilité des actions inclus dans le SMI™ index. Pour la calculation, un portefeuille est utilisé qui ne réagit qu’au variations de la volatilité au lieu des variations des prix. En le faisant, la méthodologie du VSMI™ utilise la volatilité carré, connu sous le terme variance, des options sur le SMI avec 30 jours jusqu’à l’échéance négociées à la Bourse Eurex.

Source: UBS AG, Bloomberg

Valeurs du: 27.02.2019

Secteur des télécommunications
Entrée dans l’ère de la 5G

Pour le secteur des télécommunications, 2019 va être placé sous le signe de l’introduction de la 5G, le prochain standard de radiotélécommunication. Si dans certains pays les licences ont déjà été accordées, dans d’autres le processus d’octroi est encore en cours. Sur leurs marchés respectifs, Deutsche Telekom, Swisscom et AT&T souhaitent jouer un rôle actif sur cette technologie d’avenir. En conséquence, UBS a réuni ce trio comme sous-jacent pour un Worst of Kick-In GOAL (symbole: KDEUDU). Avec ce produit en souscription, les investisseurs peuvent prévoir un versement ferme de coupon d’un montant de 7,00% p.a. L’opportunité de rendement est couplée à une marge de sécurité de 35%.

Qu’il s’agisse de conduite mobile, d’Internet des choses ou de e-santé, la 5G formera une clé de voute technologique pour un large éventail de futures tendances. Cette norme de radiocommunication ultra-rapide et surtout sans interruption va permettre le déploiement d’un large éventail d’applications. En Suisse, Swisscom prévoit d’implanter la 5G dans un premier temps dans 60 villes et communes. La société a récemment acheté les licences requises pour ce faire pour un montant de 196 millions de francs. La direction considère ce montant d’enchères comme extraordinaire – elle ne l’inscrit donc pas dans les investissements prévus pour l’année en cours. Pour le reste, les objectifs établis sont inchangés, dont notamment un dividende stable à 22 francs par action. (Source: Swisscom, communiqué de presse, 08/02/2019)

En Allemagne, le processus d’adjudication des licences doit débuter le 19 mars. Deutsche Telekom compte parmi les quatre sociétés ayant été autorisées soumettre des offres. Par ailleurs, le groupe a publié de solides résultats pour l’exercice 2018. La société a enregistré un résultat d’exploitation ajusté à taux de change constants en hausse de 7,2%, soit un niveau record de 23,8 milliards d’euros. Les actionnaires devraient profiter d’une quatrième hausse successive de leurs dividendes. (Source: Thomson Reuters, article de presse, 21 février 2019) A l’avant-garde de la mise en place de la 5G on compte les Etats-Unis. En tant que premier fournisseur, AT&T a procédé à un déploiement partiel avant Noël 2018, dans une douzaine de villes. Au cours du semestre, d’autres villes vont être couvertes, parmi lesquelles Los Angeles et San Francisco. (Source: AT&T, communiqué de presse, 18/12/2018)

Opportunités: Sur les marchés boursiers, le passage à l’ère de la 5G ne suscite pas encore l’euphorie. Les trois titres du secteur des télécoms mentionnés s’inscrivent chacun dans une évolution latérale de long terme. Un maintien de ces conditions devrait s’avérer suffisant pour dégager avec le Worst of Kick-In GOAL (symbole: KDEUDU) sur Deutsche Telekom, Swisscom et AT&T le rendement maximal de 7.00%. Il est déterminant qu’au cours de la période aucun sous-jacent ne tombe au niveau de la barrière (basse) de 65% du cours initial ou ne passe en-dessous.

Risques: les Kick-In GOALS ne bénéficient d’aucune protection du capital. Si, pendant la durée de l’investissement, l’un des sous-jacents atteint une seule fois la barrière respective (« Kick-In Level ») ou est inférieur à celle-ci, le remboursement par amortissement en espèces à l’échéance est basé sur la performance la plus faible (base Strike) du trio (au maximum toutefois à la valeur nominale majorée du coupon). Dans un tel cas, des pertes sont probables. Par ailleurs, avec les produits structurés, l’investisseur supporte le risque d’émetteur. Cela signifie qu’en cas d’insolvabilité d’UBS SA, le capital investi peut être perdu, indépendamment de l’évolution du sous-jacent.

Vous trouverez davantage de produits UBS et des informations sur les opportunités et les risques à l’adresse ubs.com/keyinvest.

Deutsche Telekom vs. Swisscom vs. AT&T
(5 ans, aux fins d’illustration uniquement, données en %)¹

Source: UBS AG, Bloomberg

Valeurs du: 27.02.2019

7.00% p.a. Worst of Kick-In GOAL sur Dt. Telekom / Swisscom / AT&T

Symbol KDEUDU
SVSP Name Barrier Reverse Convertible
SPVSP Code 1230
Sous-jacent Deutsche Telekom / Swisscom / AT&T
Devise EUR
Coupon 7.00% p.a.
Strike Level 100%
Kick-In Level (barrière)
65%
Echéance 04.09.2020
Émetteur UBS AG, London
Date de fixation du prix 06.03.2019, 15:00 h
 

Vous trouverez davantage de produits UBS et des informations sur les opportunités et les risques à l’adresse ubs.com/keyinvest.

Source: UBS AG, Bloomberg

Valeurs du: 27.02.2019

¹) La performance passée n’indique pas les résultats futures.
²) Les condition des ETTs sont vérifiés annuellement et peuvent être ajustées avec un délai de 13 mois après la publication.

This material has been prepared by UBS AG or one of its affiliates («UBS»). This material is for distribution only as permitted by law. It is not prepared for the needs of any specific recipient. It is published solely for information and is not a solicitation or offer to buy or sell any securities or related financial instruments (“Instruments”). UBS makes no representation or warranty, either express or implied, on the completeness or reliability of the information contained in this document (“Information”) except that concerning UBS AG and its affiliates. The Information should not be regarded by recipients as a substitute for using their own judgment. Any opinions expressed in this material may change without notice and may be contrary to opinions expressed by other business areas of UBS as a result of using different assumptions or criteria. UBS is under no obligation to update the Information. UBS, its officers, employees or clients may have or have had an interest in the Instruments and may at any time transact in them. UBS may have or have had a relationship with entities referred to in the Information. Neither UBS nor any of its affiliates, or their officers or employees, accepts any liability for any loss arising from use of the Information. This presentation is not a basis for entering into a transaction. Any transaction between you and UBS will be subject to the detailed provisions of the term sheet, confirmation or electronic matching systems relating to that transaction. Clients wishing to effect transactions should contact their local sales representative.
This information is communicated by UBS AG and/or its affiliates («UBS»). * (see below) UBS may from time to time, as principal or agent, have positions in, or may buy or sell, or make a market in any securities, currencies, financial instruments or other assets underlying the product to which this website relates (the «Structured Product»). UBS may provide investment banking and other services to and/or have officers who serve as directors of the companies referred to in this website. UBS’s trading and/or hedging activities related to the Structured Product may have an impact on the price of the underlying asset and may affect the likelihood that any relevant barrier or relevant trigger event is crossed or triggered. UBS has policies and procedures designed to minimise the risk that officers and employees are influenced by any conflicting interest or duty and that confidential information is improperly disclosed or made available. UBS may pay or receive brokerage or retrocession fees in connection with the Structured Product described herein. In respect of any Structured Product that is a security, UBS may, in certain circumstances, sell the Structured Product to dealers and other financial institutions at a discount to the issue price or rebate to them for their own account some proportion of the issue price. Further information is available on request. Structured Products are complex and may involve a high risk of loss. Prior to purchasing the Structured Product you should consult with your own legal, regulatory, tax, financial and accounting advisors to the extent you consider it necessary, and make your own investment, hedging and trading decisions (including decisions regarding the suitability of the Structured Product) based upon your own judgement and advice from those advisers you consider necessary. Save as otherwise expressly agreed in writing, UBS is not acting as your financial adviser or fiduciary in relation to the Product. UBS generally hedges its exposure to Structured Products, although it may elect not to hedge or to partially hedge any Structured Product. UBS’s hedging activity may be conducted through transactions in the underlying asset, index or instrument or in options, futures or other derivatives related to the underlying asset, index or instrument on publicly traded markets or otherwise, and may have an impact on the price of the under-lying asset. If a transaction is cash settled, UBS will generally unwind or offset any hedge it has for such Structured Product in close proximity to the relevant valuation time or period. In some cases, this activity may affect the value of the Structured Product. Unless stated otherwise in this document, (i) this document is for information purposes only and should not be construed as an offer, personal recommendation or solicitation to purchase the Structured Product and should not be treated as giving investment advice, and (ii) the terms of any investment in the Structured Product will be exclusively subject to the detailed provisions, including risk considerations, contained in the more detailed legal documentation that relates to the Structured Product (being the confirmation, information memorandum, prospectus or other issuer documentation as relevant). UBS makes no representation or warranty relating to any information herein which is derived from independent sources. This document shall not be copied or reproduced without UBS’s prior written permission. In respect of any Structured Product that is a security, no action has been or will be taken in any jurisdiction that would permit a public offering of the Product, save where explicitly stated in the issuer documentation. The Structured Product must be sold in accordance with all applicable selling restrictions in the jurisdictions in which it is sold.
© UBS 2018. All rights reserved. UBS prohibits the forwarding of this information without the approval of UBS.
Weekly Hits:Marchés actions suisse & Secteur des télécommunications2019-03-01T11:19:43+01:00

Weekly Hits: Schweizer Aktienmarkt & Telekomsektor


KeyInvest Weekly Hits
Donnerstag, 28.02.2019
  • Thema 1: Schweizer Aktienmarkt – Der Spitze so nah
  • Thema 2: Telekomsektor – Aufbruch in das 5G-Zeitalter

Schweizer Aktienmarkt
Der Spitze so nah

Der Schweizer Leitindex lässt die europäische Konkurrenz in diesem Jahr hinter sich. 11.7 Prozent legte das Barometer seit Silvester zu und liegt damit rund zwei Prozentpunkte vor dem Euro STOXX 50™ sowie dem DAX™. Angesichts der dynamischen Aufwärtsfahrt fehlen dem SMI™ nur noch etwa 200 Punkte oder 2.1 Prozent auf den Gipfel. Diesen markierten die heimischen Blue Chips im Januar 2018 bei 9’616 Punkten.¹ Der Total Return-Variante des Index – also jene, bei der die Dividenden in die Performance-Berechnung einfliessen, ist bereits ein neues Rekordhoch geglückt. Anleger haben mit dem ETT (Symbol: ETSMI) auf den SMI™ Total Return Index die Möglichkeit, sich eins zu eins an der Klettertour zu beteiligen.² Der neue Worst of Kick-In GOAL (Symbol: KDESDU) auf Nestlé, Novartis und Roche kommt dagegen ohne Kurssteigerungen aus, um in einem Jahr die Maximalrendite von 5.00 Prozent abzuwerfen.

Zahlen, Zahlen, Zahlen: Die Unternehmen befinden sich derzeit rund um den Globus im Bilanzfieber. Während sich die Berichtssaison in den USA bereits dem Ende zuneigt, ist hierzulande noch jede Menge geboten. Beispielsweise werden am 28. Februar (nach Redaktionsschluss) ABB und Adecco ihre Bücher offenlegen. Am gleichen Tag lädt Novartis zur Generalversammlung ein. Ein wichtiges Event, schiesslich müssen die Aktionäre dort über die geplante Abspaltung der Augenheilsparte Alcon abstimmen. Das Unternehmen geht davon aus, dass die Transaktion im zweiten Quartal 2019 abgeschlossen werden kann.
 
Mit den Zahlen zum Gesamtjahr hat Novartis-Chef Vas Narasimhan den Markt überzeugen können. In seinem ersten Jahr als CEO durfte er einen Nettoumsatzanstieg um sechs Prozent gegenüber dem Vorjahr auf 51.9 Milliarden US-Dollar bekanntgeben. Damit wurde das angekündigte Wachstum für 2018 erreicht. Insbesondere der Bereich «Innovative Medicines» stach mit einem Plus von acht Prozent heraus. Für 2019 erwartet der Pharma-Konzern einen Anstieg beim Nettoumsatz im mittleren einstelligen Prozentbereich. (Quelle: Novartis, Medienmitteilung, 30.01.2019) Wort gehalten hat auch Nestlé. Der Lebensmittelriese erzielte 2018 ein organisches Wachstum von 3.0 Prozent, die operative Gewinnmarge stieg auf bereinigter Basis um 50 Basispunkte auf 17.0 Prozent. CEO Mark Schneider rechnet für 2019 mit einer weiteren Verbesserung des organischen Wachstums sowie der bereinigten operative Rendite. (Quelle: Nestlé, Medienmitteilung, 14.02.2019)
 
Aber nicht alle SMI™-Konzerne ernteten Applaus für ihre jüngsten Geschäftszahlen. Zum Beispiel konnten Swatch und Julius Bär die Markterwartungen nicht erfüllen. Auf eine Schwäche im Luxus- und Finanzsektor lässt sich dadurch aber nicht schliessen. So erreichte Richemont die Prognosen, Credit Suisse und Zurich Insurance schnitten sogar besser ab als erwartet. Das gleiche gilt für Roche. Das Pharma-Unternehmen überraschte mit einem um sieben Prozent höheren Umsatz und acht Prozent höheren operativen Kerngewinn positiv. Zudem schraubt Roche die Dividende für 2018 auf 8.70 Franken je Anteil hoch, die 32. Erhöhung in Folge.


Chancen:
Für Anleger, die in den Genuss der Dividenden sowie möglichen Kurssteigerungen der 20 heimischen Blue Chips kommen möchten, könnte der von UBS emittierte ETT (Symbol: ETSMI) auf den SMI™ Total Return Index interessant sein. Das Produkt nimmt vollständig – abzüglich einer Verwaltungsgebühr von 0.25 Prozent p.a. – an der Kursentwicklung des Basiswerts teil.² Konservative Naturen können auch mit Teilschutz in den Schweizer Aktienmarkt investieren. Der in Zeichnung stehende Worst of Kick-In GOAL (Symbol: KDESDU) auf Nestlé, Novartis und Roche verfügt über einen Risikopuffer von 25 Prozent. Bleibt das SMI-Trio während der einjährigen Laufzeit über der Barriere, erzielt das Produkt die Maximalrendite von 5.00 Prozent p.a.

Risiken:
Die vorgestellten Produkte sind nicht kapitalgeschützt. Bei einem ETT kommt es zu Verlusten, sobald der zugrundeliegende Index unter dem Einstiegspreis zu liegen kommt. Notiert einer der Basiswerte des Worst of Kick-In GOALs während der Laufzeit einmal auf oder unter dem jeweiligen Kick-In Level, kann die Tilgung am Verfalltag durch Bartilgung entsprechend der (vom Strike aus) schwächsten Performance aus dem Trio erfolgen (höchstens jedoch zum Nominalwert zuzüglich Coupon). In diesem Fall sind Verluste wahrscheinlich. Zudem trägt der Anleger bei strukturierten Produkten das Emittentenrisiko, so dass das eingesetzte Kapital – unabhängig von der Entwicklung des Basiswertes – im Falle einer Insolvenz der UBS AG verloren gehen kann.

Weitere UBS Produkte sowie Informationen zu Chancen und Risiken finden Sie unter ubs.com/keyinvest.
 
 
SMI™ Total Return-Index¹
Die Total Return-Variante des SMI™ legte zuletzt dynamisch zu und brach im Februar 2019 auf ein neues Allzeithoch aus. Die aktuelle Bestmarke wurde am 26. Februar bei 19’399 Punkten markiert.
 
Quelle: UBS AG, Bloomberg
Stand: 27.02.2019

Nestlé vs. Novartis vs. Roche (5 Jahre, nur zu illustrativen Zwecken, Angaben in %)¹
Bei den Aktien von Nestlé, Novartis und Roche zeigen sich im Fünf-Jahres-Chart unterschiedliche Verläufe. Während die ersten beiden SMI-Schwergewichte klar zulegen konnten, gelang Roche nur ein kleines Plus.
 
Quelle: UBS AG, Bloomberg
Stand: 27.02.2019

 
¹) Bitte beachten Sie, dass vergangene Wertentwicklungen keine Indikationen für künftige Wertentwicklungen sind.
²) Die Konditionen der ETTs werden jährlich überprüft und können mit einer Frist von 13 Monaten nach Bekanntgabe angepasst werden
 
ETT auf den SMI™ TR Index

Remove
Symbol ETSMI
SVSP Name Tracker-Zertifikat
SPVSP Code 1300
Basiswert SMI™ TR Index
Bezugsverhältnis 100:1
Handelswährung CHF
Verwaltungsgebühr 0.25%
Partizipation 100%
Verfall Open End
Emittentin UBS AG, London
Geld-/Briefkurs CHF 190.10 / 191.10

Add
 

5.00% p.a. Worst of Kick-In GOAL auf Nestlé, Novartis, Roche

Remove
Symbol KDESDU
SVSP Name Barrier Reverse Convertible
SPVSP Code 1230
Basiswerte Nestlé, Novartis, Roche
Handelswährung CHF
Coupon 5.00% p.a.
Kick-In Level 75%
Verfall 06.03.2020
Emittentin UBS AG, London
Zeichnung bis 06.03.2019

Add
 

Weitere Produkte sowie Informationen zu Chancen und Risiken finden Sie unter: ubs.com/keyinvest Quelle: UBS AG, Bloomberg Stand: 27.02.2019
 
Marktübersicht
Index Stand Woche¹
SMI™ 9’412.19 1.0%
SLI™ 1’451.49 1.2%
S&P 500™ 2’792.38 0.3%
Euro STOXX 50™ 3’282.77 0.7%
S&P™ BRIC 40 4’245.58 1.6%
CMCI™ Compos. 930.61 0.2%
Gold (Feinunze) 1’321.20 -2.0%
Add

SMI™ vs. VSMI™ 1 Jahr

 
¹ Veränderung auf Basis des Schlusskurses des Vortages im Vergleich zum Schlusskurs vor einer Woche.
Der VSMI™ Index wird seit 2005 berechnet. Er zeigt die Volatilität der im SMI™ Index enthaltenen Aktien. Massgeblich für die Berechnung ist ein Portfolio, welches nicht auf Preisschwankungen, sondern ausschliesslich auf Veränderungen der Volatilität reagiert. Dabei greift die VSMI™ Methodik auf die quadrierten Volatilitäten, im Fachjargon „Varianzen“, der an der Eurex gehandelten SMI-Optionen mit einer konstanten Restlaufzeit von 30 Tagen zurück.


Telekomsektor
Aufbruch in das 5G-Zeitalter

 
2019 steht für den Telekomsektor ganz im Zeichen der Einführung des neuen Mobilfunkstandards 5G. Während in einigen Ländern bereit erste Lizenzen vergeben wurden, steht andernorts die entsprechend Auktion an. In ihrem jeweiligen Markt möchten Deutsche Telekom, Swisscom sowie AT&T diese Zukunftstechnologie aktiv mitgestalten. Passend dazu bringt UBS das Trio als Basiswerte für einen Worst of Kick-In GOAL (Symbol: KDEUDU) zusammen. Bei diesem Zeichnungsprodukt können Anleger mit einer Couponzahlung in Höhe von 7.00 Prozent p.a. rechnen. Die Renditechance ist an ein Sicherheitspolster von 35 Prozent gekoppelt.
 
Sei es Mobiles Fahren, Internet der Dinge oder E-Health – 5G gilt als Schlüsseltechnologie für eine Reihe von Zukunftstrends. Der superschnelle und vor allem unterbrechungsfreie Mobilfunkstandard macht viele Anwendungen erst möglich. In der Schweiz möchte Swisscom 5G bis Ende Jahr in 60 Städten und Gemeinden punktuell starten. Die dazu erforderlichen Lizenzen hat das Unternehmen vor kurzem für 196 Millionen Franken ersteigert. Das Management erachtet den Auktionsbetrag als ausserordentlich – er ist daher nicht in den für das laufende Jahr geplanten Investitionen enthalten. Ansonsten bleiben die ausgegebenen Ziele, dazu zählt unter anderem eine stabile Dividende von 22 Franken je Aktie, bestehen. (Quelle: Swisscom, Medienmitteilung, 08.02.2019). In Deutschland soll die Versteigerung der 5G-Lizenzen am 19. März beginnen. Zu den vier Unternehmen, die als Bieter zugelassen wurden, zählt die Deutsche Telekom. Zuletzt hat der Konzern solide Zahlen für 2018 vorgelegt. Beim bereinigten Betriebsergebnis zu konstanten Wechselkursen verbuchte die Telekom ein Wachstum von 7.2 Prozent auf den Rekordwert von 23.8 Milliarden Euro. Die Aktionäre sollen mit der vierten Dividendenerhöhung in Serie an diesem Erfolg beteiligt werden. (Quelle: Thomson Reuters, Medienbericht, 21. Februar 2019) Als Vorreiter bei der Einführung von 5G gelten die USA. AT&T hat den Service als erster Provider kurz vor Weihnachten 2018 in zwölf Städten teilweise hochgefahren. Im laufenden Semester sollen weitere Metropolen, darunter Los Angeles und San Francisco, dazu kommen. (Quelle: AT&T, Medienmitteilung, 18.12.2018)
 

Chancen:
An der Börse entfacht der Aufbruch in das 5G-Zeitalter noch keine Euphorie. Die drei genannten Telekomaktien befinden sich jeweils in einer längerfristigen Seitwärtsbewegung. Eine Fortsetzung dieser Konstellation würde ausreichen, um mit dem Worst of Kick-In GOAL (Symbol: KDEUDU) auf Deutsche Telekom, Swisscom und AT&T die Maximalrendite von 7.00 Prozent p.a. abzugreifen. Entscheidend ist, dass keine Basiswert während der Laufzeit auf oder unter die Barriere bei 65 Prozent der Anfangsfixierung fällt.

Risiken:
Kick-In GOALs sind nicht kapitalgeschützt. Notiert einer der Basiswertewährend der Laufzeit einmal auf oder unter dem jeweiligen Kick-In Level (Barriere),kann die Rückzahlung am Verfalltag durch Bartilgung entsprechend der (vom Strike aus) schwächsten Performance aus dem Trio erfolgen (höchstens jedoch zum Nominalwert zuzüglich Coupon). In diesem Fall sind Verluste wahrscheinlich. Zudemträgt der Anleger bei strukturierten Produkten das Emittentenrisiko, so dass daseingesetzte Kapital – unabhängig von der Entwicklung des Basiswertes – im Falleeiner Insolvenz der UBS AG verloren gehen kann.
Weitere UBS Produkte sowie Informationen zu Chancen und Risiken finden Sie unter ubs.com/keyinvest.
 
Deutsche Telekom vs. Swisscom vs. AT&T(5 Jahre, nur zu illustrativen Zwecken, Angabe in %)¹
Quelle: UBS AGStand: 27.02.2019

 
7.00% p.a. Worst of Kick-In GOAL auf Dt. Telekom / Swisscom / AT&T
Remove
Symbol KDEUDU
SVSP Name Barrier Reverse Convertible
SVSP Code 1230
Basiswerte Deutsche Telekom / Swisscom / AT&T
Handelswährung EUR
Coupon 7.00% p.a.
Strike Level 100%
Kick-In Level (Barriere) 65%
Verfall 04.09.2020
Emittentin UBS AG, London
Zeichnung bis 06.03.2019, 15:00 Uhr

Add
 

Termsheet Weitere Produkte sowie Informationen zu Chancen und Risiken finden Sie unter: ubs.com/keyinvest   Quelle: UBS AG Stand: 27.02.2019

 
¹) Bitte beachten Sie, dass vergangene Wertentwicklungen keine Indikationen für künftige Wertentwicklungen sind.
²) Die Konditionen der ETTs werden jährlich überprüft und können mit einer Frist von 13 Monaten nach Bekanntgabe angepasst werden


Die in diesem Dokument enthaltenen Informationen werden ausschliesslich zu Informations- und Werbezwecken zur Verfügung gestellt und stellen weder Empfehlungen noch Anlageberatung von UBS AG, einer ihrer Tochtergesellschaften oder verbundenen Unternehmen («UBS») dar. Dieses Dokument wird nicht von einer UBS Research Abteilung ausgegeben und ist deshalb nicht als unabhängige Anlageforschung zu erachten. Es stellt weder einen Verkaufsprospekt, noch ein Angebot oder eine Einladung zur Offertenstellung dar, irgendeine Art von Anlage zu tätigen. Beachten Sie bitte, dass die Anlagebeispiele die Ansichten von UBS Research möglicherweise nicht vollständig wiedergeben. Dieses Dokument und die darin beschriebenen Produkte und Dienstleistungen sind allgemeiner Natur und beziehen sich weder auf die persönlichen Anlageziele noch die finanzielle Situation oder besonderen Bedürfnisse eines spezifischen Empfängers. Anlageentscheide sollten stets im Portfoliokontext getroffen werden und Ihre persönliche Situation und Ihre entsprechende Risikobereitschaft und Risikofähigkeit berücksichtigen. Sie werden hiermit auf diese Risiken (die mitunter erheblich sein können) hingewiesen. Bevor Sie einen Anlageentscheid treffen, lesen Sie bitte die spezifischen Produkteinformationen und die Broschüre «Besondere Risiken im Effektenhandel». Bitte kontaktieren Sie Ihren Kundenberater, der Sie gerne bei Ihren Anlageideen unterstützt und Ihnen die spezifischen Produktinformationen zur Verfügung stellt. UBS übernimmt diesbezüglich keinerlei Haftung für das Verhalten von Dritten. Wir weisen Sie darauf hin, dass sich UBS das Recht vorbehält, Dienstleistungen, Produkte und Preise jederzeit ohne vorhergehende Ankündigung zu ändern, und dass sich die wiedergegebenen Informationen und Meinungen jederzeit ändern können. Es wird weder eine ausdrückliche noch stillschweigende Gewährleistung oder Garantie in Bezug auf die Richtigkeit, Vollständigkeit oder Verlässlichkeit der wiedergegebenen Informationen abgegeben, es sei denn, es handelt sich um Informationen, die sich auf die UBS AG beziehen. Zudem stellt dieses Dokument keine umfassende Beschreibung oder Zusammenfassung der genannten Märkte und Entwicklungen dar. Gewisse Zahlen beziehen sich auf vergangene Wertentwicklungen oder stellen simulierte Wertentwicklungen dar und sind somit keine zuverlässigen Indikatoren für künftige Ergebnisse. Bei einigen Zahlen handelt es sich möglicherweise lediglich um Prognosen, und Prognosen sind kein zuverlässiger Indikator für zukünftige Entwicklungen. Gewisse Diagramme und/oder Darstellungen von Wertentwicklungen basieren möglicherweise nicht auf 12-Monate-Perioden, was ihre Vergleichbarkeit und Aussagekraft reduziert. Wechselkurse können sich negativ auf den Wert, den Preis oder die Einnahmen von Produkten und Dienstleistungen auswirken, die in den Materialien genannt werden. Gebühren sind möglicherweise nicht enthalten und reduzieren die Wertentwicklung entsprechend. Die steuerliche Behandlung hängt von den individuellen Umständen jedes Kunden ab und kann sich in Zukunft ändern. UBS erbringt keine Rechts- oder Steuerberatungsdienste und gibt weder allgemeine noch auf die spezifischen Umstände und Bedürfnisse eines Kunden bezogene Erklärungen im Hinblick auf die steuerliche Behandlung von Anlagen oder der damit verbundenen Anlagerenditen ab. Die Empfänger sollten eine unabhängige rechtliche und steuerliche Beratung im Hinblick auf die Auswirkungen der Produkte/Dienstleistungen in der jeweiligen Rechtsordnung sowie die Eignung der Produkte und Dienstleistungen in Anspruch nehmen. UBS, ihre Verwaltungsräte, Geschäftsführer und Mitarbeiter oder Kunden halten oder hielten möglicherweise Anteile oder Hausse- und Baisse-Positionen («Longoder Short-Positionen») an den hierin genannten Wertpapieren oder sonstigen Finanzinstrumenten und können jederzeit als Auftraggeber oder Beauftrage Käufe und/oder Verkäufe tätigen. UBS fungiert oder fungierte möglicherweise als Marktmacher («Market-Maker») bei den Wertpapieren oder sonstigen Finanzinstrumenten. Des Weiteren unterhält oder unterhielt UBS möglicherweise eine Geschäftsbeziehung mit oder erbringt oder erbrachte Investmentbanking-, Kapitalmarktdienstleistungen und/oder sonstige Finanzdienstleistungen für die jeweiligen Unternehmen. Dieses Dokument und die darin enthaltenen Informationen sind ausschliesslich für Personen mit Domizil Schweiz gedacht. Sie dürfen unter keinen Umständen in Rechtsordnungen verbreitet werden, in denen eine solche Verbreitung gegen geltende Gesetze oder Regulierungen verstösst. Sie dürfen insbesondere nicht in den USA und/oder an USPersonen oder in Rechtsordnungen verteilt werden, in denen der Vertrieb durch uns eingeschränkt ist.Die im Dokument enthaltenen Informationen stammen, sofern nicht anders angegeben, von UBS. UBS übernimmt keine Gewährleistung (weder ausdrücklich noch stillschweigend) für Richtigkeit, Vollständigkeit und Aktualität der Informationen. Sie können jederzeit und ohne vorherige Ankündigung geändert werden. UBS ist nicht verpflichtet, die hierin enthaltenen Informationen zu aktualisieren oder auf dem neuesten Stand zu halten.Das vorliegende Material beinhaltet Daten, welche aus dem Backtesting von Daten resultieren, und wurde von UBS in gutem Glauben und unter Anwendung standardisierter Methoden erstellt. Diese Methoden basieren auf eigenen Modellen, empirischen Daten, Annahmen und anderen Informationen, die wir für korrekt und angemessen erachten. Gewisse Links führen zu Websites Dritter. Diese sind dem Einfluss der UBS vollständig entzogen, weshalb UBS für Richtigkeit, Vollständigkeit und Rechtmässigkeit des Inhalts solcher Websites sowie für darauf enthaltene Angebote und (Dienst-) Leistungen keinerlei Verantwortung übernimmt.Für gewisse Dienstleistungen und Produkte gelten gesetzliche Bestimmungen. Diese Dienstleistungen und Produkte können daher nicht weltweit uneingeschränkt angeboten werden.Hinweise zu den Grafiken: Nur für Illustrationszwecke. Vergangene Performance ist kein zuverlässiger Indikator für die künftige Performance. © UBS 2017. Das Schlüsselsymbol und UBS gehören zu den eingetragenen und nicht eingetragenen Markenzeichen von UBS. Alle Rechte bleiben vorbehalten.  Der SMI™ Index sowie entsprechende Marken und der SLI™ Index sowie entsprechende Marken und der der Swiss Performance Index™ Index (SPITM) sowie entsprechende Marken und der VSMI™ sowie entsprechende Marken sind Eigentum der SIX Swiss Exchange AG. Alle Rechte vorbehalten. Der S&P 500™ Index sowie entsprechende Marken und der S&P 500 Industrials Index™ sowie entsprechende Marken sind Eigentum der Standard & Poor›s Financial Services LLC. Alle Rechte vorbehalten. Der Euro STOXX 50™ Index sowie entsprechende Marken und der STOXX Europe 600 Banks Index sowie entsprechende Marken sind Eigentum der Stoxx AG. Alle Rechte vorbehalten. Der CMCI™ Composite Index sowie entsprechende Marken sind Eigentum der UBS AG. Alle Rechte vorbehalten. Der DAX™ Index sowie entsprechende Marken sind Eigentum der Deutsche Börse AG. Alle Rechte vorbehalten. Der JPM™ German Government Bond Index sowie entsprechende Marken sind Eigentum der JPM International Limited. Alle Rechte vorbehalten. Der NIKKEI 225™ Index sowie entsprechende Marken sind Eigentum der Nihon Keizai Shimbun Incorporation. Alle Rechte vorbehalten. Der EPRA Index™ sowie entsprechende Marken sind Eigentum der European Public Real Estate Association. Alle Rechte vorbehalten. Der FTSE™ Index sowie entsprechende Marken sind Eigentum der London Stock Exchange Group Holdings Limited. Alle Rechte vorbehalten. Der MSCI™ World Index sowie entsprechende Marken sind Eigentum der MSCI Incorporation. Alle Rechte vorbehalten. Der KOSPI™ Index sowie entsprechende Marken sind Eigentum der Korea Exchange Incorporation. Alle Rechte vorbehalten. Der HSCEI™ Index, der Hang Seng China EnterprisesTM Index sowie entsprechende Marken sind Eigentum der Hang Seng Data Services Limited. Alle Rechte vorbehalten.
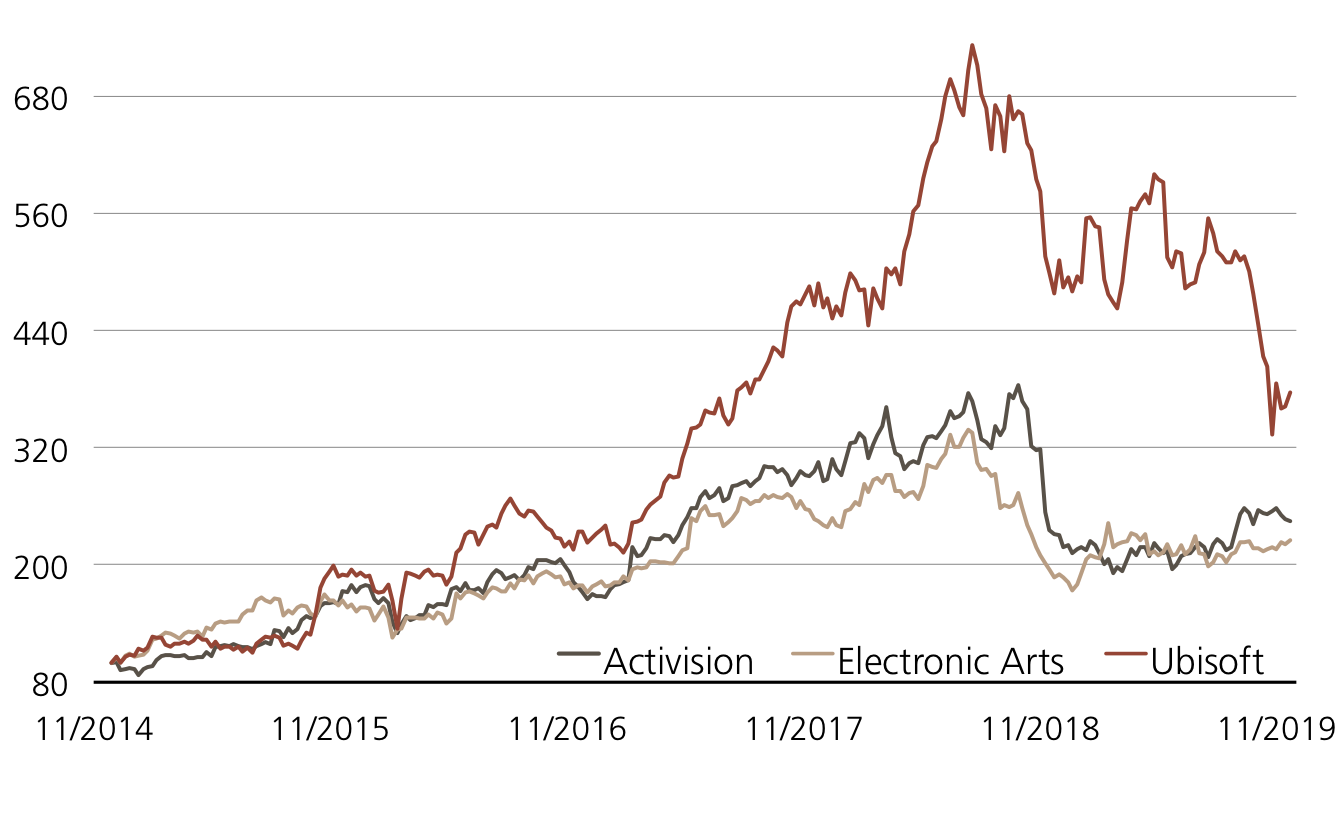
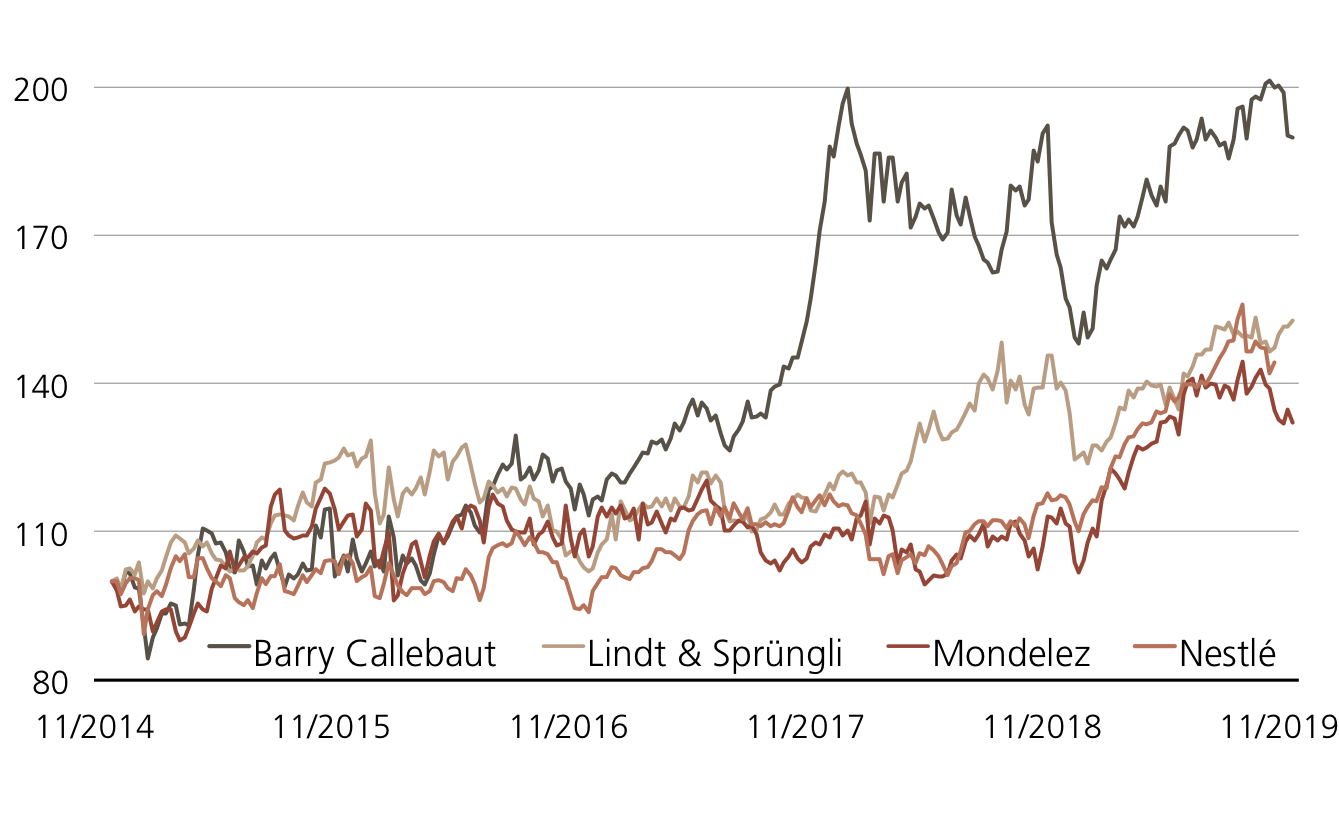
Weekly Hits: Schweizer Aktienmarkt & Telekomsektor2019-02-28T13:38:05+01:00

Weekly Hits: Le secteur de l’alimentation, Temenos & SAP

KeyInvest Weekly Hits

Vendredi, 22.02.2019

  • Thème 1: Le secteur de l’alimentation - Quand on y a pris goût
  • Thème 2: Temenos / SAP - Un duo de logiciels à forte croissance

Le secteur de l’alimentation
Quand on y a pris goût

En 2018, Nestlé a concrétisé son objectif en enregistrant une croissance organique de son chiffre d’affaires de 3%. Après la publication de ces résultats, l’action du premier groupe agroalimentaire mondial n’a pas été la seule à s’envoler vers un plus haut historique : dans la foulée du géant de la branche, le STOXX™ Europe 600 Food & Beverage Index a également atteint un nouveau record.¹ Un ETT (symbole : ETFOO) reproduit fidèlement cet indice composé de 24 fabricants européens de produits alimentaires et de boissons. L’été dernier, Nestlé, Barry Callebaut et EMMI ont été sélectionnés comme sous-jacents pour un Early Redemption (ER) Kick-In GOAL (symbole : KCAODU). En intégrant ce produit dans leur portefeuille, les investisseurs peuvent espérer une opportunité de rendement de 6,7% p.a. Même EMMI, le « Worst Performer » actuel, jouit d’un écart confortable de 38,8% par rapport à la barrière.

«La croissance a repris sur nos deux plus grands marchés, les États-Unis et la Chine, mais aussi dans le secteur de la nutrition infantile», a indiqué Mark Schneider, le CEO de Nestlé, en présentant les chiffres actuels. Il a également souligné que le groupe avait réalisé des « progrès considérables » avec la nouvelle orientation. Le bénéfice a bondi de manière disproportionnée grâce, notamment, aux effets exceptionnels générés par la vente de certaines activités. Au total, en 2018 Nestlé a gagné 10,1 milliards de francs, soit 41,6% de plus que l’année précédente. Les actionnaires devraient participer avec un dividende majoré de 10 centimes, soit 2,45 francs par action. Pour 2019, Mark Schneider laisse entrevoir une nouvelle accélération de la croissance. Il souhaite en même temps améliorer la marge, le bénéfice et l’efficience du capital. (Source : Nestlé, communiqué de presse, 14.02.2019)

Selon UBS CIO GWM, le groupe agroalimentaire a su redresser la barre en 2018 après six années de croissance en repli. Pour la période en cours, les analystes tablent déjà sur une hausse organique du chiffre d’affaires de 3,6% pour le géant agroalimentaire. CIO GWM continue de recommander « Buy » pour la Large Cap et a augmenté son objectif de cours à 100 francs. (Source : UBS CIO GWM, Nestlé, 18.02.2019)
Quelques jours après Nestlé, Danone a confirmé la reprise dans l’industrie agroalimentaire. À données comparables, le groupe de produits laitiers a annoncé pour 2018 une croissance de son chiffre d’affaires supérieure aux attentes de 2,9%. Pour 2019, le groupe français prévoit qu’elle s’établira aux alentours de 3%. (Source : Thomson Reuters, article de presse, 19.02.2019) Dans ce tableau esquissé par le premier producteur mondial de yaourts, les résultats divulgués récemment par EMMI ne dénotent pas : le 30 janvier 2019, le fabricant suisse de produits laitiers a publié une croissance organique de son chiffre d’affaires (corrigée des variations de change et des acquisitions) de 2,3% pour l’année passée, soit, selon l’entreprise, la plus forte progression enregistrée depuis 2014.

Opportunités: Grâce à l’ETT (symbole : ETFOO) sur le STOXX™ Europe 600 Food & Beverage Index, les investisseurs qui y ont pris goût peuvent se positionner facilement et de manière diversifiée dans le secteur agroalimentaire européen. Il n’y a traditionnellement pas de frais récurrents pour cette structure de produit² Toutefois, EMMI n’entre pas dans la composition de cet indice. Cela dit, la Mid Cap combinée à Nestlé et au spécialiste du chocolat Barry Callebaut offre une opportunité de rendement attrayante de 6,7% p.a. avec le ER Kick-In GOAL (symbole : KCAODU). Bien qu’EMMI affiche la plus faible évolution de cours du trio par rapport au cours d’émission, l’action présente un écart de 38,8% par rapport à la barrière. Dès que la cote des trois sous-jacents atteint ou dépasse le cours initial lors d’un jour d’observation, le Early Redemption devient exigible – l’émetteur rembourse alors l’intégralité du nominal et le pro rata du coupon par anticipation.

Risques: les produits présentés n’offrent pas de protection du capital. Une évolution négative de l’actif sous-jacent entraîne des pertes correspondantes pour l’ETT. Si, pendant la durée de l’investissement, un des sous-jacents du Worst of Kick-In GOAL cote une seule fois au niveau ou en dessous de la barrière respective («Kick-In Level») et que, de plus, la fonction «Early Redemption» ne s’applique pas, le remboursement par amortissement en espèces à l’échéance est basé sur la performance la plus faible (sur la base du Strike) du trio (au maximum toutefois à la valeur nominale majorée du coupon). Dans un tel cas, des pertes sont probables. Par ailleurs, avec les produits structurés, l’investisseur supporte le risque d’émetteur. Cela signifie qu’en cas d’insolvabilité d’UBS SA, le capital investi peut être perdu, indépendamment de l’évolution du sous-jacent.

Vous trouverez davantage de produits UBS et des informations sur les opportunités et les risques à l’adresse ubs.com/keyinvest.

STOXX™ Europe 600 Food & Beverages Index vs. STOXX™ Europe 600 Index
(5 ans, aux fins d’illustration uniquement, données en %)¹

Avec son récent pic historique, le STOXX™ Europe 600 Food & Beverages Index a mis fin à l’évolution latérale observée pendant près de deux ans.

Source: UBS AG, Bloomberg

Valeurs du: 20.02.2019

Barry Callebaut vs. EMMI vs. Nestlé
(5 ans, aux fins d’illustration uniquement, données en %)¹

Sur cinq ans, EMMI a distancé les deux grandes capitalisations. Alors que le fabricant de produits laitiers et Barry Callebaut ont enregistré des variations marquées, Nestlé a affiché une tendance haussière relativement stable.

Source: UBS AG, Bloomberg

Valeurs du: 20.02.2019

¹) La performance passée n’indique pas les résultats futures.
²) Les condition des ETTs sont vérifiés annuellement et peuvent être ajustées avec un délai de 13 mois après la publication.

ETT sur STOXX™ Europe 600 Food & Beverages NR Index

Symbol ETFOO
SVSP Name Tracker Certifikat
SVSP Code 1300
Sous-jacent STOXX™ Europe 600 Food & Beverages Net Return Index
Devise EUR
Rapport de souscription 1:1
Frais de gestion 0.00% p.a.²
Participation 100%
Echéance Open End
Émetteur UBS AG, London
Bid/Ask EUR 1’291.00 / 1’298.00 
 

5.00% p.a. Early Redemption Kick-In GOAL sur Barry Callebaut / EMMI AG / Nestlé

Symbol KCAODU
SVSP Name Barrier Reverse Convertible
SPVSP Code 1230 (Auto-Callable)
Sous-jacent Barry Callebaut / EMMI AG / Nestlé
Devise CHF
Coupon 5.00% p.a.
Rendement latéraux 13.03% (6.47% p.a.)
Kick-In Level (distance) Barry Callebaut: CHF 1’041.00 (40.14%)
EMMI AG: CHF 490.50 (39.52%)
Nestlé: CHF 47.94 (47.04%)
Echéance 26.01.2021
Émetteur UBS AG, London
Bid/Ask 96.10% / 97.10%
 

Vous trouverez davantage de produits UBS et des informations sur les opportunités et les risques à l’adresse ubs.com/keyinvest.

Source: UBS AG, Bloomberg

Valeurs du: 20.02.2019

Apérçu du marché

Index Citation Semaine¹
SMI™ 9’315.63 Pt. 1.7%
SLI™ 1’433.77 Pt. 1.2%
S&P 500™ 2’284.70 Pt. 1.2%
Euro STOXX 50™ 3’259.49 Pt. 1.8%
S&P™ BRIC 40 4’180.10 Pt. 0.0%
CMCI™ Compos. 928.80 Pt. 2.6%
Gold (troy ounce) 1’347.90 USD 2.5%

¹ Changement basé sur le cours de clôture du jour précédent par rapport au cours de clôture de la semaine dernière.

SMI™ vs. VSMI™ 1 année

L’index VSMI™ est calculé depuis 2005. Il affiche la volatilité des actions inclus dans le SMI™ index. Pour la calculation, un portefeuille est utilisé qui ne réagit qu’au variations de la volatilité au lieu des variations des prix. En le faisant, la méthodologie du VSMI™ utilise la volatilité carré, connu sous le terme variance, des options sur le SMI avec 30 jours jusqu’à l’échéance négociées à la Bourse Eurex.

Source: UBS AG, Bloomberg

Valeurs du: 20.02.2019

Temenos / SAP
Un duo de logiciels à forte croissance

On ne peut désormais plus parler de logiciels sans parler du cloud. L’externalisation des données et des logiciels sur Internet connaît un engouement croissant. Ainsi, en 2018, les activités de SAP sur le cloud ont bondi de 32% pour atteindre 4,99 milliards d’euros. L’indicateur « New Cloud Bookings » en hausse de 25% en fin d’année laisse penser que cet élan n’est pas près de s’essouffler. Les programmes de Temenos, qui déjà en 2011 avait lancé un système bancaire central sur le cloud pour la première fois, ont également été bien reçus. Le spécialiste des logiciels bancaires a vu ses revenus de licences croître de 21% l’an dernier. Pour maintenir cette dynamique, l’entreprise romande a lancé deux nouveaux produits basés sur le cloud en début d’année : Temenos Infinity et Temenos T24 Transact. Le Kick-In GOAL en souscription (symbole : KDEADU) réunit SAP et Temenos comme sous-jacents. Le duo offre une opportunité de rendement de 6,00% p.a. avec une marge de sécurité de 40%.

Les deux groupes brillent non seulement par leurs chiffres d’affaires mais aussi par leurs bénéfices considérables. En 2018, la marge opérationnelle de SAP s’est élevée à 29%, et la rentabilité du groupe devrait encore progresser. Lors de la Journée du marché des capitaux à New York, le directeur financier, Luka Mucic, a laissé entrevoir une amélioration des marges ces prochaines années, notamment grâce à un meilleur mix du chiffre d’affaires qui devrait accroître la rentabilité. À titre d’exemple, le groupe souhaite porter la marge brute de ses activités sur le cloud de 63% actuellement à 71% en 2020. (Source : Finanzen.net, article de presse, 07.02.2018)

Temenos devrait également poursuivre son ascension. Max Chuard, l’actuel COO et directeur financier qui prendra la barre du fabricant de logiciels bancaires le 1er mars, souhaite poursuivre la stratégie fructueuse de son prédécesseur, David Arnott. À moyen terme, l’entreprise table sur une expansion de son volume d’affaires de 10 à 15% chaque année, ce qui devrait également permettre d’améliorer la rentabilité de 100 à 150 points de base. En 2018, la marge EBIT a pris un point de pourcentage pour s’établir à 31,5%. (Source : Temenos, communiqué de presse, 12.02.2019)

Opportunités: depuis le début de l’année, les actions de SAP et de Temenos grimpent beaucoup plus vite que l’ensemble du marché comme en témoigne la Mid Cap suisse qui a gagné 21% depuis le 1er janvier.¹ Pour le Kick-In GOAL en souscription (symbole : KDEADU), de nouvelles avancées de cours ne sont pas nécessaires. Le produit offre un rendement maximal de 6,00% à condition qu’aucun des sous-jacents n’atteigne ou ne descende en-dessous de sa barrière fixée à 60% de sa valeur initiale pendant la période de 18 mois.

Risques: les Kick-In GOALs ne bénéficient d’aucune protection du capital. Si, pendant la durée de l’investissement, l’un des sous-jacents atteint une seule fois la barrière respective (« Kick-In Level ») ou est inférieur à celle-ci, l’amortissement par remboursement en espèces à l’échéance est basé sur la performance la plus faible (base Strike) du duo (au maximum toutefois à la valeur nominale majorée du coupon). Dans un tel cas, des pertes sont probables. Par ailleurs, avec les produits structurés, l’investisseur supporte le risque d’émetteur. Cela signifie qu’en cas d’insolvabilité d’UBS SA, le capital investi peut être perdu, indépendamment de l’évolution du sous-jacent.

Vous trouverez davantage de produits UBS et des informations sur les opportunités et les risques à l’adresse ubs.com/keyinvest.

Temenos vs. SAP
(5 ans, aux fins d’illustration uniquement, données en %)¹

Source: UBS AG, Bloomberg

Valeurs du: 20.02.2019

6.00% p.a. Worst of Kick-In GOAL sur Temenos / SAP

Symbol KDEADU
SVSP Name Barrier Reverse Convertible
SPVSP Code 1230
Sous-jacent Temenos / SAP
Devise CHF (Quanto)
Coupon 6.00% p.a.
Strike Level 100%
Kick-In Level (barrière)
60%
Echéance 31.08.2020
Émetteur UBS AG, London
Sous-jacent 27.02.2019, 15:00 h
 

Vous trouverez davantage de produits UBS et des informations sur les opportunités et les risques à l’adresse ubs.com/keyinvest.

Source: UBS AG, Bloomberg

Valeurs du: 20.02.2019

¹) La performance passée n’indique pas les résultats futures.
²) Les condition des ETTs sont vérifiés annuellement et peuvent être ajustées avec un délai de 13 mois après la publication.

This material has been prepared by UBS AG or one of its affiliates («UBS»). This material is for distribution only as permitted by law. It is not prepared for the needs of any specific recipient. It is published solely for information and is not a solicitation or offer to buy or sell any securities or related financial instruments (“Instruments”). UBS makes no representation or warranty, either express or implied, on the completeness or reliability of the information contained in this document (“Information”) except that concerning UBS AG and its affiliates. The Information should not be regarded by recipients as a substitute for using their own judgment. Any opinions expressed in this material may change without notice and may be contrary to opinions expressed by other business areas of UBS as a result of using different assumptions or criteria. UBS is under no obligation to update the Information. UBS, its officers, employees or clients may have or have had an interest in the Instruments and may at any time transact in them. UBS may have or have had a relationship with entities referred to in the Information. Neither UBS nor any of its affiliates, or their officers or employees, accepts any liability for any loss arising from use of the Information. This presentation is not a basis for entering into a transaction. Any transaction between you and UBS will be subject to the detailed provisions of the term sheet, confirmation or electronic matching systems relating to that transaction. Clients wishing to effect transactions should contact their local sales representative.
This information is communicated by UBS AG and/or its affiliates («UBS»). * (see below) UBS may from time to time, as principal or agent, have positions in, or may buy or sell, or make a market in any securities, currencies, financial instruments or other assets underlying the product to which this website relates (the «Structured Product»). UBS may provide investment banking and other services to and/or have officers who serve as directors of the companies referred to in this website. UBS’s trading and/or hedging activities related to the Structured Product may have an impact on the price of the underlying asset and may affect the likelihood that any relevant barrier or relevant trigger event is crossed or triggered. UBS has policies and procedures designed to minimise the risk that officers and employees are influenced by any conflicting interest or duty and that confidential information is improperly disclosed or made available. UBS may pay or receive brokerage or retrocession fees in connection with the Structured Product described herein. In respect of any Structured Product that is a security, UBS may, in certain circumstances, sell the Structured Product to dealers and other financial institutions at a discount to the issue price or rebate to them for their own account some proportion of the issue price. Further information is available on request. Structured Products are complex and may involve a high risk of loss. Prior to purchasing the Structured Product you should consult with your own legal, regulatory, tax, financial and accounting advisors to the extent you consider it necessary, and make your own investment, hedging and trading decisions (including decisions regarding the suitability of the Structured Product) based upon your own judgement and advice from those advisers you consider necessary. Save as otherwise expressly agreed in writing, UBS is not acting as your financial adviser or fiduciary in relation to the Product. UBS generally hedges its exposure to Structured Products, although it may elect not to hedge or to partially hedge any Structured Product. UBS’s hedging activity may be conducted through transactions in the underlying asset, index or instrument or in options, futures or other derivatives related to the underlying asset, index or instrument on publicly traded markets or otherwise, and may have an impact on the price of the under-lying asset. If a transaction is cash settled, UBS will generally unwind or offset any hedge it has for such Structured Product in close proximity to the relevant valuation time or period. In some cases, this activity may affect the value of the Structured Product. Unless stated otherwise in this document, (i) this document is for information purposes only and should not be construed as an offer, personal recommendation or solicitation to purchase the Structured Product and should not be treated as giving investment advice, and (ii) the terms of any investment in the Structured Product will be exclusively subject to the detailed provisions, including risk considerations, contained in the more detailed legal documentation that relates to the Structured Product (being the confirmation, information memorandum, prospectus or other issuer documentation as relevant). UBS makes no representation or warranty relating to any information herein which is derived from independent sources. This document shall not be copied or reproduced without UBS’s prior written permission. In respect of any Structured Product that is a security, no action has been or will be taken in any jurisdiction that would permit a public offering of the Product, save where explicitly stated in the issuer documentation. The Structured Product must be sold in accordance with all applicable selling restrictions in the jurisdictions in which it is sold.
© UBS 2018. All rights reserved. UBS prohibits the forwarding of this information without the approval of UBS.
Weekly Hits: Le secteur de l’alimentation, Temenos & SAP2019-02-22T09:12:08+01:00

Weekly Hits: Food sector, Temenos & SAP

KeyInvest Weekly Hits

Friday, 22.02.2019

  • Topic 1: Food sector - Acquiring a taste for more
  • Topic 2: Temenos/SAP - Fast-growing software duo

Food sector
Acquiring a taste for more

In 2018, Nestlé generated organic revenue growth of 3%, in line with the target. According to the reported figures, not only the share of the world’s largest food company climbed to an all-time high. The STOXX™ Europe 600 Food & Beverage Index also reached a historic best in the wake of the industry giant.¹ An ETT (symbol: ETFOO) replicates the benchmark of 24 European food and beverage manufacturers. Last summer Nestlé, along with Barry Callebaut and EMMI, was selected as the underlying for an Early Redemption (ER) Kick-In GOAL (symbol: KCAODU). With this product, investors can add a return opportunity of 6.7% p.a. to their portfolio. Even the current worst performer, EMMI, has a comfortable distance to the barrier of 38.8%.

«Growth has picked up in our two largest markets, the U.S. and China, as well as in infant nutrition,» explained Nestlé CEO Mark Schneider. At the same time, he stressed that the Group had «made significant progress» with its realignment. The profit grew disproportionately, not least thanks to one-off effects from the saleof business units: Below the line, Nestlé earned CHF 10.1 billion in 2018, 41.6% more than in the previous year. Shareholders are to participate with a dividend that increased by 10 centimes to CHF 2.45 per share certificate. Schneider is anticipating a further acceleration in growth for 2019. At the same time, he wants to improve the margin, profit and capital efficiency. (Source: Nestlé, media release, February 14, 2019)

According to UBS CIO GWM, the food company has achieved a turnaround in 2018 after six years of declining growth. For the current period, analysts already believe that the industry giant will generate organic sales growth of 3.6%. CIO GWM continues to rate the large cap as a «buy» and raised its price target to CHF 100. (Source: UBS CIO GWM, Nestlé, February 18, 2019)
A few days after Nestlé, Danone corroborated the upturn in the food industry. On a comparable basis, the dairy group reported sales growth of 2.9% in 2018, which exceeded expectations. For 2019, the French company forecasts a growth in sales of around 3%. (Source: Thomson Reuters, media release, February 19, 2019) EMMI’s latest figures fit the latest world’s largest yogurt producer’s expectations : On January 30, 2019, the domestic milk processor reported organic (currency- and acquisition-adjusted) revenue growth of 2.3% for last year. According to the company, this was the highest increase since 2014.

Opportunities: Investors who have acquired a taste for the food industry can position themselves in the European food sector in an easy and diversified manner with the ETT (symbol: ETFOO) on the STOXX™ Europe 600 Food & Beverage Index. There are typically no ongoing fees for this product structure.² EMMI is not included in this benchmark.- The mid cap however, together with Nestlé and chocolate specialist Barry Callebaut, provides an attractive yield opportunity of 6.7% p.a. for the ER Kick-In GOAL (Symbol: KCAODU). Although EMMI exhibits the weakest price trend of the three compared to when shares were issued, the share has a distance to the barrier of 38.8%. Once all three underlyings are quoted at or above the starting level on an observation date, the early redemption will take place and the issuer will repay the full nominal and pro-rata coupon early.

Risks: The aforementioned products do not have capital protection. Should the underlying assets deliver a negative performance, the ETT will incur commensurate losses. If one of the underlyings in a Worst of Kick-In GOAL touches or falls below the respective kick-in level (barrier) and the early redemption feature does not apply, repayment at maturity may be in cash, reflecting the weakest performance of the trio from strike (but no more than nominal value plus coupon). In this case, it is likely that losses will be incurred. Investors in structured products are also exposed to issuer risk, which means that the invested capital may be lost if UBS AG becomes insolvent, regardless of the performance of the underlying.

More UBS products and further information on the risks and opportunities are available at ubs.com/keyinvest.

STOXX™ Europe 600 Food & Beverages Index vs. STOXX™ Europe 600 Index
(five years, for illustrative purposes only, figures in %)¹

With the recent all-time high, the STOXX™ Europe 600 Food & Beverages Index set out to break out of a sideways movement that had been observed for almost two years.

Source: UBS AG, Bloomberg

As of 20.02.2019

Barry Callebaut vs. EMMI vs. Nestlé
(five years, for illustrative purposes only, figures in %)¹

EMMI outperformed the two large caps over a period of five years. While both the milk processor and Barry Callebaut showed marked swings, Nestlé exhibited a relatively stable upward trend.

Source: UBS AG, Bloomberg

As of: 20.02.2019

¹) Please be aware that past performance does not indicate future results.
²) The conditions of ETTs are reviewed on a yearly basis and can be adjusted with a deadline of 13 months after the announcement.

ETT on STOXX™ Europe 600 Food & Beverages NR Index

Symbol ETFOO
SVSP Name Tracker Certificates
SPVSP Code 1300
Underlying STOXX™ Europe 600 Food & Beverages Net Return Index
Currency EUR
Ratio 1:1
Administration fee 0.00% p.a.²
Expiry Open End
Participation 100%
Issuer UBS AG, London
Bid/Ask EUR 1’291.00 / 1’298.00 
 

5.00% p.a. Early Redemption Kick-In GOAL on Barry Callebaut / EMMI AG / Nestlé

Symbol KCAODU
SVSP Name Barrier Reverse Convertible
SPVSP Code 1230 (Auto-Callable)
Underlying Barry Callebaut / EMMI AG / Nestlé
Currency CHF
Coupon 5.00% p.a.
Sideways return 13.03% (6.47% p.a.)
Kick-In Level (Distance) Barry Callebaut: CHF 1’041.00 (40.14%)
EMMI AG: CHF 490.50 (39.52%)
Nestlé: CHF 47.94 (47.04%)
Expiry 26.01.2021
Issuer UBS AG, London
Bid/Ask 96.10% / 97.10%
 

More UBS products and further information on the risks and opportunities are available at ubs.com/keyinvest.

Source: UBS AG, Bloomberg

As of: 20.02.2019

Market overview

Index Quotation Week¹
SMI™ 9’315.63 Pt. 1.7%
SLI™ 1’433.77 Pt. 1.2%
S&P 500™ 2’284.70 Pt. 1.2%
Euro STOXX 50™ 3’259.49 Pt. 1.8%
S&P™ BRIC 40 4’180.10 Pt. 0.0%
CMCI™ Compos. 928.80 Pt. 2.6%
Gold (troy ounce) 1’347.90 USD 2.5%

¹ Change based on the closing price of the previous day compared to the closing price a week ago.

SMI™ vs. VSMI™ 1 year

smi vs vsmi

The VSMI™ Index is calculated since 2005. It shows the volatility of the stocks within the SMI™ index. A portfolio which reacts only to changes in volatility instead of volatility itself is relevant for the calculation. Thereby, the VSMI™ methodology uses the squared volatility, known as variance, of the SMI options with remaining time to expiry of 30 days traded at the Eurex.

Source: UBS AG, Bloomberg

As of: 20.02.2019

Temenos/SAP
Fast-growing software duo

When it comes to software, it has been impossible to avoid the cloud for some time now. There is an ever-increasing demand for outsourcing data and software to the Internet. As a result, SAP expanded its cloud business by 32% to EUR 4.99 billion in 2018. The fact that this growth will continue is underscored by the «new cloud bookings» figure, which rose by 25%. Temenos’s programs have also been well received. The company launched a core banking system in the cloud for the first time in 2011. The banking software specialist increased its software license revenues by 21% last year. In order to maintain the momentum, the company, based in French-speaking Switzerland,launched two new cloud products at the beginning of the year: Temenos Infinity and Temenos T24 Transact. The Kick-In GOAL (symbol: KDEADU) available for subscription brings SAP and Temenos together as underlying values. With a risk buffer of 40%, the duo offers a return opportunity of 6.00% p.a.

Not only are the software companies excelling on the sales side, they are also both generating high profits. SAP’s operating margin was 29% in 2018 and profitability is expected to increase even further. At Capital Markets Day in New York, Chief Financial Officer Luka Mucic held out the prospect of an improvement in margins year over year. An improved revenue mix in particular should lead to greater profitability. For example, Mucic wants to improve the gross margin in the cloud business from the current 63% to 71% by 2020. (Source: Finanzen.net, media report, February 7, 2018)

Temenos is also expected to continue its upward trend. The former COO and CFO Max Chuard, who will take over the leadership at the banking software manufacturer on March 1, wants to continue the successful strategy of his predecessor David Arnott. In the medium term, the company anticipates an annual increase in business volume of 10-15%. Profitability is also expected to improve by 100 to 150 basis points p.a. In 2018, the EBIT margin increased by one percentage point to 31.5%. (Source: Temenos, media release, February 12, 2019)

Opportunities: Since the beginning of the year, SAP and Temenos shares have significantly outperformed the market as a whole. For example, the Swiss mid cap has gained 21% since December 31.¹ Further price premiums are not necessary for the Kick-In GOAL (symbol: KDEADU) in subscription. The product offers a maximum return of 6.00% p.a. This is subject to the condition that none of the underlyings touches or falls below the barrier fixed at 60% of the starting values within the 18-month term.

Risks: Kick-In GOALs do not have capital protection. If the underlyings equal or fall below the respective kick-in level (barrier), the amount repaid on the date of maturity may be in cash, reflecting the worst performance of the two shares (but not more than nominal value plus coupon). In this case, it is likely that losses will be incurred. Investors in structured products are also exposed to issuer risk, which means that the capital invested may be lost if UBS AG becomes insolvent, regardless of the performance of the underlying.

More UBS products and further information on the risks and opportunities are available at ubs.com/keyinvest.

Temenos vs. SAP
(five years, for illustrative purposes only, figures in %)¹

Source: UBS AG, Bloomberg

As of: 20.02.2019

6.00% p.a. Worst of Kick-In GOAL on Temenos / SAP

Symbol KDEADU
SVSP Name Barrier Reverse Convertibles
SPVSP Code 1230
Underlyings Temenos / SAP
Currency CHF (Quanto)
Coupon 6.00% p.a.
Strike Level 100%
Kick-In Level (barrier) 60%
Expiry 31.08.2020
Issuer UBS AG, London
Subscription until 27.02.2019, 15:00 h
 

More UBS products and further information on the risks and opportunities are available at ubs.com/keyinvest.

Source: UBS AG, Bloomberg

As of: 20.02.2019

¹) Please be aware that past performance does not indicate future results.
²) The conditions of ETTs are reviewed on a yearly basis and can be adjusted with a deadline of 13 months after the announcement.

This material has been prepared by UBS AG or one of its affiliates («UBS»). This material is for distribution only as permitted by law. It is not prepared for the needs of any specific recipient. It is published solely for information and is not a solicitation or offer to buy or sell any securities or related financial instruments (“Instruments”). UBS makes no representation or warranty, either express or implied, on the completeness or reliability of the information contained in this document (“Information”) except that concerning UBS AG and its affiliates. The Information should not be regarded by recipients as a substitute for using their own judgment. Any opinions expressed in this material may change without notice and may be contrary to opinions expressed by other business areas of UBS as a result of using different assumptions or criteria. UBS is under no obligation to update the Information. UBS, its officers, employees or clients may have or have had an interest in the Instruments and may at any time transact in them. UBS may have or have had a relationship with entities referred to in the Information. Neither UBS nor any of its affiliates, or their officers or employees, accepts any liability for any loss arising from use of the Information. This presentation is not a basis for entering into a transaction. Any transaction between you and UBS will be subject to the detailed provisions of the term sheet, confirmation or electronic matching systems relating to that transaction. Clients wishing to effect transactions should contact their local sales representative.
This information is communicated by UBS AG and/or its affiliates («UBS»). * (see below) UBS may from time to time, as principal or agent, have positions in, or may buy or sell, or make a market in any securities, currencies, financial instruments or other assets underlying the product to which this website relates (the «Structured Product»). UBS may provide investment banking and other services to and/or have officers who serve as directors of the companies referred to in this website. UBS’s trading and/or hedging activities related to the Structured Product may have an impact on the price of the underlying asset and may affect the likelihood that any relevant barrier or relevant trigger event is crossed or triggered. UBS has policies and procedures designed to minimise the risk that officers and employees are influenced by any conflicting interest or duty and that confidential information is improperly disclosed or made available. UBS may pay or receive brokerage or retrocession fees in connection with the Structured Product described herein. In respect of any Structured Product that is a security, UBS may, in certain circumstances, sell the Structured Product to dealers and other financial institutions at a discount to the issue price or rebate to them for their own account some proportion of the issue price. Further information is available on request. Structured Products are complex and may involve a high risk of loss. Prior to purchasing the Structured Product you should consult with your own legal, regulatory, tax, financial and accounting advisors to the extent you consider it necessary, and make your own investment, hedging and trading decisions (including decisions regarding the suitability of the Structured Product) based upon your own judgement and advice from those advisers you consider necessary. Save as otherwise expressly agreed in writing, UBS is not acting as your financial adviser or fiduciary in relation to the Product. UBS generally hedges its exposure to Structured Products, although it may elect not to hedge or to partially hedge any Structured Product. UBS’s hedging activity may be conducted through transactions in the underlying asset, index or instrument or in options, futures or other derivatives related to the underlying asset, index or instrument on publicly traded markets or otherwise, and may have an impact on the price of the under-lying asset. If a transaction is cash settled, UBS will generally unwind or offset any hedge it has for such Structured Product in close proximity to the relevant valuation time or period. In some cases, this activity may affect the value of the Structured Product. Unless stated otherwise in this document, (i) this document is for information purposes only and should not be construed as an offer, personal recommendation or solicitation to purchase the Structured Product and should not be treated as giving investment advice, and (ii) the terms of any investment in the Structured Product will be exclusively subject to the detailed provisions, including risk considerations, contained in the more detailed legal documentation that relates to the Structured Product (being the confirmation, information memorandum, prospectus or other issuer documentation as relevant). UBS makes no representation or warranty relating to any information herein which is derived from independent sources. This document shall not be copied or reproduced without UBS’s prior written permission. In respect of any Structured Product that is a security, no action has been or will be taken in any jurisdiction that would permit a public offering of the Product, save where explicitly stated in the issuer documentation. The Structured Product must be sold in accordance with all applicable selling restrictions in the jurisdictions in which it is sold.
© UBS 2018. All rights reserved. UBS prohibits the forwarding of this information without the approval of UBS.
Weekly Hits: Food sector, Temenos & SAP2019-02-22T09:23:13+01:00

Weekly Hits: Nahrungsmittelsektor, SAP & Temenos


KeyInvest Weekly Hits
Donnerstag, 21.02.2019
  • Thema 1: Nahrungsmittelsektor – Auf den Geschmack gekommen 
  • Thema 2: SAP / Temenos – Wachstumsstarkes Software-Duo

Nahrungsmittelsektor
Auf den Geschmack gekommen

Nestlé hat 2018 ein organisches Umsatzwachstum von drei Prozent verbucht und damit die Zielsetzung erreicht. Nach der Zahlenvorlage kletterte nicht nur die Aktie des weltgrössten Lebensmittelkonzerns auf ein Allzeithoch. Im Sog des Branchenkrösus erreichte auch der STOXX™ Europe 600 Food & Beverage Index eine historische Bestmarke.¹ Ein ETT (Symbol: ETFOO) bildet den mit 24 europäischen Nahrungsmittel- und Getränkeherstellern bestückten Benchmark eins-zu-eins ab. Zusammen mit Barry Callebaut und EMMI wurde Nestlé im vergangenen Sommer als Basiswert für einen Early Redemption (ER) Kick-In GOAL (Symbol: KCAODU) ausgewählt. Mit diesem Produkt holen sich Anleger eine Renditechance von 6.5 Prozent p.a. ins Portfolio. Selbst beim aktuellen Worst-Performer EMMI beträgt der Barriereabstand komfortable 39.5 Prozent.

«Das Wachstum hat sich in unseren beiden grössten Märkten, den Vereinigten Staaten und China, und auch im Bereich Säuglingsnahrung wiederbelebt», kommentierte Nestlé-CEO Mark Schneider die aktuellen Zahlen. Gleichzeitig betonte er, dass der Konzern bei der Neuausrichtung «bedeutende Fortschritte erzielt» habe. Nicht zuletzt dank Einmaleffekten aus dem Verkauf von Geschäftsteilen legte der Gewinn überproportional zu: Unterm Strich verdiente Nestlé 2018 mit 10.1 Milliarden Franken 41.6 Prozent mehr als im Vorjahr. Daran sollen die Aktionäre mit einer um 10 Rappen auf 2.45 Franken je Anteilsschein erhöhten Dividende beteiligt werden. Für 2019 stellt Schneider eine weitere Beschleunigung beim Wachstum in Aussicht. Gleichzeitig möchte er Marge, Gewinn und Kapitaleffizienz verbessern. (Quelle: Nestlé, Medienmitteilung, 14.02.2019) Laut UBS CIO GWM hat der Lebensmittelkonzern 2018 nach sechs rückläufigen Jahren beim Wachstum die Wende geschafft. Für die laufende Periode trauen die Analysten dem Branchenkrösus bereits ein organisches Umsatzplus von 3.6 Prozent zu. CIO GWM stuft den Large Cap weiter mit «Buy» ein und erhöhte das Kursziel auf 100 Franken. (Quelle: UBS CIO GWM, Nestlé, 18.02.2019) Wenige Tage nach Nestlé untermauerte Danone den Aufschwung in der Nahrungsmittelindustrie. Der Molkereikonzern meldete für 2018 auf vergleichbarer Basis ein über den Erwartungen liegendes Umsatzwachstum von 2.9 Prozent. Für 2019 prognostizieren die Franzosen ein Umsatzwachstum von rund drei Prozent. (Quelle: Thomson Reuters, Medienbericht, 19.02.2019) In das vom weltgrössten Joghurtproduzenten skizzierte Bild passen die jüngsten Zahlen von EMMI: Der heimische Milchverarbeiter meldete am 30. Januar 2019 für das vergangene Jahr ein organisches (währungs- und akquisitionsbereinigt) Umsatzwachstum von 2.3 Prozent. Dem Unternehmen zufolge war dies die höchste Steigerung seit 2014. 
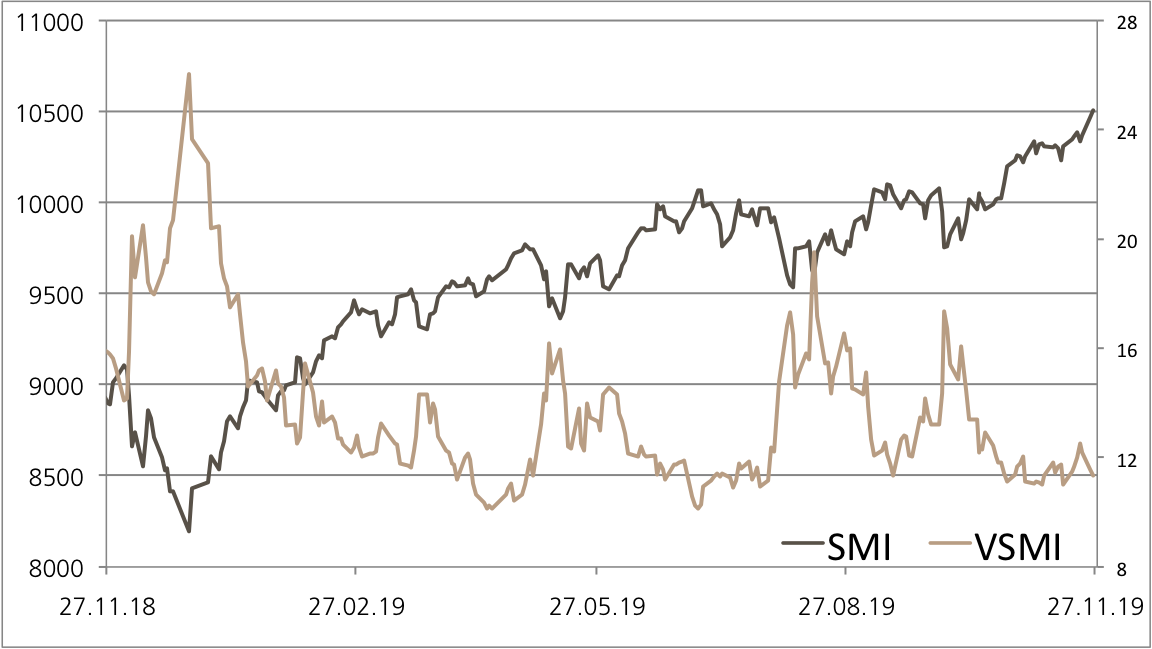
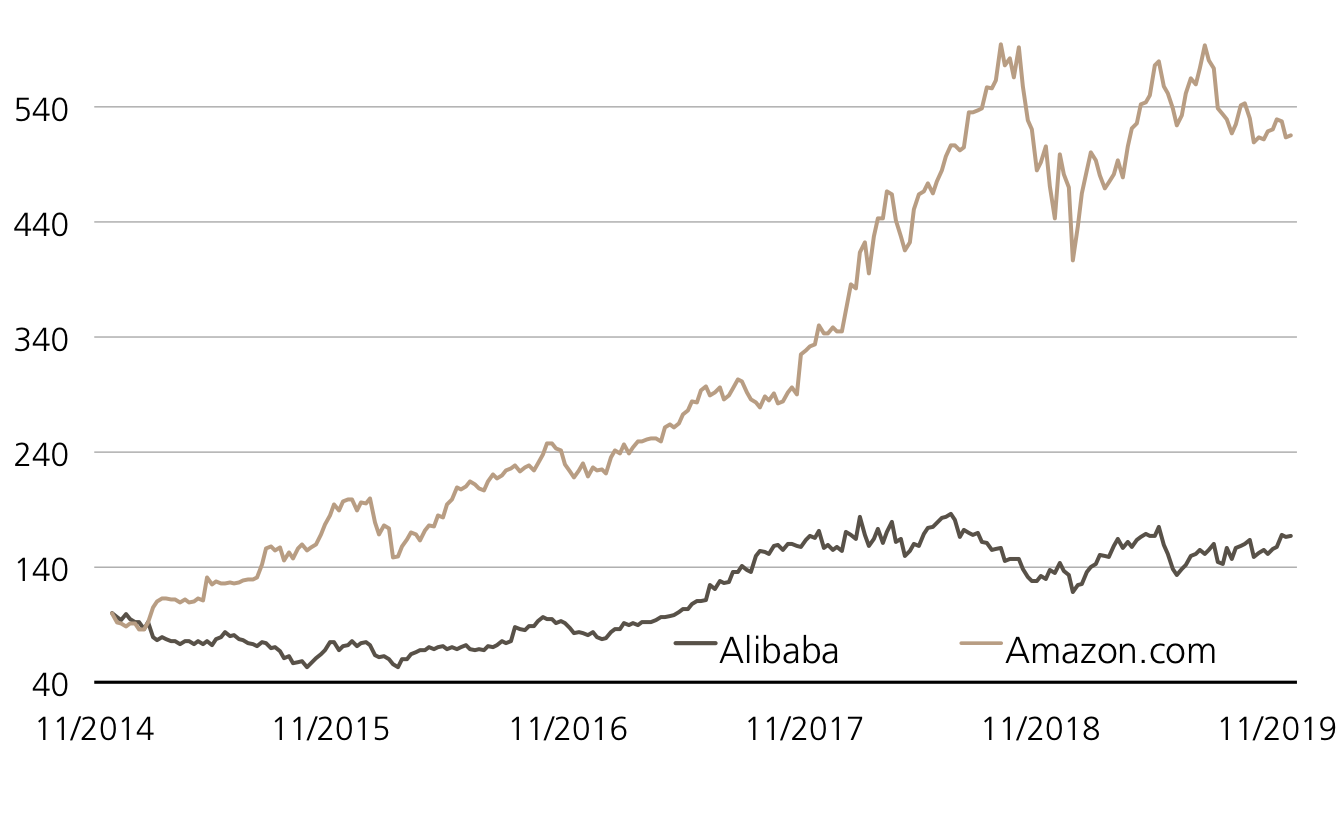

Chancen:
Anleger, die auf den Geschmack gekommen sind, können sich mit dem ETT (Symbol: ETFOO) auf den STOXX™ Europe 600 Food & Beverage Index einfach und diversifiziert im europäischen Nahrungsmittelsektor positionieren. Typisch für diese Produktstruktur fallen keine laufenden Gebühren an.²Zwar ist EMMI nicht in diesem Benchmark enthalten. Jedoch ermöglicht der Mid Cap Im Verbund mit Nestlé und dem Schoggi-Spezialisten Barry Callebaut beim ER Kick-In GOAL (Symbol: KCAODU) eine attraktive Renditechance von 6.5 Prozent p.a. Obwohl EMMI gegenüber der Emission die schwächste Kursentwicklung aus dem Trio zeigt, verfügt die Aktie über einen Barriereabstand von 39.5 Prozent. Sobald alle drei Basiswerte an einem Beobachtungstag auf oder über dem Startniveau notieren, kommt es zur Early Redemption – die Emittentin zahlt das vollständige Nominal sowie den anteiligen Coupon vorzeitig zurück.

Risiken:
Die vorgestellten Produkte sind nicht kapitalgeschützt. Eine negativeEntwicklung des Basiswerts führt beim ETT zu entsprechenden Verlusten. Notierteiner der Basiswerte beim Worst of Kick-In GOAL während der Laufzeit einmal auf oder unter dem jeweiligen Kick-In Level (Barriere) und kommt zudem das Early Redemption Feature nicht zum Tragen, kann die Rückzahlung am Verfalltag durch Bartilgung entsprechend der (vom Strike aus) schwächsten Performance aus dem Trio erfolgen (höchstens jedoch zum Nominalwert zuzüglich Coupon). In diesem Fall sind Verluste wahrscheinlich. Zudem trägt der Anleger bei Strukturierten Produkten das Emittentenrisiko, so dass das eingesetzte Kapital – unabhängig von der Entwicklung des Basiswertes – im Falle einer Insolvenz der UBS AG verloren gehen kann. 

Weitere UBS Produkte sowie Informationen zu Chancen und Risiken finden Sie unter ubs.com/keyinvest.
 
 
STOXX™ Europe 600 Food & Beverages Index vs. STOXX™ Europe 600 Index (5 Jahre, nur zu illustrativen Zwecken, Angaben in %)¹
Mit dem zuletzt markierten Allzeithoch machte sich der STOXX™ Europe 600 Food & Beverages Index daran, eine seit annähernd zwei Jahren zu beobachtende Seitwärtsbewegung nach oben aufzulösen.
 
Quelle: UBS AG, Bloomberg
Stand: 20.02.2019

Barry Callebaut vs. EMMI vs. Nestlé (5 Jahre, nur zu illustrativen Zwecken, Angaben in %)¹
Auf Sicht von fünf Jahren hängte EMMI die beiden Large Caps ab. Während sowohl der Milchverarbeiter als auch Barry Callebaut markante Ausschläge zeigen, entwickelte sich Nestlé relativ stabil nach oben.
 
Quelle: UBS AG, Bloomberg
Stand: 20.02.2019

 
¹) Bitte beachten Sie, dass vergangene Wertentwicklungen keine Indikationen für künftige Wertentwicklungen sind.
²) Die Konditionen der ETTs werden jährlich überprüft und können mit einer Frist von 13 Monaten nach Bekanntgabe angepasst werden
 
ETT auf den STOXX™ Europe 600 Food & Beverages NR Index

Remove
Symbol ETFOO
SVSP Name Tracker-Zertifikat
SVSP Code 1300
Basiswert STOXX™ Europe 600 Food & Beverages Net Return Index
Bezugsverhältnis 1:1
Handelswährung EUR
Verwaltungsgebühr 0.00% p.a.²
Partizipation 100%
Verfall Open End
Emittentin UBS AG, London
Geld-/Briefkurs EUR 1’291.00 / 1’298.00 

Add
 

5.00% p.a. Early Redemption Kick-In GOAL auf Barry Callebaut / EMMI AG / Nestlé

Remove
Symbol KCAODU
SVSP Name Barrier Reverse Convertible
SVSP Code 1230 (Auto-Callable)
Basiswerte Barry Callebaut / EMMI AG / Nestlé
Handelswährung CHF
Coupon 5.00% p.a.
Seitwärtsrendite 13.03% (6.47% p.a.)
Kick-In Level
(Abstand)
Barry Callebaut: CHF 1’041.00 (40.14%)
EMMI AG: CHF 490.50 (39.52%)
Nestlé: CHF 47.94 (47.04%)
Verfall 26.01.2021
Emittentin UBS AG, London
Geld-/Briefkurs 96.10% / 97.10%

Add
 

Weitere Produkte sowie Informationen zu Chancen und Risiken finden Sie unter: ubs.com/keyinvest Quelle: UBS AG Stand: 20.02.2018
 
Marktübersicht
Index Stand Woche¹
SMI™ 9’315.63 Pkt. 1.7%
SLI™ 1’433.77 Pkt. 1.2%
S&P 500™ 2’284.70 Pkt. 1.2%
EURO STOXX 50™ 3’259.49 Pkt. 1.8%
S&P™ BRIC 40 4’180.10 Pkt. 0.0%
CMCI™ Compos. 928.80 Pkt. 2.6%
Gold (Feinunze) 1’347.90 USD 2.5%
Add

SMI™ vs. VSMI™ 1 Jahr

 
¹ Veränderung auf Basis des Schlusskurses des Vortages im Vergleich zum Schlusskurs vor einer Woche.
Der VSMI™ Index wird seit 2005 berechnet. Er zeigt die Volatilität der im SMI™ Index enthaltenen Aktien. Massgeblich für die Berechnung ist ein Portfolio, welches nicht auf Preisschwankungen, sondern ausschliesslich auf Veränderungen der Volatilität reagiert. Dabei greift die VSMI™ Methodik auf die quadrierten Volatilitäten, im Fachjargon „Varianzen“, der an der Eurex gehandelten SMI-Optionen mit einer konstanten Restlaufzeit von 30 Tagen zurück.


Temenos / SAP
Wachstumsstarkes Software-Duo

 
Geht es um das Thema Software, führt an der Cloud längst kein Weg mehr vorbei. Die Daten- und Softwareauslagerung ins Internet erfreut sich einer immer höheren Nachfrage. So konnte SAP sein Cloud-Geschäft in 2018 um 32 Prozent auf 4.99 Milliarden Euro ausbauen. Dass das Wachstum weiter anhält, verrät die Kennzahl „New Cloud Bookings“, die zum Jahresende um ein Viertel zulegte. Auch die Programme von Temenos, bereits 2011 hat das Unternehmen erstmals ein Kernbanking-System in der Wolke gestartet, kommen gut an. Der Spezialist für Bankensoftware steigerte im vergangenen Jahr seine Software-Lizenzeinnahmen um 21 Prozent. Um die Dynamik aufrecht zu halten, haben die Westschweizer Anfang Jahr zwei neue Cloud-Produkte, Temenos Infinity und Temenos T24 Transact, eingeführt. Der in Zeichnung stehende Kick-In GOAL (Symbol: KDEADU) bringt SAP und Temenos als Basiswerte zusammen. Das Duo bietet bei einem Risikopuffer von 40 Prozent eine Ertragschance von 6.00 Prozent p.a.
 
Nicht nur auf der Umsatzseite glänzen die Software-Konzerne, gleichzeitig fahren beide hohe Gewinne ein. Die operative Marge bei SAP belief sich 2018 auf 29 Prozent. Die Ertragskraft soll noch weiter zunehmen. Auf dem Kapitalmarkttag in New York stellte Finanzvorstand Luka Mucic eine Margenverbesserung von Jahr zu Jahr in Aussicht. Vor allem ein verbesserter Umsatzmix soll zu mehr Rentabilität führen. So möchte Mucic beispielsweise im Cloudgeschäft die Bruttomarge von derzeit 63 auf 71 Prozent bis 2020 verbessern. (Quelle: Finanzen.net, Medienbericht, 07.02.2018) Auch bei Temenos soll es weiter aufwärts gehen. Der bisherige COO und Finanzchef Max Chuard, der am 1. März das Ruder bei dem Bankensoftware-Hersteller übernehmen wird, möchte die erfolgreiche Strategie seines Vorgängers David Arnott weiterführen. Mittelfristig rechnet das Unternehmen mit einem Anstieg des Geschäftsvolumens von jährlich zehn bis 15 Prozent. Dabei soll sich auch die Rentabilität um 100 bis 150 Basispunkte p.a. verbessern. 2018 dehnte sich die Ebit-Marge um einen Prozentpunkt auf 31.5 Prozent aus. (Quelle: Temenos, Medienmitteilung, 12.02.2019)
 

Chancen:
Die Aktien von SAP und Temenos bewegen sich seit Jahresbeginn deutlich schneller als der Gesamtmarkt nach oben. Beispielsweise avancierte der Schweizer Mid Cap seit Silvester um 20 Prozent.¹ Für den in Zeichnung stehenden Kick-In GOAL (Symbol: KDEADU) sind weitere Kursaufschläge nicht von Nöten. Das Produkt bietet eine Maximalrendite von 6.00 Prozent p.a. Bedingung hierfür ist, dass keiner der Basiswerte seine bei 60 Prozent der Startwerte fixierte Barriere innerhalb der 18-monatigen Laufzeit berührt oder unterschreitet.

Risiken:
Kick-In GOALs sind nicht kapitalgeschützt. Notiert einer der Basiswerte während der Laufzeit einmal auf oder unter dem jeweiligen Kick-In Level (Barriere), kann die Tilgung am Verfalltag durch Bartilgung entsprechend der (vom Strike aus) schwächsten Performance aus dem Duo erfolgen (höchstens jedoch zum Nominalwert zuzüglich Coupon). In diesem Fall sind Verluste wahrscheinlich. Zudem trägt der Anleger bei strukturierten Produkten das Emittentenrisiko, so dass das eingesetzte Kapital – unabhängig von der Entwicklung des Basiswertes – im Falle einer Insolvenz der UBS AG verloren gehen kann.
Weitere UBS Produkte sowie Informationen zu Chancen und Risiken finden Sie unter ubs.com/keyinvest.
 
Temenos vs. SAP (5 Jahre, nur zu illustrativen Zwecken, Angabe in %)¹
Quelle: UBS AG, BloombergStand: 20.02.2019

 
6.00% p.a. Worst of Kick-In GOAL auf Temenos / SAP
Remove
Symbol KDEADU
SVSP Name Barrier Reverse Convertible
SVSP Code 1230
Basiswerte Temenos / SAP
Handelswährung CHF (Quanto)
Coupon 6.00% p.a.
Strike Level 100%
Kick-In Level (Barriere) 60%
Verfall 31.08.2020
Emittentin UBS AG, London
Zeichnung bis 27.02.2019, 15:00 Uhr

Add
 

Termsheet Weitere Produkte sowie Informationen zu Chancen und Risiken finden Sie unter: ubs.com/keyinvest   Quelle: UBS AG Stand: 20.02.2019

 
¹) Bitte beachten Sie, dass vergangene Wertentwicklungen keine Indikationen für künftige Wertentwicklungen sind.
²) Die Konditionen der ETTs werden jährlich überprüft und können mit einer Frist von 13 Monaten nach Bekanntgabe angepasst werden


Die in diesem Dokument enthaltenen Informationen werden ausschliesslich zu Informations- und Werbezwecken zur Verfügung gestellt und stellen weder Empfehlungen noch Anlageberatung von UBS AG, einer ihrer Tochtergesellschaften oder verbundenen Unternehmen («UBS») dar. Dieses Dokument wird nicht von einer UBS Research Abteilung ausgegeben und ist deshalb nicht als unabhängige Anlageforschung zu erachten. Es stellt weder einen Verkaufsprospekt, noch ein Angebot oder eine Einladung zur Offertenstellung dar, irgendeine Art von Anlage zu tätigen. Beachten Sie bitte, dass die Anlagebeispiele die Ansichten von UBS Research möglicherweise nicht vollständig wiedergeben. Dieses Dokument und die darin beschriebenen Produkte und Dienstleistungen sind allgemeiner Natur und beziehen sich weder auf die persönlichen Anlageziele noch die finanzielle Situation oder besonderen Bedürfnisse eines spezifischen Empfängers. Anlageentscheide sollten stets im Portfoliokontext getroffen werden und Ihre persönliche Situation und Ihre entsprechende Risikobereitschaft und Risikofähigkeit berücksichtigen. Sie werden hiermit auf diese Risiken (die mitunter erheblich sein können) hingewiesen. Bevor Sie einen Anlageentscheid treffen, lesen Sie bitte die spezifischen Produkteinformationen und die Broschüre «Besondere Risiken im Effektenhandel». Bitte kontaktieren Sie Ihren Kundenberater, der Sie gerne bei Ihren Anlageideen unterstützt und Ihnen die spezifischen Produktinformationen zur Verfügung stellt. UBS übernimmt diesbezüglich keinerlei Haftung für das Verhalten von Dritten. Wir weisen Sie darauf hin, dass sich UBS das Recht vorbehält, Dienstleistungen, Produkte und Preise jederzeit ohne vorhergehende Ankündigung zu ändern, und dass sich die wiedergegebenen Informationen und Meinungen jederzeit ändern können. Es wird weder eine ausdrückliche noch stillschweigende Gewährleistung oder Garantie in Bezug auf die Richtigkeit, Vollständigkeit oder Verlässlichkeit der wiedergegebenen Informationen abgegeben, es sei denn, es handelt sich um Informationen, die sich auf die UBS AG beziehen. Zudem stellt dieses Dokument keine umfassende Beschreibung oder Zusammenfassung der genannten Märkte und Entwicklungen dar. Gewisse Zahlen beziehen sich auf vergangene Wertentwicklungen oder stellen simulierte Wertentwicklungen dar und sind somit keine zuverlässigen Indikatoren für künftige Ergebnisse. Bei einigen Zahlen handelt es sich möglicherweise lediglich um Prognosen, und Prognosen sind kein zuverlässiger Indikator für zukünftige Entwicklungen. Gewisse Diagramme und/oder Darstellungen von Wertentwicklungen basieren möglicherweise nicht auf 12-Monate-Perioden, was ihre Vergleichbarkeit und Aussagekraft reduziert. Wechselkurse können sich negativ auf den Wert, den Preis oder die Einnahmen von Produkten und Dienstleistungen auswirken, die in den Materialien genannt werden. Gebühren sind möglicherweise nicht enthalten und reduzieren die Wertentwicklung entsprechend. Die steuerliche Behandlung hängt von den individuellen Umständen jedes Kunden ab und kann sich in Zukunft ändern. UBS erbringt keine Rechts- oder Steuerberatungsdienste und gibt weder allgemeine noch auf die spezifischen Umstände und Bedürfnisse eines Kunden bezogene Erklärungen im Hinblick auf die steuerliche Behandlung von Anlagen oder der damit verbundenen Anlagerenditen ab. Die Empfänger sollten eine unabhängige rechtliche und steuerliche Beratung im Hinblick auf die Auswirkungen der Produkte/Dienstleistungen in der jeweiligen Rechtsordnung sowie die Eignung der Produkte und Dienstleistungen in Anspruch nehmen. UBS, ihre Verwaltungsräte, Geschäftsführer und Mitarbeiter oder Kunden halten oder hielten möglicherweise Anteile oder Hausse- und Baisse-Positionen («Longoder Short-Positionen») an den hierin genannten Wertpapieren oder sonstigen Finanzinstrumenten und können jederzeit als Auftraggeber oder Beauftrage Käufe und/oder Verkäufe tätigen. UBS fungiert oder fungierte möglicherweise als Marktmacher («Market-Maker») bei den Wertpapieren oder sonstigen Finanzinstrumenten. Des Weiteren unterhält oder unterhielt UBS möglicherweise eine Geschäftsbeziehung mit oder erbringt oder erbrachte Investmentbanking-, Kapitalmarktdienstleistungen und/oder sonstige Finanzdienstleistungen für die jeweiligen Unternehmen. Dieses Dokument und die darin enthaltenen Informationen sind ausschliesslich für Personen mit Domizil Schweiz gedacht. Sie dürfen unter keinen Umständen in Rechtsordnungen verbreitet werden, in denen eine solche Verbreitung gegen geltende Gesetze oder Regulierungen verstösst. Sie dürfen insbesondere nicht in den USA und/oder an USPersonen oder in Rechtsordnungen verteilt werden, in denen der Vertrieb durch uns eingeschränkt ist.Die im Dokument enthaltenen Informationen stammen, sofern nicht anders angegeben, von UBS. UBS übernimmt keine Gewährleistung (weder ausdrücklich noch stillschweigend) für Richtigkeit, Vollständigkeit und Aktualität der Informationen. Sie können jederzeit und ohne vorherige Ankündigung geändert werden. UBS ist nicht verpflichtet, die hierin enthaltenen Informationen zu aktualisieren oder auf dem neuesten Stand zu halten.Das vorliegende Material beinhaltet Daten, welche aus dem Backtesting von Daten resultieren, und wurde von UBS in gutem Glauben und unter Anwendung standardisierter Methoden erstellt. Diese Methoden basieren auf eigenen Modellen, empirischen Daten, Annahmen und anderen Informationen, die wir für korrekt und angemessen erachten. Gewisse Links führen zu Websites Dritter. Diese sind dem Einfluss der UBS vollständig entzogen, weshalb UBS für Richtigkeit, Vollständigkeit und Rechtmässigkeit des Inhalts solcher Websites sowie für darauf enthaltene Angebote und (Dienst-) Leistungen keinerlei Verantwortung übernimmt.Für gewisse Dienstleistungen und Produkte gelten gesetzliche Bestimmungen. Diese Dienstleistungen und Produkte können daher nicht weltweit uneingeschränkt angeboten werden.Hinweise zu den Grafiken: Nur für Illustrationszwecke. Vergangene Performance ist kein zuverlässiger Indikator für die künftige Performance. © UBS 2017. Das Schlüsselsymbol und UBS gehören zu den eingetragenen und nicht eingetragenen Markenzeichen von UBS. Alle Rechte bleiben vorbehalten.  Der SMI™ Index sowie entsprechende Marken und der SLI™ Index sowie entsprechende Marken und der der Swiss Performance Index™ Index (SPITM) sowie entsprechende Marken und der VSMI™ sowie entsprechende Marken sind Eigentum der SIX Swiss Exchange AG. Alle Rechte vorbehalten. Der S&P 500™ Index sowie entsprechende Marken und der S&P 500 Industrials Index™ sowie entsprechende Marken sind Eigentum der Standard & Poor›s Financial Services LLC. Alle Rechte vorbehalten. Der Euro STOXX 50™ Index sowie entsprechende Marken und der STOXX Europe 600 Banks Index sowie entsprechende Marken sind Eigentum der Stoxx AG. Alle Rechte vorbehalten. Der CMCI™ Composite Index sowie entsprechende Marken sind Eigentum der UBS AG. Alle Rechte vorbehalten. Der DAX™ Index sowie entsprechende Marken sind Eigentum der Deutsche Börse AG. Alle Rechte vorbehalten. Der JPM™ German Government Bond Index sowie entsprechende Marken sind Eigentum der JPM International Limited. Alle Rechte vorbehalten. Der NIKKEI 225™ Index sowie entsprechende Marken sind Eigentum der Nihon Keizai Shimbun Incorporation. Alle Rechte vorbehalten. Der EPRA Index™ sowie entsprechende Marken sind Eigentum der European Public Real Estate Association. Alle Rechte vorbehalten. Der FTSE™ Index sowie entsprechende Marken sind Eigentum der London Stock Exchange Group Holdings Limited. Alle Rechte vorbehalten. Der MSCI™ World Index sowie entsprechende Marken sind Eigentum der MSCI Incorporation. Alle Rechte vorbehalten. Der KOSPI™ Index sowie entsprechende Marken sind Eigentum der Korea Exchange Incorporation. Alle Rechte vorbehalten. Der HSCEI™ Index, der Hang Seng China EnterprisesTM Index sowie entsprechende Marken sind Eigentum der Hang Seng Data Services Limited. Alle Rechte vorbehalten.

Weekly Hits: Nahrungsmittelsektor, SAP & Temenos2019-02-21T09:23:51+01:00

Weekly Hits: Assureurs européens, Spotify & Twitter

KeyInvest Weekly Hits

Vendredi, 15.02.2019

  • Thème 1: Assureurs européens - Une saison des bilans de bon augure
  • Thème 2: Spotify / Twitter - Un duo d’une très grande portée

Assureurs européens
Une saison des bilans de bon augure

Alors que la saison des bilans bat son plein, le secteur des assurances entre dans la danse à son tour. Premier groupe d’assurance en Suisse, Zurich Insurance a publié ses résultats pour l’exercice écoulé. En Allemagne, le groupe munichois Münchener Rück s’est imposé comme chef de file. Les deux entités ont présenté des bilans irréprochables et sont parvenues à dépasser les attentes des analystes. L’évolution positive de leurs opérations se reflète également dans le cours de leurs actions. Sur une rétrospective d’un an, non seulement le duo caracole largement en tête du marché dans son ensemble, mais l’action de la Münchener Rück a même atteint un plus haut historique et l’action de Zurich Insurance n’en est pas loin.¹ L’ETT (symbole : ETINS) sur le STOXX™ Europe 600 Insurance Index permet de participer pleinement et de manière très diversifiée aux opportunités qu’offre la branche.²
De son côté, le Kick-In GOAL (symbole : KCNGDU) sur Zurich Insurance offre une opportunité d’entrée aux investisseurs préférant une approche conservatrice. Ce produit structuré laisse entrevoir un rendement de 9,4% même en cas de stagnation des cours.

Les chiffres de Zurich Assurance pour l’exercice écoulé sont remarquables : le groupe a enregistré un bénéfice net de 3,72 milliards de dollars américains, dépassant ainsi les prévisions les plus optimistes des analystes qui avaient tablé sur 3,56 milliards de dollars américains. De même, à 4,57 milliards de dollars américains, le résultat opérationnel est ressorti largement au-dessus de l’estimation consensuelle. Mario Greco, directeur général de Zurich Insurance, commente ces bons résultats en expliquant que le groupe a continué d’accroître sa rentabilité et de baisser ses coûts. (Source : Zurich Insurance, communiqué de presse, 07.02.2019) Zurich Insurance maintient ses objectifs : entre 2017 et 2019, le groupe vise un bénéfice d’exploitation après impôts de plus 12% du capital. L’an passé, il s’est élevé à 12,1%. Les actionnaires doivent également participer au succès. Pour 2018, la direction a proposé un dividende de 19 francs par action, ce qui représente un franc de plus que l’année précédente.

Son homologue allemand, Münchener Rück, a également revu sa distribution à la hausse après des résultats annuels très satisfaisants. Le premier réassureur mondial a réalisé un bénéfice net de tout juste 2,3 milliards d’euros contre seulement 0,4 milliard d’euros l’année précédente. Les actionnaires seront ravis de percevoir un dividende de 9,25 euros par action, soit une hausse de 7,5%.
Nous verrons dans les jours et semaines à venir si les autres groupes d’assurance européens parviennent à égaler Zurich Insurance et Münchener Rück. Par exemple, Swiss Re et Axa publieront leurs comptes le 21 février, suivis par Swiss Life le 26 février et par Baloise le 7 mars. À court terme, le bilan le plus attendu est celui d’Allianz. Le premier groupe d’assurance européen communiquera ses résultats le 15 février. Selon certaines informations émanant de Thomson Reuters, les analystes misent sur une hausse du résultat par action de 15,9% qui atteindra ainsi 17,65 euros par action. Dans l’ensemble, l’assureur allemand peut se préparer à une belle année 2019. L’Association des Assureurs allemands (Gesamtverband der Deutschen Versicherungswirtschaft ou GDV) attend une nouvelle hausse des primes d’environ 2%.

Opportunités: Avec le ETT (symbole : ETINS) sur le STOXX™ Europe 600 Insurance Index, les investisseurs peuvent choisir un placement diversifié dans le secteur. Le produit se présente sans commission de gestion et participe à l’identique au sous-jacent.² L’indice est composé de 35 sociétés, le rendement en dividendes s’élève à 4,3%. Les distributions sont prises en compte sur une base nette. Le Callable Worst of Kick-In GOAL (symbole : KCNGDU) sur Zurich Insurance propose en revanche un placement partiellement couvert dans le secteur des assurances. Le produit offre un rendement latéral de 9,4% avec une marge de sécurité de 27,4%.

Risques: il n’existe aucune protection du capital pour les produits. Une évolution négative de l’actif sous-jacent entraîne des pertes correspondantes pour l’ETT. En revanche, les Worst of Kick-In GOALs bénéficient d’une protection du capital sous conditions. Si pendant la durée de l’investissement le sous-jacent atteint ou franchit une seule fois le Kick-In Level (barrière) et qu’en plus la fonction Callable ne s’applique pas, la cote du sous-jacent doit remonter au moins au niveau du Strike Level à l’échéance. Dans le cas contraire, le remboursement s’effectuera sous la forme d’un nombre d’actions déterminé à l’avance. Par ailleurs, avec les produits structurés, l’investisseur supporte le risque d’émetteur. Cela signifie qu’en cas d’insolvabilité d’UBS SA, le capital investi peut être perdu, indépendamment de l’évolution du sous-jacent.

Vous trouverez davantage de produits UBS et des informations sur les opportunités et les risques à l’adresse ubs.com/keyinvest.

STOXX™ Europe 600 Insurance Index (5 ans)

La tendance haussière observée entre 2016 et 2018 a adopté une tendance latérale dans le domaine des 600 points. Au total, l’indice sectoriel enregistre une performance positive sur cinq ans.

Source: UBS AG, Bloomberg

Valeurs du: 13.02.2019

Zurich Insurance vs. SMI™
(5 ans, aux fins d’illustration uniquement, données en %)¹

L’action Zurich Insurance a fluctué ces dernières années. Même lorsque le titre subissait des variations plus fortes que l’ensemble du marché, il s’en sortait au final mieux que le SMI™.

Source: UBS AG, Bloomberg

Valeurs du: 13.02.2019

¹) La performance passée n’indique pas les résultats futures.
²) Les condition des ETTs sont vérifiés annuellement et peuvent être ajustées avec un délai de 13 mois après la publication.

ETT sur STOXX™ Europe 600 Insurance Index

Symbol ETINS
SVSP Name Tracker Certifikat
SVSP Code 1300
Sous-jacent STOXX™ Europe 600 Insurance Net Return Index
Devise EUR
Rapport de souscription 1:1
Frais de gestion 0.00% p.a.²
Participation 100%
Echéance Open End
Émetteur UBS AG, London
Bid/Ask EUR 600.50 / 604.00
 

5.00% p.a. Callable Kick-In GOAL sur Zurich Insurance

Symbol KCNGDU
SVSP Name Barrier Reverse Convertible
SPVSP Code 1230 (Callable)
Sous-jacent Zurich Insurance
Devise CHF
Coupon 5.00% p.a.
Rendement latéraux 9.38% / 5.55% p.a.
Kick-In Level (Distance) CHF 231.825 (27.55%)
Echéance 05.10.2020
Émetteur UBS AG, London
Bid/Ask 97.95% / 98.95%
 

Vous trouverez davantage de produits UBS et des informations sur les opportunités et les risques à l’adresse ubs.com/keyinvest.

Source: UBS AG, Bloomberg

Valeurs du: 13.02.2019

Apérçu du marché

Index Citation Semaine¹
SMI™ 9’164.06 0.2%
SLI™ 1’417.38 0.1%
S&P 500™ 2’753.03 0.8%
Euro STOXX 50™ 3’202.37 -0.3%
S&P™ BRIC 40 4’178.84 0.0%
CMCI™ Compos. 905.13 -0.9%
Gold (troy ounce) 1’315.10 USD 0.1%

¹ Changement basé sur le cours de clôture du jour précédent par rapport au cours de clôture de la semaine dernière.

SMI™ vs. VSMI™ 1 année

L’index VSMI™ est calculé depuis 2005. Il affiche la volatilité des actions inclus dans le SMI™ index. Pour la calculation, un portefeuille est utilisé qui ne réagit qu’au variations de la volatilité au lieu des variations des prix. En le faisant, la méthodologie du VSMI™ utilise la volatilité carré, connu sous le terme variance, des options sur le SMI avec 30 jours jusqu’à l’échéance négociées à la Bourse Eurex.

Source: UBS AG, Bloomberg

Valeurs du: 13.02.2019

Spotify / Twitter
Un duo d’une très grande portée

Qu’il s’agisse d’écouter de la musique en allant au travail ou d’écrire rapidement un tweet le soir, nombreux sont ceux qui ont intégré Spotify et Twitter dans leur quotidien. À la fin 2018, le prestataire de streaming et le service de messages courts comptaient à eux deux plus de 500 millions d’utilisateurs actifs. Ce duo constitue également une base intéressante pour un Early Redemption (ER) Kick-In GOAL (symbole : KCTLDU). Ce produit promet un rendement latéral de 14,5% p.a. Bien que les deux actions aient cédé du terrain depuis son émission en novembre 2018, Twitter dispose encore d’une marge de sécurité de plus de 40% malgré son statut actuel de «Worst Performer».

À l’instar d’un grand nombre d’actions Internet, Spotify et Twitter ont démarré l’année en fanfare.¹ Le duo a toutefois subi une accalmie après que les deux entreprises ont publié leurs résultats. À cet égard, Spotify a pour la première fois enregistré un bénéfice trimestriel pour ses opérations – alors que les analystes pensaient que l’entreprise continuerait d’évoluer dans le rouge. Avec une croissance de 30%, la plateforme de musique a réussi à satisfaire quelque peu les attentes en termes de chiffre d’affaires pour le dernier trimestre 2018, mais les investisseurs ont manifestement été contrariés par les perspectives en provenance de Suède. En effet, Spotify prévoit entre autres un recul de sa brute marge pour 2019. (Source : Thomson Reuters, article de presse, 06.02.2019)

Twitter a finalement présenté un cas de figure similaire. Le service de messages courts américain a divulgué de solides résultats pour le quatrième trimestre 2019, avec une croissance de son chiffre d’affaires de 24%, notamment grâce à la hausse des revenus dans ses activités avec des publicités vidéo. En parallèle, l’entreprise de médias sociaux a gagné plus que ce que le consensus attendait. Mais la direction de Twitter a également déçu les investisseurs en laissant entrevoir des chiffres d’affaires entre 715 millions et 775 millions de dollars américains pour le premier trimestre 2019. Le point central de cette fourchette se situe en dessous des volumes d’affaires attendus en moyenne par les analystes auparavant. (Source : Thomson Reuters, article de presse, 07.02.2019)

Opportunités: Le ER Kick-In GOAL (symbole : KCTLDU) offre une alternative à un investissement direct dans Spotify et Twitter. Tant qu’aucune des deux actions n’atteindra ou ne passera en dessous de la barrière, le produit structuré produira à l’échéance le rendement maximal de 14,5% p.a. Actuellement, les sous-jacents évoluent plus de 40% au-dessus du Kick-In Level. La fonction Early Redemption sera utilisée pour la première fois le 7 novembre 2019. Si la cote de Spotify et de Twitter atteint ou dépasse le cours initial lors de ce jour d’observation trimestrielle ou lors d’un des suivants, le Kick-In GOAL sera exigible avant terme. Dans ce cas, les investisseurs recevront quelques jours plus tard un virement comprenant l’intégralité du nominal ainsi que le pro rata du coupon sur leur compte.

Risques: les Kick-In GOALs ne bénéficient d’aucune protection du capital. Si, pendant la durée de l’investissement, l’un des sous-jacents atteint une seule fois la barrière respective («Kick-In Level») ou est inférieur à celle-ci, et que la fonction de remboursement anticipé ne s’applique pas, le remboursement par amortissement en espèces à l’échéance est basé sur la performance la plus faible (base Strike) du duo (au maximum toutefois à la valeur nominale majorée du coupon). Dans un tel cas, des pertes sont probables. Par ailleurs, avec les produits structurés, l’investisseur supporte le risque d’émetteur. Cela signifie qu’en cas d’insolvabilité d’UBS SA, le capital investi peut être perdu, indépendamment de l’évolution du sous-jacent.

Vous trouverez davantage de produits UBS et des informations sur les opportunités et les risques à l’adresse ubs.com/keyinvest.

Spotify Technology vs. Twitter
(depuis l’introduction en bourse de Spotify, aux fins d’illustration uniquement, données en %)¹

Source: UBS AG, Bloomberg

Valeurs du: 13.02.2019

12.00% p.a. Early Redemption Kick-In GOAL sur Spotify Technology / Twitter

Symbol KCTLDU
SVSP Name Barrier Reverse Convertible
SPVSP Code 1230 (Auto-Callable)
Sous-jacent Spotify Technology / Twitter
Devise USD
Coupon 12.00% p.a.
Rendement latéraux 16.29% (12.84% p.a.)
Kick-In Level (Distance)
Spotify: USD 72.885 (49.22%)
Twitter: USD 17.495 (43.78%)
Echéance 08.05.2020
Émetteur UBS AG, London
Bid/Ask 97.50% / 98.50%
 

Vous trouverez davantage de produits UBS et des informations sur les opportunités et les risques à l’adresse ubs.com/keyinvest.

Source: UBS AG, Bloomberg

Valeurs du: 13.02.2019

¹) La performance passée n’indique pas les résultats futures.
²) Les condition des ETTs sont vérifiés annuellement et peuvent être ajustées avec un délai de 13 mois après la publication.

This material has been prepared by UBS AG or one of its affiliates («UBS»). This material is for distribution only as permitted by law. It is not prepared for the needs of any specific recipient. It is published solely for information and is not a solicitation or offer to buy or sell any securities or related financial instruments (“Instruments”). UBS makes no representation or warranty, either express or implied, on the completeness or reliability of the information contained in this document (“Information”) except that concerning UBS AG and its affiliates. The Information should not be regarded by recipients as a substitute for using their own judgment. Any opinions expressed in this material may change without notice and may be contrary to opinions expressed by other business areas of UBS as a result of using different assumptions or criteria. UBS is under no obligation to update the Information. UBS, its officers, employees or clients may have or have had an interest in the Instruments and may at any time transact in them. UBS may have or have had a relationship with entities referred to in the Information. Neither UBS nor any of its affiliates, or their officers or employees, accepts any liability for any loss arising from use of the Information. This presentation is not a basis for entering into a transaction. Any transaction between you and UBS will be subject to the detailed provisions of the term sheet, confirmation or electronic matching systems relating to that transaction. Clients wishing to effect transactions should contact their local sales representative.
This information is communicated by UBS AG and/or its affiliates («UBS»). * (see below) UBS may from time to time, as principal or agent, have positions in, or may buy or sell, or make a market in any securities, currencies, financial instruments or other assets underlying the product to which this website relates (the «Structured Product»). UBS may provide investment banking and other services to and/or have officers who serve as directors of the companies referred to in this website. UBS’s trading and/or hedging activities related to the Structured Product may have an impact on the price of the underlying asset and may affect the likelihood that any relevant barrier or relevant trigger event is crossed or triggered. UBS has policies and procedures designed to minimise the risk that officers and employees are influenced by any conflicting interest or duty and that confidential information is improperly disclosed or made available. UBS may pay or receive brokerage or retrocession fees in connection with the Structured Product described herein. In respect of any Structured Product that is a security, UBS may, in certain circumstances, sell the Structured Product to dealers and other financial institutions at a discount to the issue price or rebate to them for their own account some proportion of the issue price. Further information is available on request. Structured Products are complex and may involve a high risk of loss. Prior to purchasing the Structured Product you should consult with your own legal, regulatory, tax, financial and accounting advisors to the extent you consider it necessary, and make your own investment, hedging and trading decisions (including decisions regarding the suitability of the Structured Product) based upon your own judgement and advice from those advisers you consider necessary. Save as otherwise expressly agreed in writing, UBS is not acting as your financial adviser or fiduciary in relation to the Product. UBS generally hedges its exposure to Structured Products, although it may elect not to hedge or to partially hedge any Structured Product. UBS’s hedging activity may be conducted through transactions in the underlying asset, index or instrument or in options, futures or other derivatives related to the underlying asset, index or instrument on publicly traded markets or otherwise, and may have an impact on the price of the under-lying asset. If a transaction is cash settled, UBS will generally unwind or offset any hedge it has for such Structured Product in close proximity to the relevant valuation time or period. In some cases, this activity may affect the value of the Structured Product. Unless stated otherwise in this document, (i) this document is for information purposes only and should not be construed as an offer, personal recommendation or solicitation to purchase the Structured Product and should not be treated as giving investment advice, and (ii) the terms of any investment in the Structured Product will be exclusively subject to the detailed provisions, including risk considerations, contained in the more detailed legal documentation that relates to the Structured Product (being the confirmation, information memorandum, prospectus or other issuer documentation as relevant). UBS makes no representation or warranty relating to any information herein which is derived from independent sources. This document shall not be copied or reproduced without UBS’s prior written permission. In respect of any Structured Product that is a security, no action has been or will be taken in any jurisdiction that would permit a public offering of the Product, save where explicitly stated in the issuer documentation. The Structured Product must be sold in accordance with all applicable selling restrictions in the jurisdictions in which it is sold.
© UBS 2018. All rights reserved. UBS prohibits the forwarding of this information without the approval of UBS.
Weekly Hits: Assureurs européens, Spotify & Twitter2019-02-15T11:58:05+01:00

Weekly Hits: European Insurers, Spotify & Twitter

KeyInvest Weekly Hits

Friday, 15.02.2019

  • Topic 1: European Insurers - A good start into the reporting season
  • Topic 2: Spotify and Twitter - Two platforms with tremendous reach

European Insurers
A good start into the reporting season

The insurance industry has now entered the latest financial reporting season too. Zurich Insurance was the first Swiss insurance company to release its figures for the last fiscal year, while in Germany Munich Re was the frontrunner. Both companies presented squeaky clean balance sheets and exceeded analysts› expectations, and their strong operating profits are reflected in the share prices. The pair is ahead of the market average for the year, and Munich Re shares have just reached an all-time high, while Zurich shares are within sight of the mark.¹ The ETT tracker certificate (symbol: ETINS) for the STOXX™ Europe 600 Insurance Index allows full participation in the growth of the industry with broad diversification.² The Kick-In GOAL (Symbol: KCNGDU) on Zurich Insurance gives conservative investors an opportunity to take a position in the market. A 9.4 percent return is possible with this structured product even if prices move sideways.

Zurich Insurance recorded impressive full-year results with a net profit of USD 3.72 billion that exceeded the highest analyst estimate of USD 3.56 billion. The reported operating profit of 4.57 billion US dollars was also significantly above the consensus estimate. «We have further increased profitability and lowered costs,» said Zurich Chief Executive Mario Greco, commenting on the company’s good numbers. (Source: Zurich Insurance press release of February 2, 2019) Zurich’s goals remain unchanged, as the Group is striving for an after-tax operating profit for the years 2017 – 2019 representing more than twelve percent return on capital. For last year, this figure was 12.1 percent. And shareholders should profit from this success, as for 2018 the Executive Board has proposed a dividend of 19 Swiss francs per share, which is one franc higher than last year.

Munich Re is increasing its dividend as well after announcing good results: For 2018 the world’s largest reinsurer recorded a net profit of approximately 2.3 billion euros, coming after a mere 0.4 billion euros for the previous year. Shareholders can look forward to a 7.5 percent dividend increase, up to 9.25 euros per share.
Over the next few weeks we will find out how many other European insurers will be able to keep pace with Zurich Insurance and Munich Re. Swiss Re and AXA, for example, will be releasing their books on February 21, followed by Swiss Life on February 26 and Baloise on March 7. The greatest anticipation swirls around Allianz: Europe’s largest insurance group will be releasing its figures on February 15. According to Thomson Reuters, analysts are expecting a 15.9 percent rise in earnings per share to 17.65 euros. The German insurance industry can expect 2019 to be a good year overall, the German Insurance Association GDV is projecting premiums to further increase by roughly two percent.

Opportunities: The ETT tracker certificate on the STOXX™ Europe 600 Insurance Index (symbol: ETINS) affords investors a diversified investment opportunity in the industry. This product has no annual management fee, thus tracking the performance of the underlying index exactly.² The index is comprised of 35 stocks; the dividend yield is 4.3 percent. Distributions are accounted on a net basis. The Callable Worst of Kick-In GOAL (symbol: KCNGDU) on Zurich Insurance is a partially protected vehicle for investment in the insurance industry. The product features a risk buffer of 27.4 percent and a sideways yield of 9.4 percent.

Risks: The products are not capital-protected investments. Negative performance of the underlying stock results in corresponding loss in value for the ETT. In contrast, Worst of Kick-In GOALs do offer contingent capital protection. If the underlying is quoted at or below the kick-in level (barrier) once during the product term and the callable function is not triggered, the underlying has to at least trade back at the strike level by the expiration date. If not, payout takes place in the form of delivery of a fixed number of shares. In addition, the investor bears issuer risk with structured products, which means capital invested may be lost if UBS AG should go bankrupt, regardless of the performance of the underlying.

More UBS products and further information on the risks and opportunities are available at ubs.com/keyinvest.

STOXX™ Europe 600 Insurance Index (5 years)

The uptrend that lasted from 2016 to 2018 gave way to sideway trading in the 600 point range. The sector index’s bottom-line performance has been good over a five-year period.

Source: UBS AG, Bloomberg

As of 13.02.2019

Zurich Insurance vs. SMI™
(five years, for illustrative purposes only, figures in %)¹

Zurich Insurance shares have traded up and down in recent years. The stock has been slightly more volatile than the overall market, but has ultimately performed the SMI™.

Source: UBS AG, Bloomberg

As of: 13.02.2019

¹) Please be aware that past performance does not indicate future results.
²) The conditions of ETTs are reviewed on a yearly basis and can be adjusted with a deadline of 13 months after the announcement.

ETT on STOXX™ Europe 600 Insurance Index

Symbol ETINS
SVSP Name Tracker Certificates
SPVSP Code 1300
Underlying STOXX™ Europe 600 Insurance Net Return Index
Currency EUR
Ratio 1:1
Administration fee 0.00% p.a.²
Expiry Open End
Participation 100%
Issuer UBS AG, London
Bid/Ask EUR 600.50 / 604.00
 

5.00% p.a. Callable Kick-In GOAL on Zurich Insurance

Symbol KCNGDU
SVSP Name Barrier Reverse Convertible
SPVSP Code 1230 (Callable)
Underlying Zurich Insurance
Currency CHF
Coupon 5.00% p.a.
Sideways return 9.38% / 5.55% p.a.
Kick-In Level (Distance) CHF 231.825 (27.55%)
Sideways return 9.38% / 5.55% p.a.
Expiry 05.10.2020
Issuer UBS AG, London
Bid/Ask 97.95% / 98.95%
 

More UBS products and further information on the risks and opportunities are available at ubs.com/keyinvest.

Source: UBS AG, Bloomberg

As of: 13.02.2019

Market overview

Index Quotation Week¹
SMI™ 9’164.06 0.2%
SLI™ 1’417.38 0.1%
S&P 500™ 2’753.03 0.8%
Euro STOXX 50™ 3’202.37 -0.3%
S&P™ BRIC 40 4’178.84 0.0%
CMCI™ Compos. 905.13 -0.9%
Gold (troy ounce) 1’315.10 USD 0.1%

¹ Change based on the closing price of the previous day compared to the closing price a week ago.

SMI™ vs. VSMI™ 1 year

smi vs vsmi

The VSMI™ Index is calculated since 2005. It shows the volatility of the stocks within the SMI™ index. A portfolio which reacts only to changes in volatility instead of volatility itself is relevant for the calculation. Thereby, the VSMI™ methodology uses the squared volatility, known as variance, of the SMI options with remaining time to expiry of 30 days traded at the Eurex.

Source: UBS AG, Bloomberg

As of: 13.02.2019

Spotify and Twitter
Two platforms with tremendous reach

Whether listening to music on the way to work or popping off a quick tweet in the evening – for many people, Spotify and Twitter are an integral part of everyday life. Together the streaming provider and short message service had more than half a billion active users at the end of 2018. The two make for an interesting Early Redemption (ER) Kick-In GOAL product too (symbol: KCTLDU). This product offers a potential sideways annualized yield of 14.5 percent p.a. Both stocks have declined since their IPOs in November 2018, the current worst-performer of the two, Twitter, still has a safety buffer of more than 40 percent.

Spotify, Twitter and many other internet stocks got off to a strong start to the year¹, but the two lost momentum after releasing their financials. Spotify announced recording an operating profit for the first quarter ever despite analysts expecting the company to remain in the red. Growing at a rate of 30 percent, the music platform managed to roughly meet sales expectations for the period October to December 2018. Investors were apparently concerned about the outlook for this Swedish company, as Spotify is forecasting declining gross margin for 2019 among other things. (Source: Thomson Reuters Media Report, February 6, 2019)

The US short message service Twitter has recently found itself in a similar situation, reporting strong figures for the fourth quarter of 2019, partly on rising video advertising income, which contributed to a 24 percent increase in sales. The social media company reported better-than-expected earnings as well, yet investors were still disappointed about the outlook for Twitter. For the first quarter of 2019 management estimates sales will range between 715 and 775 million US dollars, the mid-point of which is below the average sales previously projected by analysts. (Source: Thomson Reuters Media Report, 2/7/2019)

Opportunities: The ER Kick-In GOAL is an alternative option to directly investing in Spotify and Twitter (symbol: KCTLDU). As long as neither of the stocks falls to or below their respective barrier, the structured product can afford an annualized yield of up to 14.5 percent at maturity. The underlying stocks are currently trading more than 40 percent above the kick-in level. The first possible early redemption is on November 7, 2019. If Spotify and Twitter trade at or above the starting level on this day or any other quarterly observation day, the Kick-in GOAL expires early. In such case, investors will receive the full nominal amount plus pro rata coupon transferred to their account a few days later.

Risks: Kick-In GOALs are not capital-protected investments. If one of the underlyings trades at or below the applicable kick-in level (barrier) during the product term and the early redemption feature cannot apply, the product may be redeemed on the expiry date in cash based on the price of the weaker performing of the two (relative to the strike, not to exceed nominal value plus coupon). Losses are likely in such case. In addition, investors in structured products bear issuer risk, which means capital invested may be lost if UBS AG should go bankrupt, regardless of the performance of the underlying.

More UBS products and further information on the risks and opportunities are available at ubs.com/keyinvest.

Spotify Technology vs. Twitter
(since Spotify IPO, for illustrative purposes only; figures in %)¹

Source: UBS AG, Bloomberg

As of: 13.02.2019

12.00% p.a. Early Redemption Kick-In GOAL on Spotify Technology / Twitter

Symbol KCTLDU
SVSP Name Barrier Reverse Convertibles
SPVSP Code 1230 (Auto-Callable)
Underlyings Spotify Technology / Twitter
Currency USD
Coupon 12.00% p.a.
Sideways return 16.29% (12.84% p.a.)
Kick-In Level (Distance)
Spotify: USD 72.885 (49.22%)
Twitter: USD 17.495 (43.78%)
Expiry 08.05.2020
Issuer UBS AG, London
Bid/Ask 97.50% / 98.50%
 

More UBS products and further information on the risks and opportunities are available at ubs.com/keyinvest.

Source: UBS AG, Bloomberg

As of: 13.02.2019

¹) Please be aware that past performance does not indicate future results.
²) The conditions of ETTs are reviewed on a yearly basis and can be adjusted with a deadline of 13 months after the announcement.

This material has been prepared by UBS AG or one of its affiliates («UBS»). This material is for distribution only as permitted by law. It is not prepared for the needs of any specific recipient. It is published solely for information and is not a solicitation or offer to buy or sell any securities or related financial instruments (“Instruments”). UBS makes no representation or warranty, either express or implied, on the completeness or reliability of the information contained in this document (“Information”) except that concerning UBS AG and its affiliates. The Information should not be regarded by recipients as a substitute for using their own judgment. Any opinions expressed in this material may change without notice and may be contrary to opinions expressed by other business areas of UBS as a result of using different assumptions or criteria. UBS is under no obligation to update the Information. UBS, its officers, employees or clients may have or have had an interest in the Instruments and may at any time transact in them. UBS may have or have had a relationship with entities referred to in the Information. Neither UBS nor any of its affiliates, or their officers or employees, accepts any liability for any loss arising from use of the Information. This presentation is not a basis for entering into a transaction. Any transaction between you and UBS will be subject to the detailed provisions of the term sheet, confirmation or electronic matching systems relating to that transaction. Clients wishing to effect transactions should contact their local sales representative.
This information is communicated by UBS AG and/or its affiliates («UBS»). * (see below) UBS may from time to time, as principal or agent, have positions in, or may buy or sell, or make a market in any securities, currencies, financial instruments or other assets underlying the product to which this website relates (the «Structured Product»). UBS may provide investment banking and other services to and/or have officers who serve as directors of the companies referred to in this website. UBS’s trading and/or hedging activities related to the Structured Product may have an impact on the price of the underlying asset and may affect the likelihood that any relevant barrier or relevant trigger event is crossed or triggered. UBS has policies and procedures designed to minimise the risk that officers and employees are influenced by any conflicting interest or duty and that confidential information is improperly disclosed or made available. UBS may pay or receive brokerage or retrocession fees in connection with the Structured Product described herein. In respect of any Structured Product that is a security, UBS may, in certain circumstances, sell the Structured Product to dealers and other financial institutions at a discount to the issue price or rebate to them for their own account some proportion of the issue price. Further information is available on request. Structured Products are complex and may involve a high risk of loss. Prior to purchasing the Structured Product you should consult with your own legal, regulatory, tax, financial and accounting advisors to the extent you consider it necessary, and make your own investment, hedging and trading decisions (including decisions regarding the suitability of the Structured Product) based upon your own judgement and advice from those advisers you consider necessary. Save as otherwise expressly agreed in writing, UBS is not acting as your financial adviser or fiduciary in relation to the Product. UBS generally hedges its exposure to Structured Products, although it may elect not to hedge or to partially hedge any Structured Product. UBS’s hedging activity may be conducted through transactions in the underlying asset, index or instrument or in options, futures or other derivatives related to the underlying asset, index or instrument on publicly traded markets or otherwise, and may have an impact on the price of the under-lying asset. If a transaction is cash settled, UBS will generally unwind or offset any hedge it has for such Structured Product in close proximity to the relevant valuation time or period. In some cases, this activity may affect the value of the Structured Product. Unless stated otherwise in this document, (i) this document is for information purposes only and should not be construed as an offer, personal recommendation or solicitation to purchase the Structured Product and should not be treated as giving investment advice, and (ii) the terms of any investment in the Structured Product will be exclusively subject to the detailed provisions, including risk considerations, contained in the more detailed legal documentation that relates to the Structured Product (being the confirmation, information memorandum, prospectus or other issuer documentation as relevant). UBS makes no representation or warranty relating to any information herein which is derived from independent sources. This document shall not be copied or reproduced without UBS’s prior written permission. In respect of any Structured Product that is a security, no action has been or will be taken in any jurisdiction that would permit a public offering of the Product, save where explicitly stated in the issuer documentation. The Structured Product must be sold in accordance with all applicable selling restrictions in the jurisdictions in which it is sold.
© UBS 2018. All rights reserved. UBS prohibits the forwarding of this information without the approval of UBS.
Weekly Hits: European Insurers, Spotify & Twitter2019-02-15T12:00:25+01:00
Go to Top