About ubs-ch

This author has not yet filled in any details.
So far ubs-ch has created 384 blog entries.

Weekly Hits: Dividend strategy & Tesla

KeyInvest Weekly Hits

Friday, 08.02.2019

  • Topic 1: Dividend strategy - The harvest can be brought in
  • Topic 2: Tesla - Profits rolling off the production line

Dividend strategy
The harvest can be brought in

While the turnaround of interest rates in the US is stagnating, there is still no sign of an end to the ultra-loose monetary policy here in Switzerland – the yields achievable on the CHF bond market are correspondingly poor. In strong contrast to this, the dividend yield of just over 3% being generated on the Swiss equity market is quite impressive. UBS CIO GWM believes that this discrepancy is an interesting proposition for investors in the medium term, particularly for those investors who focus on companies with high-quality distributions. This is exactly where the Dow Jones Switzerland Select Dividend 15 Index™ comes in. This benchmark systematically searches the domestic equity market for attractive dividend stocks. On the other hand, the UBS Global Quality Dividend Payers Total Return Index takes a global approach. Open End PERLES offer simple and cost-effective access to both strategies. The product (symbol: SWDIV) focusing on domestic stocks is denominated in Swiss francs, while the UBS Global Quality Dividend Payers Index is available in Swiss francs (symbol: DIVQC), euros (symbol: DIVQE) and US dollars (symbol: DIVQD).

According to UBS CIO GWM, Swiss companies currently have historically low levels of debt and are robustly profitable. Although the number of mergers and acquisitions is increasing both on a national and global level, experts are acting on the assumption that distribution rates will continue to remain high. According to CIO GWM, sustainability and the distribution yields are just some of the objective and common criteria in the search for attractive dividend stocks. In contrast, dividend growth is sometimes overlooked. However, analysts believe that companies that show high yields but lag behind in terms of profit and dividend growth are likely to underperform, especially in the current environment (Source: UBS CIO GWM, “Swiss high-quality dividends”, Equities, January 21, 2019).

With the Dow Jones Switzerland Select Dividend 15 Index™, dividend growth is one of the key selection criteria. This strategy examines profit sharing over a period of three years, with dividend yields and the return on equity also playing an important role, in addition to other parameters such as trading liquidity. The UBS Global Quality Dividend Payers Index takes an extremely similar approach, albeit with one major difference – UBS Research is responsible for the composition of the index. Every quarter, the analysts filter 30 value stocks out of an international universe of more than 3,300 equities. This evaluation takes into consideration both the interest rate applied to the distribution as well as the return on equity. The experts also focus on equities with sustainable revenue and earnings growth. In addition, the experts ensure that there is healthy diversification within the portfolio in terms of countries and sector allocation.

Opportunities: The next dividend season will begin in the coming weeks and this issue is likely to be brought further into the spotlight. With Open End PERLES (symbol: SWDIV), investors can take up an early position in a selection of Swiss value stocks via the Dow Jones Switzerland Select Dividend 15 Index™. Should the international markets seem more appealing, investors can look to the UBS Global Quality Dividend Payers Index. With this benchmark, investors can choose between three different trading currencies (see right). In the interests of consistency, both benchmarks are total return indices. This means that any dividend payments are reflected in the calculation of each of the underlying assets.

Risks: Open End PERLES do not have capital protection. Losses will be made if the underlying index declines. The currency risk must also be taken into account, as the trading currency of some index constituents may differ from the trading currency of the certificate shown. Investors in structured products are also exposed to issuer risk, which means that the invested capital may be lost if UBS AG becomes insolvent, regardless of the performance of the underlying.

More UBS products and further information on the risks and opportunities are available at ubs.com/keyinvest.

Dow Jones Switzerland Select Dividend 15 Index™ vs. SMI™ Index
(5 years; for illustrative purposes only; figures in %)

Searching specifically for attractive dividend stocks really pays off – historically, the Dow Jones Switzerland Select Dividend 15 Index™ has massively outperformed the SMI™.

Source: UBS AG, Bloomberg

As of 06.02.2019

UBS Global Quality Dividend Payers Index vs. MSCI™ World Index
(five years, for illustrative purposes only, figures in %)¹

The UBS Global Quality Dividend Payers Index has also recorded higher returns than the broad equity market, with the benchmark increasingly outperforming the MSCI™ World Index since 2016. ¹) Please note that past performance is not an indication of future performance.

Source: UBS AG, Bloomberg

As of: 06.02.2019

¹) Please be aware that past performance does not indicate future results.
²) The conditions of ETTs are reviewed on a yearly basis and can be adjusted with a deadline of 13 months after the announcement.

Open End PERLES on Dow Jones Switzerland Select Dividend 15 Index™

Symbol SWDIV
SVSP Name Tracker Certificates
SPVSP Code 1300
Underlying Dow Jones Switzerland Select Dividend 15 Total Return Index™
Currency CHF
Ratio 10:1
Administration fee 0.40% p.a.
Expiry Open End
Participation 100%
Issuer UBS AG, London
Bid/Ask CHF 207.80 / 209.10
 

Open End PERLES on UBS Global Quality Dividend Payers Net Total Return Index

Symbol DIVQC
Symbol DIVQD
Symbol DIVQE
SVSP Name Tracker Certificates
SPVSP Code 1300
Ratio 1:1
Administration fee 1.00% p.a.
Participation 100%
Expiry Open End
Issuer UBS AG, London
Bid/Ask CHF 266.01 / 268.70
USD 314.22 /317.39
EUR 377.75 / 380.50
 

More UBS products and further information on the risks and opportunities are available at ubs.com/keyinvest.

Source: UBS AG, Bloomberg

As of: 06.02.2019

Market overview

Index Quotation Week¹
SMI™ 9’143.00 Pt. 2.0%
SLI™ 1’415.70 Pt. 1.5%
S&P 500™ 2’731.61 Pt. 1.9%
Euro STOXX 50™ 3’212.75 Pt. 1.6%
S&P™ BRIC 40 4’177.63 Pt. 1.1%
CMCI™ Compos. 913.51 Pt. 0.8%
Gold (troy ounce) 1’314.40 USD -0.1%

¹ Change based on the closing price of the previous day compared to the closing price a week ago.

SMI™ vs. VSMI™ 1 year

smi vs vsmi

The VSMI™ Index is calculated since 2005. It shows the volatility of the stocks within the SMI™ index. A portfolio which reacts only to changes in volatility instead of volatility itself is relevant for the calculation. Thereby, the VSMI™ methodology uses the squared volatility, known as variance, of the SMI options with remaining time to expiry of 30 days traded at the Eurex.

Source: UBS AG, Bloomberg

As of: 06.02.2019

Tesla
Profits rolling off the production line

The balance sheets of US electric car pioneer Tesla have long been in the red. However, change has been afoot since the second half of 2018, with the California-based group posting a profit in two successive quarters. This positive trend looks set to continue, as company founder Elon Musk announced that the company would close each quarter in 2019 with a profit. The drivers behind this good performance include the Model 3 car, which the company has pinned its hopes on and is now scheduled to be available on European shores in February. There is, however, some bad news – the production target of more than 500,000 units per year that was previously promised to be met in 2018 will probably only be achieved between the fourth quarter of 2019 and the second quarter of 2020 (Source: Thomson Reuters media report, January 30, 2019). With the Kick-In GOAL (symbol: KCWSDU) on Tesla, great profits can also be made on a bumpy road. The product comes with a risk buffer of 42% and offers a potential return of 19.1%.

Despite these initial profits, Tesla can expect a fluctuating performance, both in its operational business and on the stock exchange. The US car manufacturer’s share has been yo-yoing between 280 and 380 US dollars for months. Although Tesla has kept to its promise of remaining in the black from a fundamental perspective, the CEO of the company Musk is still a long way from achieving his goal. There are many factors causing difficulties for the charismatic head of the company, chief among them being the trade dispute between China and the US. Tesla is now having to slash the price of the Model 3 so that it can offset the higher tariffs. In order to avoid such problems in the future, Tesla wants its manufacturing operations to be carried out directly in China. Production is set to commence in the Shanghai plant in the second half of this year, with the target of 3,000 Model 3 cars rolling off the production line every week (Source: Thomson Reuters media report, February 2, 2019). The US group is also introducing cost-cutting measures. “We have to mercilessly cut costs to ensure that we can build affordable cars and not go broke,» said CEO Elon Musk at an analysts’ conference held on January 31.

Opportunities: Despite the initial profits, Tesla will still have to battle against the odds. It could therefore be sensible to invest in the electric car manufacturer with conditional partial protection rather than directly in the share. The Kick-In GOAL (symbol: KCWSDU) offers a high potential return with a healthy risk buffer. The security issued in December 2018 has an annual coupon of 15%. As the Kick-In GOAL is listed under par, the annual return is currently 22.8%. The barrier currently stands at USD 181.53, i.e. 42% of the current price.

Risks: Kick-In GOALs do not have capital protection. If Tesla touches or falls below the kick-in level once during the term, the underlying stock has to be trading at least at the strike level on maturity. Otherwise, the amount repaid in cash will reflect the subscription ratio. In this case, it is likely that losses will be incurred. Investors in structured products are also exposed to issuer risk, which means that the invested capital may be lost if UBS AG becomes insolvent, regardless of the performance of the underlying.

More UBS products and further information on the risks and opportunities are available at ubs.com/keyinvest.

Tesla

Source: UBS AG, Bloomberg

As of: 06.02.2019

15.00% p.a. Kick-In GOAL on Tesla

Symbol KCWSDU
SVSP Name Barrier Reverse Convertibles
SPVSP Code 1230
Underlyings Tesla
Currency USD
Coupon 15.00% p.a.
Sideways return 19.83% (23.82% p.a.)
Kick-In Level (Distance)
USD 181.53 (43.06%)
Expiry 05.12.2019
Issuer UBS AG, London
Bid/Ask 92.72% / 93.72%
 

More UBS products and further information on the risks and opportunities are available at ubs.com/keyinvest.

Source: UBS AG, Bloomberg

As of: 06.02.2019

¹) Please be aware that past performance does not indicate future results.
²) The conditions of ETTs are reviewed on a yearly basis and can be adjusted with a deadline of 13 months after the announcement.

This material has been prepared by UBS AG or one of its affiliates («UBS»). This material is for distribution only as permitted by law. It is not prepared for the needs of any specific recipient. It is published solely for information and is not a solicitation or offer to buy or sell any securities or related financial instruments (“Instruments”). UBS makes no representation or warranty, either express or implied, on the completeness or reliability of the information contained in this document (“Information”) except that concerning UBS AG and its affiliates. The Information should not be regarded by recipients as a substitute for using their own judgment. Any opinions expressed in this material may change without notice and may be contrary to opinions expressed by other business areas of UBS as a result of using different assumptions or criteria. UBS is under no obligation to update the Information. UBS, its officers, employees or clients may have or have had an interest in the Instruments and may at any time transact in them. UBS may have or have had a relationship with entities referred to in the Information. Neither UBS nor any of its affiliates, or their officers or employees, accepts any liability for any loss arising from use of the Information. This presentation is not a basis for entering into a transaction. Any transaction between you and UBS will be subject to the detailed provisions of the term sheet, confirmation or electronic matching systems relating to that transaction. Clients wishing to effect transactions should contact their local sales representative.
This information is communicated by UBS AG and/or its affiliates («UBS»). * (see below) UBS may from time to time, as principal or agent, have positions in, or may buy or sell, or make a market in any securities, currencies, financial instruments or other assets underlying the product to which this website relates (the «Structured Product»). UBS may provide investment banking and other services to and/or have officers who serve as directors of the companies referred to in this website. UBS’s trading and/or hedging activities related to the Structured Product may have an impact on the price of the underlying asset and may affect the likelihood that any relevant barrier or relevant trigger event is crossed or triggered. UBS has policies and procedures designed to minimise the risk that officers and employees are influenced by any conflicting interest or duty and that confidential information is improperly disclosed or made available. UBS may pay or receive brokerage or retrocession fees in connection with the Structured Product described herein. In respect of any Structured Product that is a security, UBS may, in certain circumstances, sell the Structured Product to dealers and other financial institutions at a discount to the issue price or rebate to them for their own account some proportion of the issue price. Further information is available on request. Structured Products are complex and may involve a high risk of loss. Prior to purchasing the Structured Product you should consult with your own legal, regulatory, tax, financial and accounting advisors to the extent you consider it necessary, and make your own investment, hedging and trading decisions (including decisions regarding the suitability of the Structured Product) based upon your own judgement and advice from those advisers you consider necessary. Save as otherwise expressly agreed in writing, UBS is not acting as your financial adviser or fiduciary in relation to the Product. UBS generally hedges its exposure to Structured Products, although it may elect not to hedge or to partially hedge any Structured Product. UBS’s hedging activity may be conducted through transactions in the underlying asset, index or instrument or in options, futures or other derivatives related to the underlying asset, index or instrument on publicly traded markets or otherwise, and may have an impact on the price of the under-lying asset. If a transaction is cash settled, UBS will generally unwind or offset any hedge it has for such Structured Product in close proximity to the relevant valuation time or period. In some cases, this activity may affect the value of the Structured Product. Unless stated otherwise in this document, (i) this document is for information purposes only and should not be construed as an offer, personal recommendation or solicitation to purchase the Structured Product and should not be treated as giving investment advice, and (ii) the terms of any investment in the Structured Product will be exclusively subject to the detailed provisions, including risk considerations, contained in the more detailed legal documentation that relates to the Structured Product (being the confirmation, information memorandum, prospectus or other issuer documentation as relevant). UBS makes no representation or warranty relating to any information herein which is derived from independent sources. This document shall not be copied or reproduced without UBS’s prior written permission. In respect of any Structured Product that is a security, no action has been or will be taken in any jurisdiction that would permit a public offering of the Product, save where explicitly stated in the issuer documentation. The Structured Product must be sold in accordance with all applicable selling restrictions in the jurisdictions in which it is sold.
© UBS 2018. All rights reserved. UBS prohibits the forwarding of this information without the approval of UBS.
Weekly Hits: Dividend strategy & Tesla2019-02-28T13:23:21+01:00

Neuer Monat, alte Brennpunkte

KeyInvest Blog

4. Februar 2019 – UBS Wochenkommentar Rück-/Ausblick

Neuer Monat, alte Brennpunkte

Die US-Notenbank nimmt im laufenden Zinserhöhungszyklus den Fuss vom Gaspedal. Mit dieser zentralen Botschaft meldete sich das Fed nach seiner jüngsten Sitzung zu Wort. Zwei Tage später lieferte der Arbeitsmarktbericht einen Beleg für die eigentlich starke Verfassung der weltgössten Volkswirtschaft. Positiv reagierten die Märkte auf die Ankündigung von US-Präsident Donald Trump, den Zollstreit mit China beilegen zu wollen. Neben diesem Dauerthema wird die Bilanzsaison die Märkte bis auf weiteres beschäftigen.

Federal Reserve: Ein neues Signalwort

Mehr als eine Dreiviertelstunde nahm sich Fed-Präsident Jerome Powell am 30. Januar Zeit, um nach der jüngsten Notenbanksitzung die geldpolitische Ausrichtung zu erläutern und Fragen der Medienvertreter zu beantworten. Der Offenmarktausschuss hatte zuvor den Schlüsselsatz unverändert bei einer Spanne von 2.25 bis 2.50 Prozent belassen. Hinsichtlich weiterer Schritte möchte Powell „geduldig“ agieren. Dieses Adjektiv zog sich wie eine Art Signalwort durch die Ausführungen des obersten US-Währungshüters. „Die Argumente für Zinserhöhungen sind etwas schwächer geworden“, brachte Powell die neue Vorsicht auf den Punkt. Gleichzeitig verzichtete die Notenbank auf die so genante Forward Guidance. Noch im Dezember hatte das Entscheidungsgremium für 2019 zwei weitere Zinserhöhungen ins Auge gefasst. (Quelle: Thomson Reuters, Medienbericht, 30.01.2019)

US-Konjunktur: Jobmotor läuft auf Hochtouren

Gebannt dürften Powell und seine Fed-Kollegen den jüngsten Arbeitsmarktbericht studiert haben. Im Januar entstanden in den USA ausserhalb der Landwirtschaft 304’000 neue Stellen. Von der Nachrichtenagentur Reuters befragte Experten hatten im Schnitt mit lediglich 165’000 zusätzlichen Jobs gerechnet. Für den Dezember revidierte das Arbeitsministerium die zunächst gemeldete Zahl der neuen Stellen um 90’000 auf jetzt 222’000 nach unten. Zwar hatte der durch einen Haushaltsstreit ausgelöste 35-tägige Stillstand von Teilen der Regierung keinen „erkennbaren“ Einfluss auf den Jobmotor. Gleichwohl zog der „Government Shutdown“ dem Arbeitsministerium zufolge einen leichten Anstieg der Erwerbslosenquote nach sich. Diese viel beachtete Rate erreichte im Januar ein Sieben-Monats-Hoch von 4.0 Prozent. Hier lag der Konsens bei 3.9%. Die durchschnittlichen Stundenlöhne zogen Anfang Jahr um lediglich 0.1% an. Im Dezember lag das Plus noch bei 0.4%. Der abnehmende Inflationsdruck sollte dem Fed bei seiner vorsichtigeren Gangart in die Hände spielen. (Quelle: Thomson Reuters, Medienbericht, 01.02.2019).

Februar: Zahlenflut und Showdown im Zollstreit

Eine zentrale Rolle nimmt für Geldpolitik, Realwirtschaft und Kapitalmärkte der Zollstreit ein. US-Präsident Donald Trump hat jetzt ein Treffen mit seinem chinesischen Amtskollegen Xi Jinping angekündigt. Gleichzeitig gab sich der Republikaner zuversichtlich, dass die beiden Staaten „den größten Deal aller Zeiten“ erreichen könnten. Auch von Seiten Chinas kamen nach zweitägigen Verhandlungen in der US-Hauptstadt versöhnliche Töne. Die Delegation aus Peking sprach von substanziellen Fortschritten. Ob das Gipfeltreffen noch im Februar stattfinden wird, blieb zunächst offen. Die Zeit drängt, da Ende Monat der zwischen den USA und China vereinbarte «Burgfrieden» endet. Sofern bis zum 2. März keine Lösung erreicht wird, möchte Washington wie angekündigt die Einfuhrzölle auf Waren aus der Volksrepublik erhöhen. (Quelle: Thomson Reuters, Medienbericht, 01.02.2019)

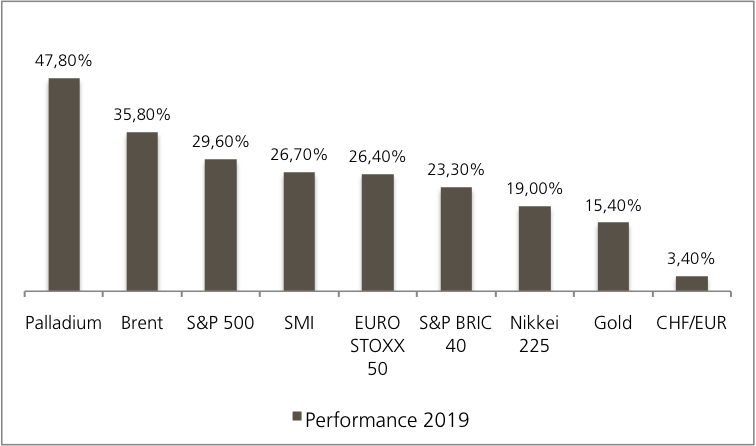
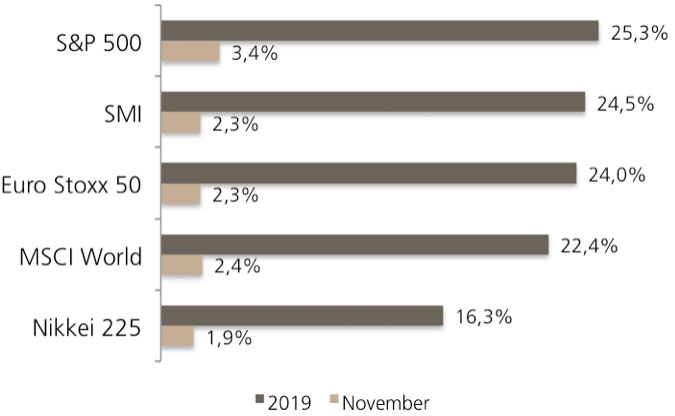
Neben dem Zollstreit hält die Bilanzsaison die Märkte bis auf weiteres in Atem. In der neuen Woche stehen hier zu Lande beispielsweise die Finanzberichte von Zurich Insurance und Swisscom (Veröffentlichung jeweils am 07.02.) an. In den USA reihen sich unter anderem Alphabet (04.02.), Disney (05.02.) sowie Eli Lilly (06.02.) in den Zahlenreigen ein. Nicht zuletzt die Reports der Wall Street-Schwergewichte Apple oder Facebook sorgten dafür, dass die Börsen Ende Januar weiter zulegen konnten. Zuvor hatten bereits die geldpolitische Entwicklung sowie die Hoffnung auf ein Ende des Handelsstreits für Kauflaune gesorgt. Kurzum: Die Bilanz für den ersten Monat im Börsenjahr 2019 (siehe Grafik) kann sich sehen lassen.

Ausgewählte Anlageklassen: Performance Januar 2019¹

Stand: 31.01.2019; Quelle: UBS AG, Bloomberg

¹) Bitte beachten Sie, dass vergangene Wertentwicklungen keine Indikationen für künftige Wertentwicklungen sind.

Weitere Blogeinträge:

Der Herbst ist da

Zum Herbstanfang meinte es das Wetter mit den Bewohnern von weiten Teilen Europas und Nordamerikas gut. In vielen Regionen strahlte die Sonne. Dagegen gab der Herbst an den Börsen diesseits wie jenseits des Atlantiks einen gebührenden Einstand.

Spannungsgeladene Woche

Das Wichtigste vorweg: In den kommenden Tagen kommt es zum Showdown bei den grossen Notenbanken.

Epochale Entscheidungen

Einen historischen Zinsschritt hat die Europäische Zentralbank (EZB) in der vergangenen Woche unternommen. Zum ersten Mal seit der Einführung des Euro-Bargeldes 2002 schraubten die Währungshüter die Leitzinsen um 0.75 Prozentpunkte nach oben.

Neuer Monat, alte Brennpunkte2019-02-04T09:01:30+01:00

Weekly Hits: Gaming Industry & Oil companies

KeyInvest Weekly Hits

Friday, 01.02.2019

  • Topic 1: Gaming Industry Basket - Play and win
  • Topic 2: BP / Total / Royal Dutch Shell - Integrated oil companies post their results

Gaming Industry Basket
Play and win

Football is played everywhere; on the field next door, in the schoolyard and even on the beach. But the popular sport is encountering increasing “digital” competition. Virtual kicking is on the march. The Fifa computer game developed by the listed US group Electronic Arts (EA) claims to have sold over 260 million units, making it the most successful video sport game of all time. (Source: EA, media report, 05.09.2018) Given the growth numbers, it is no wonder that the competition is constantly increasing. According to the market research company Newzoo, the global games market likely grew by a total 13.3% in 2018 to USD 137.9 billion. (Source: Newzoo, 02.11.2018) Now UBS is giving investors the ability to take a broadly diversified position in this fast-growing segment via the brand new PERLES on the gaming industry basket (symbol: GAMECU).

One of the growth drivers in the sector is e-sports. The market for sporting competitions between people using computers has more than doubled in recent years. According to UBS CIO GWM it will grow by another 100% to USD 1.5 billion by 2020. The number of e-sports enthusiasts will rise to 286 million by that date. This is equivalent to growth of around 50% compared to 2017. (Source: UBS CIO GWM, Global e-leisure, 21.01.2019)

Geographically, China sets the pace in the global e-gaming segment. The experts at Newzoo expect that last year the country was once again the largest gaming market in the world at USD 34.4 billion. (Source: Newzoo, 03.08.2018) But it’s not just the Chinese who are fanatical about gaming, the whole of Asia loves it. UBS CIO GWM assumes that sales of video games in Asia will rise to USD 200 billion by 2030, equivalent to an annual average growth rate of 9.5%. (Source: UBS CIO GWM, Game on, Asia, 19.09.2018)
As in many other areas of life, gaming too is seeing the trend towards mobile. According to the researchers at Newzoo, mobile games were the largest segment in the global gaming market in 2018, accounting for 47%. The experts think that the shift towards mobile platforms, and especially towards smartphones, will continue in 2019. Newzoo is forecasting that the global market for mobile games will grow to USD 174 billion by 2021, giving it 52% of total revenues. (Source: Newzoo, 02.11.2018) The largest developer of online games is currently Tencent. Recently the Chinese firm has been suffering from the government’s pause on authorizing new games in view of protecting minors and combating gambling addiction. This has dampened growth at Tencent in the recent past. This year, however, the authorities have again started issuing sales permits, causing the stock price to rise.¹

Opportunities: The gaming specialists just mentioned, Electronic Arts and Tencent, are only two of the companies in the new gaming industry basket. They also include Japanese developer Nexon, Take-Two Interactive from the US and the cult firm Nintendo. There are a total of 13 international companies in the well-diversified basket, which consists of Ubisoft of France plus half each from Asia and the USA. The PERLES, which is open for subscription (symbol: GAMECU), allows investors to participate in this innovation-driven growth sector one-to-one (minus a management fee of 0.50% p.a.). Dividends are taken into account on a net basis. At the start of the basket the constituents are all equally weighted, the product term is seven years.

Risks: This product does not have any capital protection. With a PERLES, losses are incurred if the underlying basket falls below the entry price. Investors in structured products are also exposed to issuer risk, which means that the capital invested may be lost if UBS AG becomes insolvent, regardless of the performance of the underlying.

More UBS products and further information on the risks and opportunities are available at ubs.com/keyinvest.

Electronic Arts vs. Tencent vs. Ubisoft
(5 years; for illustrative purposes only; figures in %)

The international gaming trio Electronic Arts, Tencent and Ubisoft have seen their stock prices multiply in recent years. Recently there has been a correction, which is just bottoming out.

Source: UBS AG, Bloomberg

As of 30.01.2019

Forecast growth in revenue and players in e-sports (2015 to 2020)

Experts are predicting that both revenue and the number of players will rise sharply in e-sports in the next few years. (Source: UBS CIO GWM, Global e-leisure, 21.01.2019)

Source: UBS AG, Bloomberg

As of: 30.01.2019

¹) Please be aware that past performance does not indicate future results.
²) The conditions of ETTs are reviewed on a yearly basis and can be adjusted with a deadline of 13 months after the announcement.

PERLES on Gaming Industry Basket

Symbol GAMECU
SVSP Name Tracker Certificates
SPVSP Code 1300
Underlying Gaming Industry Basket
Currency CHF
Ratio 1:1
Administration fee 0.50% p.a.
Expiry 13.02.2026
Participation 100%
Issuer UBS AG, London
Subscripton until 14.02.2019, 15:00 h
 

Basekt members at a glance

Company Weighting
Tencent 7.6923%
Nintendo 7.6923%
Electronic Arts 7.6923%
Take-Two Interactive Softw. 7.6923%
NetEase 7.6923%
Zynga 7.6923%
Nexon 7.6923%
Turtle Beach 7.6923%
Kingsoft 7.6923%
Sea 7.6923%
Ubisoft Entertainment 7.6923%
Bandai Namco 7.6923%
Square Enix 7.6923%
 

More UBS products and further information on the risks and opportunities are available at ubs.com/keyinvest.

Source: UBS AG, Bloomberg

As of: 30.01.2019

Market overview

Index Quotation Week¹
SMI™ 8’965.71 0.1%
SLI™ 1’394.47 0.3%
S&P 500™ 2’681.05 1.6%
Euro STOXX 50™ 3’161.74 1.6%
S&P™ BRIC 40 4’130.54 2.6%
CMCI™ Compos. 906.03 1.1%
Gold (troy ounce) 1’315.50 USD 2.5%

¹ Change based on the closing price of the previous day compared to the closing price a week ago.

SMI™ vs. VSMI™ 1 year

smi vs vsmi

The VSMI™ Index is calculated since 2005. It shows the volatility of the stocks within the SMI™ index. A portfolio which reacts only to changes in volatility instead of volatility itself is relevant for the calculation. Thereby, the VSMI™ methodology uses the squared volatility, known as variance, of the SMI options with remaining time to expiry of 30 days traded at the Eurex.

Source: UBS AG, Bloomberg

As of: 30.01.2019

BP / Total / Royal Dutch Shell
Integrated oil companies post their results

With the reporting season coming up soon, the focus will be on the major European oil and gas companies. Royal Dutch Shell announced its results yesterday morning (after we had gone to press), and BP is due to report on Tuesday, 5 February. Two days later, Total will follow suit. UBS combines the three European integrated oil stocks as underlyings for an Issuer Callable Worst of Kick-In GOAL (symbol: KDCLDU). Regardless of how the stock prices of the trio perform, investors can expect a coupon payment of 6.00% p.a. from the product. Each underlying has a price cushion of 40% at the initial fixing.

Figures from the oil and gas companies are being eagerly awaited, not least because the price of fuel moved down sharply at the start of the fourth quarter 2018. For example: on 3 October 2018, Brent cost USD 86.74, the highest price in four years. The correction that followed took the price down by up to 42% by the end of December.¹ The change in direction was driven by a completely different situation in the market: whereas global oil production had still been unable to meet demand in the third quarter, the last three months of 2018 saw a considerable surplus. Experts see this persisting in the new year. (Source: Thomson Reuters, 25.01.2019)

The result announcements will show how well the oil and gas sector is coping with the change in fundamentals. Cost cutting and higher prices have allowed the integrated operators to cash in mightily in the past few years. For example, Royal Dutch Shell: the largest stock in the sector by market capitalization in Europe reported operating cash flow of USD 14.7 billion in the third quarter of 2018. CEO Ben Beurden spoke of one of the best quarters in the company’s history. (Source: Royal Dutch Shell, announcement, 01.11.2018) The sector allows shareholders to participate in the success of the business through dividends and share buybacks.

Opportunities: Even if the stock prices of BP, Total and Royal Dutch Shell don’t budge in the next 18 months, the IC Worst-of Kick-In GOAL (Symbol: KDCLDU) offers an attractive minimum return of 6.00% p.a. This assumes that none of the underlyings touches or falls below the low barrier of 60% of the starting level. The issuer has a right of termination. If it makes use of the issuer-call feature on one of the two exercise dates (06.02.2020 and 06.05.2020), investors receive the full nominal and pro-rata coupon repaid early.

Risks: Worst-of Kick-In GOALs do not have capital protection. If one of the underlyings touches or falls below the respective kick-in level (barrier) and the issuer-call feature is not exercised, repayment at maturity will be in cash in line with the weakest performance of the trio (from the strike), but no more than nominal plus coupon. In this case, it is likely that losses will be incurred. Investors in structured products are also exposed to issuer risk, which means that the capital invested may be lost if UBS AG becomes insolvent, regardless of the performance of the underlying.

More UBS products and further information on the risks and opportunities are available at ubs.com/keyinvest.

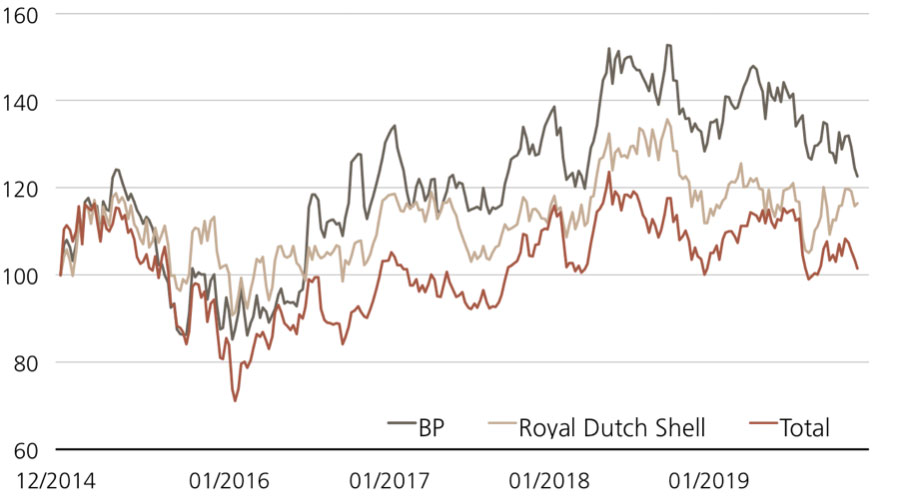
BP vs. Total vs. Royal Dutch Shell
(five years, for illustrative purposes only, figures in %)¹

Source: UBS AG, Bloomberg

As of: 30.01.2019

6.00% p.a. IC Worst of Kick-In GOAL on BP / Total / Royal Dutch Shell /

Symbol KDCLDU
SVSP Name Barrier Reverse Convertibles
SPVSP Code 1230 (Callable)
Underlyings BP / Total / Royal Dutch Shell
Currency CHF
Coupon 6.00% p.a.
Kick-In Level
60%
Expiry 06.08.2020
Issuer UBS AG, London
Subscription until 06.02.2019, 15:00 Uhr
 

More UBS products and further information on the risks and opportunities are available at ubs.com/keyinvest.

Source: UBS AG, Bloomberg

As of: 30.01.2019

¹) Please be aware that past performance does not indicate future results.
²) The conditions of ETTs are reviewed on a yearly basis and can be adjusted with a deadline of 13 months after the announcement.

This material has been prepared by UBS AG or one of its affiliates («UBS»). This material is for distribution only as permitted by law. It is not prepared for the needs of any specific recipient. It is published solely for information and is not a solicitation or offer to buy or sell any securities or related financial instruments (“Instruments”). UBS makes no representation or warranty, either express or implied, on the completeness or reliability of the information contained in this document (“Information”) except that concerning UBS AG and its affiliates. The Information should not be regarded by recipients as a substitute for using their own judgment. Any opinions expressed in this material may change without notice and may be contrary to opinions expressed by other business areas of UBS as a result of using different assumptions or criteria. UBS is under no obligation to update the Information. UBS, its officers, employees or clients may have or have had an interest in the Instruments and may at any time transact in them. UBS may have or have had a relationship with entities referred to in the Information. Neither UBS nor any of its affiliates, or their officers or employees, accepts any liability for any loss arising from use of the Information. This presentation is not a basis for entering into a transaction. Any transaction between you and UBS will be subject to the detailed provisions of the term sheet, confirmation or electronic matching systems relating to that transaction. Clients wishing to effect transactions should contact their local sales representative.
This information is communicated by UBS AG and/or its affiliates («UBS»). * (see below) UBS may from time to time, as principal or agent, have positions in, or may buy or sell, or make a market in any securities, currencies, financial instruments or other assets underlying the product to which this website relates (the «Structured Product»). UBS may provide investment banking and other services to and/or have officers who serve as directors of the companies referred to in this website. UBS’s trading and/or hedging activities related to the Structured Product may have an impact on the price of the underlying asset and may affect the likelihood that any relevant barrier or relevant trigger event is crossed or triggered. UBS has policies and procedures designed to minimise the risk that officers and employees are influenced by any conflicting interest or duty and that confidential information is improperly disclosed or made available. UBS may pay or receive brokerage or retrocession fees in connection with the Structured Product described herein. In respect of any Structured Product that is a security, UBS may, in certain circumstances, sell the Structured Product to dealers and other financial institutions at a discount to the issue price or rebate to them for their own account some proportion of the issue price. Further information is available on request. Structured Products are complex and may involve a high risk of loss. Prior to purchasing the Structured Product you should consult with your own legal, regulatory, tax, financial and accounting advisors to the extent you consider it necessary, and make your own investment, hedging and trading decisions (including decisions regarding the suitability of the Structured Product) based upon your own judgement and advice from those advisers you consider necessary. Save as otherwise expressly agreed in writing, UBS is not acting as your financial adviser or fiduciary in relation to the Product. UBS generally hedges its exposure to Structured Products, although it may elect not to hedge or to partially hedge any Structured Product. UBS’s hedging activity may be conducted through transactions in the underlying asset, index or instrument or in options, futures or other derivatives related to the underlying asset, index or instrument on publicly traded markets or otherwise, and may have an impact on the price of the under-lying asset. If a transaction is cash settled, UBS will generally unwind or offset any hedge it has for such Structured Product in close proximity to the relevant valuation time or period. In some cases, this activity may affect the value of the Structured Product. Unless stated otherwise in this document, (i) this document is for information purposes only and should not be construed as an offer, personal recommendation or solicitation to purchase the Structured Product and should not be treated as giving investment advice, and (ii) the terms of any investment in the Structured Product will be exclusively subject to the detailed provisions, including risk considerations, contained in the more detailed legal documentation that relates to the Structured Product (being the confirmation, information memorandum, prospectus or other issuer documentation as relevant). UBS makes no representation or warranty relating to any information herein which is derived from independent sources. This document shall not be copied or reproduced without UBS’s prior written permission. In respect of any Structured Product that is a security, no action has been or will be taken in any jurisdiction that would permit a public offering of the Product, save where explicitly stated in the issuer documentation. The Structured Product must be sold in accordance with all applicable selling restrictions in the jurisdictions in which it is sold.
© UBS 2018. All rights reserved. UBS prohibits the forwarding of this information without the approval of UBS.
Weekly Hits: Gaming Industry & Oil companies2019-02-28T13:22:34+01:00

Weekly Hits: Gaming Industry Basket & Multinationales du pétrole

KeyInvest Weekly Hits

Vendredi, 01.02.2019

  • Thème 1: Gaming Industry Basket - Gagner est un jeu d’enfant
  • Thème 2: BP / Total / Royal Dutch Shell - Les multinationales du pétrole à livres ouverts

Gaming Industry Basket
Gagner est un jeu d’enfant

On joue au football partout, sur la pelouse d’à côté, dans les cours d’école ou encore sur la plage. Mais ce sport de masse connaît une concurrence numérique toujours plus importante. Car le foot virtuel gagne du terrain. Le jeu informatique Fifa développé par le groupe américain coté en bourse Electronic Arts (EA) est le jeu vidéo sportif ayant connu le plus grand succès de tous les temps avec plus de 260 millions d’unités vendues, selon les indications du groupe. (Source : EA, article de presse, 05.09.2018). Il n’est donc pas étonnant que la concurrence progresse toujours davantage au vu des chiffres de croissance. Selon l’institut d’études de marché Newzoo, en 2018, le marché mondial des jeux pourrait ainsi avoir enregistré une progression de 137.9 milliards de dollars US. (Source : Newzoo, 02.11.2018). Désormais, UBS donne aux investisseurs la possibilité de se positionner sur ce secteur à forte croissance avec le tout nouveau PERLES sur le Gaming Industry Basket (symbole : GAMECU).

L’e-sport est l’un des moteurs de croissance pour ce secteur. Le marché portant sur les compétitions sportives entre les personnes à l’aide d’ordinateurs a plus que doublé dans le courant des dernières années. UBS CIO WM indique qu’il progressera à nouveau d’environ 100% à 1.5 milliard de dollars US en 2020. D’ici là, le nombre d’adeptes de l’e-sport devrait passer à 286 millions ce qui correspond à une progression d’environ 50% par rapport à 2017. (Source : UBS CIO WM, Global e-leisure, 21.01.2019).

D’un point de vue géographique, l’Empire du Milieu donne le ton dans le segment mondial de l’e-gaming. Les experts de Newzoo estiment que l’année dernière la Chine a été à nouveau le marché de gaming le plus important du monde avec un volume de ventes de 34.4 milliards de dollars US. (Source : Newzoo, 03.08.2018). Les Chinois ne sont pas les seuls à se passionner pour les jeux. Tout le continent asiatique en est adepte. UBS CIO WM prévoit qu’en Asie le chiffre d’affaires des jeux vidéo passera à 200 milliards de dollars US d’ici 2030, ce qui correspond à un taux de croissance moyen annuel de 9.5%. (Source : UBS CIO WM, Game on, Asia, 19.09.2018).
Comme dans de nombreux autres domaines de la vie, pour le jeu, la tendance s’oriente toujours davantage vers la « mobilité ». Selon le spécialiste des études de marché Newzoo, avec 47%, les « Mobile games » ont été le segment le plus important du marché global des jeux. D’après les experts, ce décalage vers les plateformes mobiles, et surtout vers les smartphones, se poursuivra en 2019. Newzoo prévoit que le marché global des Mobile Games progressera à 174 Milliards de dollars US d’ici 2021, et correspondra alors à 52% de l’ensemble des gains. (Source : Newzoo, 02.11.2018). Actuellement, le plus important développeur de jeux en ligne est Tencent. Toutefois, les Chinois ont souffert de l’interdiction gouvernementale d’autoriser de nouveaux jeux afin de protéger la jeunesse et de lutter contre l’addiction. Il en est finalement résulté pour Tencent une croissance modérée. Depuis cette année, les autorités octroient toutefois à nouveau des licences de distribution. En conséquence le marché fait grimper l’action.¹

Opportunités: les spécialistes des jeux déjà mentionnés que sont Electronic Arts et Tencent ne sont que deux des entreprises contenues dans le nouveau Gaming Industry Basket. On y trouve aussi par exemple le développeur japonais Nexon, la société américaine Take-Two Interactive et le groupe culte Nintendo. Au total, le panier d’actions bien garni contient 13 entreprises internationales. Outre le Français Ubisoft, il comporte 50% de titres asiatiques et 50% de titres américains. Avec le PERLES en souscription (symbole : GAMECU), les investisseurs peuvent participer intégralement (moins une commission de gestion de 0.50% p.a. à l’évolution de ce secteur de croissance stimulé par l’innovation. Les dividendes sont pris en compte sur une base nette. Au lancement du panier, les membres sont tous pondérés de manière identique. La durée du produit est de sept ans.

Risques: il n’existe aucune protection du capital pour le produit présenté. Avec un PERLES, il est possible d’essuyer des pertes dès que le panier sous-jacent passe sous le seuil d’entré. Par ailleurs, avec les produits structurés, l’investisseur supporte le risque d’émetteur. Cela signifie qu’en cas d’insolvabilité d’UBS SA, le capital investi peut être perdu, indépendamment de l’évolution du sous-jacent.

Vous trouverez davantage de produits UBS et des informations sur les opportunités et les risques à l’adresse ubs.com/keyinvest.

Electronic Arts vs. Tencent vs. Ubisoft
(5 ans, aux fins d’illustration uniquement, données en%)¹

Le trio international de gaming composé de Electronic Arts, Tencent et Ubisoft s’est multiplié au cours des dernières années. Finalement, il y a eu une correction de cours qui vient de toucher un plancher.

Source: UBS AG, Bloomberg

Valeurs du: 30.01.2019

Croissance du chiffre d’affaires et des joueurs prévue dans le secteur
de l’e-sport (de 2015 à 2020).

Les experts prévoient que tant les chiffres d’affaires que le nombre de joueurs sur le terrain de croissance qu’est l’e-sport augmenteront fortement au cours des prochaines années. (Source : UBS CIO WM, Global e-leisure, 21.01.2019)

Source: UBS AG, Bloomberg

Valeurs du: 30.01.2019

¹) La performance passée n’indique pas les résultats futures.
²) Les condition des ETTs sont vérifiés annuellement et peuvent être ajustées avec un délai de 13 mois après la publication.

PERLES sur Gaming Industry Basket

Symbol GAMECU
SVSP Name Tracker Certifikat
SPVSP Code 1300
Sous-jacent Gaming Industry Basket
Devise CHF
Rapport de souscription 1:1
Frais de gestion 0.50% p.a.
Participation 100%
Echéance 13.02.2026
Prix d’Emission CHF 100.00
Émetteur UBS AG, London
Sous-jacent 14.02.2019, 15:00 h
 

Les membres du basekt en bref

Société Poids
Tencent 7.6923%
Nintendo 7.6923%
Electronic Arts 7.6923%
Take-Two Interactive Softw. 7.6923%
NetEase 7.6923%
Zynga 7.6923%
Nexon 7.6923%
Turtle Beach 7.6923%
Kingsoft  7.6923%
Sea 7.6923%
Ubisoft Entertainment 7.6923%
Bandai Namco  7.6923%
Square Enix 7.6923%
 

Vous trouverez davantage de produits UBS et des informations sur les opportunités et les risques à l’adresse ubs.com/keyinvest.

Source: UBS AG, Bloomberg

Valeurs du: 30.01.2019

Apérçu du marché

Index Citation Semaine¹
SMI™ 8’965.71 0.1%
SLI™ 1’394.47 0.3%
S&P 500™ 2’681.05 1.6%
Euro STOXX 50™ 3’161.74 1.6%
S&P™ BRIC 40 4’130.54 2.6%
CMCI™ Compos. 906.03 1.1%
Gold (troy ounce) 1’315.50 USD 2.5%

¹ Changement basé sur le cours de clôture du jour précédent par rapport au cours de clôture de la semaine dernière.

SMI™ vs. VSMI™ 1 année

L’index VSMI™ est calculé depuis 2005. Il affiche la volatilité des actions inclus dans le SMI™ index. Pour la calculation, un portefeuille est utilisé qui ne réagit qu’au variations de la volatilité au lieu des variations des prix. En le faisant, la méthodologie du VSMI™ utilise la volatilité carré, connu sous le terme variance, des options sur le SMI avec 30 jours jusqu’à l’échéance négociées à la Bourse Eurex.

Source: UBS AG, Bloomberg

Valeurs du: 30.01.2019

BP / Total / Royal Dutch Shell
Les multinationales du pétrole à livres ouverts

Dans le cadre de la saison des bilans, ces prochains jours, l’attention se portera notamment sur les grands groupes pétroliers et gaziers. Après que Royal Dutch Shell a publié dès ce matin (après clôture rédactionnelle) ses comptes, BP fera de même mardi prochai 5 février. À peine deux jours plus tard, ce sera à Total de publier son bilan. UBS réunit les trois multinationales européennes en sous-jacents d’un Issuer-Callable (IC) Worst-of Kick-In GOAL (symbole : KDCLDU). Indépendamment de l’évolution des cours du trio, les investisseurs peuvent prévoir, avec le produit en souscription, un versement ferme de coupon d’un montant de 6,00% p.a. Au fixing initial, chaque sous-jacent est doté d’une marge de cours de 40%.

Les résultats des entreprises pétrolières et gazières promettent du suspense, ne serait-ce que parce que les prix de l’énergie ont violemment baissé au début du quatrième trimestre 2018. Exemple du Brent : le 3 octobre 2018, un baril de pétrole de la mer du Nord coûtait jusqu’à 86.74 dollars US, le prix le plus élevé depuis quatre ans. Avec la correction intervenue le lendemain, la matière première a baissé de jusqu’à 42% jusqu’à fin décembre.¹ Une situation de marché totalement différente a été déterminante pour ce revirement : alors que la production pétrolière globale n’arrivait pas à répondre au besoin au troisième trimestre, il y a eu, pendant les trois derniers mois de 2018, un net excédent. Selon les experts, ceci devrait se maintenir en 2019. (Source : Thomson Reuters, 25.01.2019)

Les rapports financiers montreront comment le secteur pétrolier et gazier a géré la nouvelle situation en matière de fondamentaux. Des économies de coûts et des hausses de prix ont rempli confortablement les caisses des multinationales au cours des dernières années. Exemple de Royal Dutch Shell : le plus grand représentant de la branche en termes de valeur boursière en Europe a affiché un cash-flow opérationnel de 14.7 milliards de dollars US au troisième trimestre 2018. Son CEO Ben van Beurden a parlé dans ce contexte de l’un des meilleurs trimestres de l’histoire de l’entreprise. (Source : Royal Dutch Shell, communication du 01.11.2018. Le secteur fait participer ses détenteurs de parts au succès économique via des dividendes et des rachats d’actions.

Opportunités: même si les actions de BP, Total et Royal Dutch Shell devaient ne pas décoller au cours des prochains 18 mois, avec l’IC Worst-of Kick-In GOAL (symbole : KDCLDU), un rendement latéral sympathique de 6% p.a. est possible. Ceci à la condition qu’aucun sous-jacent n’atteigne ou ne passe en-dessous de la barrière de 60% du niveau initial. Avec cette structure, l’émetteur dispose d’un cas de résiliation. S’il fait usage de la fonction Issuer-Callable, à l’un des deux jours d’exercice (06.02.2020, 06.05.2020), les investisseurs se verront rembourser l’intégralité du nominal et le pro rata du coupon.

Risques: les Worst of Kick-In GOALS ne bénéficient d’aucune protection du capital. Si, pendant la durée de l’investissement, l’un des sous-jacents atteint une seule fois la barrière respective (« Kick-In Level ») ou est inférieur à celle-ci, et que la fonction Issuer-Callable ne s’applique pas, le remboursement par amortissement en espèces à l’échéance est basé sur la performance la plus faible (base Strike) du trio (au maximum toutefois à la valeur nominale majorée du coupon). Dans un tel cas, des pertes sont probables. Par ailleurs, avec les produits structurés, l’investisseur supporte le risque d’émetteur. Cela signifie qu’en cas d’insolvabilité d’UBS SA, le capital investi peut être perdu, indépendamment de l’évolution du sous-jacent.

Vous trouverez davantage de produits UBS et des informations sur les opportunités et les risques à l’adresse ubs.com/keyinvest.

BP vs. Total vs. Royal Dutch Shell
(5 ans, aux fins d’illustration uniquement, données en %)

Source: UBS AG, Bloomberg

Valeurs du: 30.01.2019

6.00% p.a. IC Worst of Kick-In GOAL sur BP / Total / Royal Dutch Shell /

Symbol KDCLDU
SVSP Name Barrier Reverse Convertible
SPVSP Code 1230 (Callable)
Sous-jacent BP / Total / Royal Dutch Shell
Devise CHF
Coupon 6.00% p.a.
Kick-In Level 60%
Echéance 06.08.2020
Émetteur UBS AG, London
Sous-jacent 06.02.2019, 15:00 h
 

Vous trouverez davantage de produits UBS et des informations sur les opportunités et les risques à l’adresse ubs.com/keyinvest.

Source: UBS AG, Bloomberg

Valeurs du: 30.01.2019

¹) La performance passée n’indique pas les résultats futures.
²) Les condition des ETTs sont vérifiés annuellement et peuvent être ajustées avec un délai de 13 mois après la publication.

This material has been prepared by UBS AG or one of its affiliates («UBS»). This material is for distribution only as permitted by law. It is not prepared for the needs of any specific recipient. It is published solely for information and is not a solicitation or offer to buy or sell any securities or related financial instruments (“Instruments”). UBS makes no representation or warranty, either express or implied, on the completeness or reliability of the information contained in this document (“Information”) except that concerning UBS AG and its affiliates. The Information should not be regarded by recipients as a substitute for using their own judgment. Any opinions expressed in this material may change without notice and may be contrary to opinions expressed by other business areas of UBS as a result of using different assumptions or criteria. UBS is under no obligation to update the Information. UBS, its officers, employees or clients may have or have had an interest in the Instruments and may at any time transact in them. UBS may have or have had a relationship with entities referred to in the Information. Neither UBS nor any of its affiliates, or their officers or employees, accepts any liability for any loss arising from use of the Information. This presentation is not a basis for entering into a transaction. Any transaction between you and UBS will be subject to the detailed provisions of the term sheet, confirmation or electronic matching systems relating to that transaction. Clients wishing to effect transactions should contact their local sales representative.
This information is communicated by UBS AG and/or its affiliates («UBS»). * (see below) UBS may from time to time, as principal or agent, have positions in, or may buy or sell, or make a market in any securities, currencies, financial instruments or other assets underlying the product to which this website relates (the «Structured Product»). UBS may provide investment banking and other services to and/or have officers who serve as directors of the companies referred to in this website. UBS’s trading and/or hedging activities related to the Structured Product may have an impact on the price of the underlying asset and may affect the likelihood that any relevant barrier or relevant trigger event is crossed or triggered. UBS has policies and procedures designed to minimise the risk that officers and employees are influenced by any conflicting interest or duty and that confidential information is improperly disclosed or made available. UBS may pay or receive brokerage or retrocession fees in connection with the Structured Product described herein. In respect of any Structured Product that is a security, UBS may, in certain circumstances, sell the Structured Product to dealers and other financial institutions at a discount to the issue price or rebate to them for their own account some proportion of the issue price. Further information is available on request. Structured Products are complex and may involve a high risk of loss. Prior to purchasing the Structured Product you should consult with your own legal, regulatory, tax, financial and accounting advisors to the extent you consider it necessary, and make your own investment, hedging and trading decisions (including decisions regarding the suitability of the Structured Product) based upon your own judgement and advice from those advisers you consider necessary. Save as otherwise expressly agreed in writing, UBS is not acting as your financial adviser or fiduciary in relation to the Product. UBS generally hedges its exposure to Structured Products, although it may elect not to hedge or to partially hedge any Structured Product. UBS’s hedging activity may be conducted through transactions in the underlying asset, index or instrument or in options, futures or other derivatives related to the underlying asset, index or instrument on publicly traded markets or otherwise, and may have an impact on the price of the under-lying asset. If a transaction is cash settled, UBS will generally unwind or offset any hedge it has for such Structured Product in close proximity to the relevant valuation time or period. In some cases, this activity may affect the value of the Structured Product. Unless stated otherwise in this document, (i) this document is for information purposes only and should not be construed as an offer, personal recommendation or solicitation to purchase the Structured Product and should not be treated as giving investment advice, and (ii) the terms of any investment in the Structured Product will be exclusively subject to the detailed provisions, including risk considerations, contained in the more detailed legal documentation that relates to the Structured Product (being the confirmation, information memorandum, prospectus or other issuer documentation as relevant). UBS makes no representation or warranty relating to any information herein which is derived from independent sources. This document shall not be copied or reproduced without UBS’s prior written permission. In respect of any Structured Product that is a security, no action has been or will be taken in any jurisdiction that would permit a public offering of the Product, save where explicitly stated in the issuer documentation. The Structured Product must be sold in accordance with all applicable selling restrictions in the jurisdictions in which it is sold.
© UBS 2018. All rights reserved. UBS prohibits the forwarding of this information without the approval of UBS.
Weekly Hits: Gaming Industry Basket & Multinationales du pétrole2019-02-28T13:20:41+01:00

Bilanzsaison nimmt Fahrt auf

KeyInvest Blog

28. Januar 2019 – UBS Wochenkommentar Rück-/Ausblick

Bilanzsaison nimmt Fahrt auf

Kaum zu glauben, aber die Aktienmärkte zeigen sich weiterhin unbeeindruckt von den aktuellen Geschehnissen auf der politischen Weltbühne. Das beste Beispiel liefern die USA. 37 Tage hält die aktuelle Haushaltssperre in der US-Regierung in Übersee mittlerweile an, der längste «Government Shutdown» in der US-Geschichte. Den bisherigen Negativ-Rekord hielt Bill Clinton im Jahr 1995 mit 21 Tagen. Dies dürfte nicht ohne Auswirkungen auf die Wirtschaft bleiben. Einer Reuters-Umfrage vom 24. Januar zufolge wird der Shutdown das Bruttoinlandsprodukt im ersten Quartal spürbar beeinträchtigen. Im Schnitt rechnen die Volkswirte mit einer Verringerung des BIP um 0,3 Prozentpunkte.

Stabile Aktienmärkte

Der Wall Street merkt man diese Wachstumssorgen nicht an. Der S&P 500 legte seit dem Beginn der Haushaltssperre am 21. Dezember 2018 um knapp sieben Prozent zu (Stand: 25.01.2019). Aber auch in Europa zeigen sich die Anleger von den lauernden Konjunkturrisiken und des weiterhin ungelösten Brexit unbeeindruckt. Beim EURO STOXX 50 steht seit Jahresbeginn ein Plus von vier Prozent zu Buche, der SMI avancierte gar um mehr als sechs Prozent. Und selbst der britische FTSE 100 Index liegt seit Silvester im Plus.1

Während in Grossbritannien alle Augen auf Theresa May gerichtet sind, die Premierministerin muss dem Unterhaus am 29. Januar einen neuen Vorschlag unterbreiten, konzentrieren sich die Investoren auf dem europäischen Festland auf die neuesten Wirtschaftsdaten. Diese fielen zuletzt allerdings eher enttäuschend aus. So tauchte der Einkaufsmanagerindex für die Eurozone im Januar überraschend um 0,4 Punkte auf 50,7 Zähler ab, der schwächste Wert seit fünfeinhalb Jahren. Die aufziehenden Wolken am Konjunkturhimmel blieben der Europäischen Zentralbank (EZB) nicht verborgen. Auf der ersten Zinssitzung im neuen Jahr lies Chef Mario Draghi vergangenen Donnerstag durchblicken, dass die für dieses Jahr geplante Zinserhöhung wohl noch hinausgezögert werden dürfte. Folglich gehen die Geldmärkte nunmehr nur noch von einer Wahrscheinlichkeit von 40 Prozent für eine Anhebung in 2019 aus, vor der EZB-Sitzung waren es noch 45 Prozent. (Quelle: Thomson Reuters, Medienbericht, 24.01.2019)

Positive Berichterstattung

Eine weiterhin expansive Geldpolitik wird an den Aktienmärkten gerne gesehen. Darüber hinaus bekommen die Kurse derzeit von der angelaufenen Bilanzsaison Unterstützung. 22 Prozent der S&P 500-Mitglieder haben bereits Ergebnisse für das vierte Quartal 2018 gemeldet, 71 Prozent davon schnitten beim Gewinn je Aktie besser als erwartet ab. Insgesamt liegen die Ergebnisse im Durchschnitt 3,0 Prozent über den Schätzungen. Aktuell beträgt die Gewinnwachstumsrate für den S&P 500 10,9 Prozent. Sollte es dabei bleiben, wäre dies das erste Mal seit dem vierten Quartal 2017, dass die Steigerungsrate unter der 20-Prozent-Marke liegt. (Quelle: Factset 25.01.2019)

Noch nicht besonders gross in Erscheinung getreten ist der Technologiesektor in der aktuellen Zahlensaison. Ein erstes Highlight setzte IBM. «Big Blue» konnte die Erwartungen der Analysten unter anderem dank gut laufender Geschäfte in einigen der neueren Bereiche wie Cloud, Datenanalyse und künstlicher Intelligenz übertreffen. Ab der laufenden Woche kommt nun Bewegung in den Sektor. Mit Apple, Microsoft, Facebook, Amazon und Alphabet – um nur einige zu nennen – gewähren die Schwergewichte in den kommenden Tagen Einblick in ihre Bücher. Passend dazu steht noch bis zum 30. Januar ein Worst of Kick-In GOAL auf das Tech-Trio Facebook, Alphabet und Microsoft (Symbol: KDAHDU) in Zeichnung. Die Konditionen: Ein Coupon von 9.00% p.a. sowie eine Barriere bei 60 Prozent der Starkurse.2

Spannendes Pharma-Duo

Aber auch hierzulande kommt die Bilanzsaison allmählich in Fahrt. Zum Beispiel werden die SMI-Schwergewichte Roche und Novartis ihre Zahlenkränze vorstellen. Beim Erstgenannten geht der Markt davon aus, dass die Profitabilität im zweiten Halbjahr 2018 aufgrund eines erwarteten Margenrückgangs in der Division Diagnostics leicht zurückgehen wird. Besonders spannend dürfte bei Roche der Ausblick werden: Hier erwartet der Markt nämlich ein Übergangsjahr. Der von Thomson Reuters veröffentlichte Analystenkonsens rechnet mit einem stagnierenden Ergebnis je Aktie. Auch bei Novartis dürfte sich der Fokus der Investoren auf die Prognose für das Geschäftsjahr 2019 konzentrieren. Anders als bei Roche geht der Konsens hier von einer weiteren Margenausweitung aus, die zu einem Wachstum des Kerngewinns führen soll. Nach einem erwarteten Profit von 5,09 US-Dollar je Aktie in 2018 wird ein Gewinn von 5,33 US-Dollar in 2019 erwartet – ein Plus von 2,9 Prozent. (Quelle: UBS IB Research, Stand: 18.01.2019)

Wichtige Unternehmenstermine

Datum Quartalszahlen
29.01.2019 Apple
30.01.2019 Novartis
30.01.2019 Tesla
30.01.2019 Alibaba
30.01.2019 Facebook
30.01.2019 Microsoft
31.01.2019 Roche
31.01.2019 Amazon
04.02.2019 Alphabet

Quelle: Thomson Reuters, 25.01.2019

1) Bitte beachten Sie, dass vergangene Wertentwicklungen keine Indikationen für künftige Wertentwicklungen sind.
2) Risikohinweis: Kick-In GOALs sind nicht kapitalgeschützt. Notiert einer der Basiswerte während der Laufzeit einmal auf oder unter dem jeweiligen Kick-In Level, kann die Tilgung am Verfalltag durch Bartilgung entsprechend der (vom Strike aus) schwächsten Performance aus dem Trio erfolgen (höchstens jedoch zum Nominalwert zuzüglich Coupon). In diesem Fall sind Verluste wahrscheinlich. Zudem trägt der Anleger bei strukturierten Produkten das Emittentenrisiko, so dass das eingesetzte Kapital – unabhängig von der Entwicklung des Basiswertes – im Falle einer Insolvenz der UBS AG verloren gehen kann.

Weitere Blogeinträge:

Der Herbst ist da

Zum Herbstanfang meinte es das Wetter mit den Bewohnern von weiten Teilen Europas und Nordamerikas gut. In vielen Regionen strahlte die Sonne. Dagegen gab der Herbst an den Börsen diesseits wie jenseits des Atlantiks einen gebührenden Einstand.

Spannungsgeladene Woche

Das Wichtigste vorweg: In den kommenden Tagen kommt es zum Showdown bei den grossen Notenbanken.

Epochale Entscheidungen

Einen historischen Zinsschritt hat die Europäische Zentralbank (EZB) in der vergangenen Woche unternommen. Zum ersten Mal seit der Einführung des Euro-Bargeldes 2002 schraubten die Währungshüter die Leitzinsen um 0.75 Prozentpunkte nach oben.

Bilanzsaison nimmt Fahrt auf2019-01-28T08:02:59+01:00

Weekly Hits: Fusions et acquisitions & Netflix

KeyInvest Weekly Hits

Vendredi, 25.01.2019

  • Thème 1: Fusions et acquisitions - Chasse à la prime systématique
  • Thème 2: Netflix - Bien placée dans la course

Fusions et acquisitions
Chasse à la prime systématique

Sur le marché suisse des fusions et des acquisitions, qu’on appelle Mergers & Acquisitions (M&A) dans le jargon professionnel, l’année 2019 a commencé sur un coup d’éclat : le 16 janvier, le groupe de logistique DSV a lancé une offre non contraignante sur Panalpina. Les Danois se sont déclarés prêts à payer en titres et en numéraire en mettant 170 francs par action sur la table. Le prix proposé dépassait ainsi de 24,1% le cours de clôture du titre Panalpina le jour précédant la publication de l’offre.¹ Cet exemple illustre une nouvelle fois le potentiel de gain que recèlent les activités M&A pour les investisseurs. Une chasse aux primes de reprise systématique est possible avec l’Open End PERLES (symbole : MANDAU) sur le Solactive M&A Europa Total Return Index. Ce produit de participation reproduit fidèlement l’indice composé de 40 candidats potentiels au rachat.

De toute évidence, certains investisseurs misent sur l’entrée en jeu d’un autre acquéreur potentiel pour Panalpina. En effet, une semaine après l’offensive de DSV, le cours de l’action de l’entreprise de logistique dépassait de pratiquement sept francs le prix proposé. Kühne+Nagel est considéré comme un candidat possible pour une contre-offre. Le représentant de la branche suisse avait déjà manifesté son intérêt pour Panalpina à l’automne dernier. Interrogée par l’agence de presse Reuters, la société Kühne+Nagel n’a toutefois pas souhaité s’exprimer sur le sujet. (Source : Thomson Reuters, article de presse, 16.01.19)

En tout cas, le fait que DSV cible la mid cap suisse souligne l’intensité des activités sur le marché M&A suisse. Selon une étude récente réalisée par KPMG, le nombre de transactions a progressé l’an dernier de 24,8% pour s’établir à 493. D’après la société de conseil et d’audit, il s’agit là du nombre le plus élevé enregistré depuis le début de l’enquête en 2007. En termes de volumes, les experts constatent même une croissance disproportionnée: ces derniers ont augmenté de 30,9% pour se fixer à 101,5 milliards de dollars américains. Mais cela reste encore loin du record de 2014 avec ses 188,1 milliards de dollars américains. La plus grosse transaction de l’année a impliqué un poids lourd du SMI™ : Novartis a vendu une participation de 36,5% dans une joint-venture commune à son partenaire GlaxoSmithKline pour la somme de 13 milliards de dollars américains. (Source : KPMG, communiqué de presse, 16 janvier 2019)
La seule entreprise suisse faisant actuellement partie du M&A Europe Index est issue du même secteur que ces deux grands groupes. Vifor Pharma compte parmi les 40 titres qui réussissent aujourd’hui le processus de sélection en plusieurs étapes. Pour commencer, la méthodologie indicielle définit certains critères dans le domaine de la liquidité commerciale et de la capitalisation de marché. Toutes les actions qui satisfont ces exigences quantitatives sont ensuite examinées au moyen d’indicateurs boursiers connus. Outre les prévisions moyennes des analystes concernant le bénéfice par action pour l’exercice fiscal suivant (FY1 IBES EPS), le ratio cours/valeur comptable (CVC) et la croissance annuelle du chiffre d’affaires doivent être positifs.
Les titres qui au regard du CVC sont surévalués par rapport à leur secteur sont exclus. Il en va de même pour les entreprises dont l’évaluation EPS moyenne s’inscrit en-dessous de la médiane du secteur. Parmi les entreprises restantes, les 40 affichant la plus importante croissance de leur chiffre d’affaires entrent dans l’indice sans pondération. Chaque trimestre, Solactive procède à un examen et effectue les adaptations nécessaires le cas échéant – ce faisant, elle restaure l’équipondération des 40 composantes.

Opportunités: avec l’Open End PERLES (symbole: MANDAU), une commande suffit pour intégrer dans le portefeuille cette stratégie M&A dynamique ciblant le Vieux Continent. Le produit reproduit passivement le sous-jacent après déduction de la commission de gestion de 0,75% p.a. sans limitation de durée. Les investisseurs profitent également des distributions des actions qu’il contient – les éventuels dividendes nets sont réinvestis dans l’indice.

Risques: les Open End PERLES ne bénéficient d’aucune protection du capital. Il peut y avoir des pertes lorsque l’indice sous-jacent baisse. Il faut également prendre en compte le risque de change, car la monnaie des membres de l’indice peut être différente de celle dans laquelle le certificat présenté est négocié. Par ailleurs, avec les produits structurés, l’investisseur supporte le risque d’émetteur. Cela signifie qu’en cas d’insolvabilité d’UBS SA, le capital investi peut être perdu, indépendamment de l’évolution du sous-jacent.

Vous trouverez davantage de produits UBS et des informations sur les opportunités et les risques à l’adresse ubs.com/keyinvest.

Solactive M&A Europe TR Index vs. EURO STOXX 50™ TR
Index (5 ans, aux fins d’illustration uniquement, données en %)

Après la récente correction boursière, l’indice M&A a perdu son avance de longue date vis-à-vis de l’EURO STOXX 50™ Index mais il pourrait à nouveau se distancer début 2019.

Source: UBS AG, Bloomberg

Valeurs du: 23.01.2019

Solactive M&A Europe TR Index: pondération par pays

Actuellement, ce sont les entreprises françaises qui donnent le ton dans le Solactive M&A Europa TR Index. Sinon, seules les actions allemandes et britanniques enregistrent encore une pondération à deux chiffres en pourcentage.

Source: UBS AG, Bloomberg

Valeurs du: 23.01.2019

¹) La performance passée n’indique pas les résultats futures.
²) Les condition des ETTs sont vérifiés annuellement et peuvent être ajustées avec un délai de 13 mois après la publication.

Open End PERLES sur Solactive M&A Europe Total Return Index

Symbol MANDAU
SVSP Name Tracker Certifikat
SPVSP Code 1300
Sous-jacent Solactive M&A Europe Total Return Index
Devise EUR
Rapport de souscription 1:1
Frais de gestion 0.75% p.a.
Participation 100%
Echéance Open End
Émetteur UBS AG, London
Bid/Ask EUR 176.20 / 178.00
 

Key facts Solactive M&A Europe Total Return Index

ISIN DE000SLA16H5
Sponsor de l’indice Solactive AG
Devise de l’indice EUR
Composants de l’indice 40
Dividendes réinvesti (Total Return Index)
Prix actuel 182.10
Sous-jacent / date 100 / 01.03.2010
 

Vous trouverez davantage de produits UBS et des informations sur les opportunités et les risques à l’adresse ubs.com/keyinvest.

Source: UBS AG, Bloomberg

Valeurs du: 23.01.2019

Apérçu du marché

Index Citation Semaine¹
SMI™ 8’957.19 0.9%
SLI™ 1’390.66 1.2%
S&P 500™ 2’638.70 0.9%
Euro STOXX 50™ 3’112.13 1.1%
S&P™ BRIC 40 4’025.73 0.3%
CMCI™ Compos. 896.53 0.4%
Gold (troy ounce) 1’284.00 USD -0.8%

¹ Changement basé sur le cours de clôture du jour précédent par rapport au cours de clôture de la semaine dernière.

SMI™ vs. VSMI™ 1 année

L’index VSMI™ est calculé depuis 2005. Il affiche la volatilité des actions inclus dans le SMI™ index. Pour la calculation, un portefeuille est utilisé qui ne réagit qu’au variations de la volatilité au lieu des variations des prix. En le faisant, la méthodologie du VSMI™ utilise la volatilité carré, connu sous le terme variance, des options sur le SMI avec 30 jours jusqu’à l’échéance négociées à la Bourse Eurex.

Source: UBS AG, Bloomberg

Valeurs du: 23.01.2019

Netflix
Bien placée dans la course

Une fois de plus, l’action Netflix tient Wall Street en haleine. Depuis le début de l’année, la valeur du prestataire de vidéos en ligne a gagné 26%. Le titre a ainsi encore consolidé son avance à long terme vis-à-vis du NASDAQ-100 Index (cf. graphique).¹ Même si ce fleuron de la technologie ralentissait le rythme, un rendement latéral attrayant de près de 16% serait possible avec le Kick-In Goal (symbole: KCEFDU). Actuellement 37% séparent le sous-jacent de la barrière.

Depuis des années, Netflix secoue considérablement le secteur des médias. Le prestataire de vidéos en ligne est aujourd’hui même sur le point de remporter le plus important prix cinématographique au monde. En effet, la production Netflix «Roma» est nominée dix fois dans la course aux Oscars de cette année, notamment dans la catégorie du meilleur film. Si le film devait effectivement recevoir le trophée tant convoité, cela constituerait une nouvelle étape importante pour Netflix. (Source : Thomson Reuters, article de presse, 22/01/2019)

Sur le plan opérationnel, l’entreprise a poursuivi sur la voie de la croissance en 2018. Pour le seul quatrième trimestre, Netflix a déclaré 8,8 millions de nouveaux clients payants – un chiffre encore jamais atteint sur un trimestre. Dans l’ensemble, le prestataire compte désormais 139 millions d’abonnés. En revanche, les perspectives de l’entreprise ont suscité peu d’enthousiasme à Wall Street. Pour le premier trimestre en cours, la direction souhaite réaliser un bénéfice de 253 millions de dollars avec un chiffre d’affaires de tout juste 4,5 milliards de dollars. Ces projections restent bien en deçà des attentes des analystes. À la suite de ce message, l’euphorie également suscitée par l’annonce de hausses de prix est quelque peu retombée autour du titre Nasdaq. (Source : Thomson Reuters, article de presse, 18.01.2019)

Opportunités: bien que le Kick-In GOAL (symbole : KCEFDU) ait réussi à regagner du terrain après la reprise du cours de Netflix, la cote du produit structuré s’est établie bien dessous de la barre des 100%. Il en résulte donc une opportunité de rendement légèrement supérieure au coupon. À l’échéance, le Kick-In GOAL laisse entrevoir un rendement de 20,0% p.a. Condition : Netflix ne doit pas atteindre ou franchir la barrière de 208,566 dollars américains. À l’heure actuelle, le sous-jacent dispose d’une marge de sécurité de 36,6%.

Risques: il n’existe aucune protection du capital pour le produit présenté. Si pendant la durée de l’investissement Netflix atteint ou franchit une seule fois le Kick-In Level (barrière), la cote du sous-jacent doit remonter au moins au niveau du Strike Level à l’échéance. Dans le cas contraire, le remboursement sera réduit à hauteur du repli de l’action Netflix. Dans un tel cas, des pertes sont probables. Par ailleurs, avec les produits structurés, l’investisseur supporte le risque d’émetteur. Cela signifie qu’en cas d’insolvabilité d’UBS SA, le capital investi peut être perdu, indépendamment de l’évolution du sous-jacent.

Vous trouverez davantage de produits UBS et des informations sur les opportunités et les risques à l’adresse ubs.com/keyinvest.

Netflix vs. Nasdaq-100 Index
(5 ans, aux fins d’illustration uniquement, données en %)

Source: UBS AG, Bloomberg

Valeurs du: 23.01.2019

10.00% p.a. Kick-In GOAL sur Netflix

Symbol KCEFDU
SVSP Name Barrier Reverse Convertible
SPVSP Code 1230
Sous-jacent Netflix
Devise USD
Coupon 10.00% p.a.
Rendement latéraux 13.93% (18.02% p.a.)
Kick-In Level (Distance) USD 208.566 (35.56%)
Echéance 07.11.2019
Émetteur UBS AG, London
Bid / Ask 93.14% / 94.14%
 

Vous trouverez davantage de produits UBS et des informations sur les opportunités et les risques à l’adresse ubs.com/keyinvest.

Source: UBS AG, Bloomberg

Valeurs du: 23.01.2019

¹) La performance passée n’indique pas les résultats futures.
²) Les condition des ETTs sont vérifiés annuellement et peuvent être ajustées avec un délai de 13 mois après la publication.

This material has been prepared by UBS AG or one of its affiliates («UBS»). This material is for distribution only as permitted by law. It is not prepared for the needs of any specific recipient. It is published solely for information and is not a solicitation or offer to buy or sell any securities or related financial instruments (“Instruments”). UBS makes no representation or warranty, either express or implied, on the completeness or reliability of the information contained in this document (“Information”) except that concerning UBS AG and its affiliates. The Information should not be regarded by recipients as a substitute for using their own judgment. Any opinions expressed in this material may change without notice and may be contrary to opinions expressed by other business areas of UBS as a result of using different assumptions or criteria. UBS is under no obligation to update the Information. UBS, its officers, employees or clients may have or have had an interest in the Instruments and may at any time transact in them. UBS may have or have had a relationship with entities referred to in the Information. Neither UBS nor any of its affiliates, or their officers or employees, accepts any liability for any loss arising from use of the Information. This presentation is not a basis for entering into a transaction. Any transaction between you and UBS will be subject to the detailed provisions of the term sheet, confirmation or electronic matching systems relating to that transaction. Clients wishing to effect transactions should contact their local sales representative.
This information is communicated by UBS AG and/or its affiliates («UBS»). * (see below) UBS may from time to time, as principal or agent, have positions in, or may buy or sell, or make a market in any securities, currencies, financial instruments or other assets underlying the product to which this website relates (the «Structured Product»). UBS may provide investment banking and other services to and/or have officers who serve as directors of the companies referred to in this website. UBS’s trading and/or hedging activities related to the Structured Product may have an impact on the price of the underlying asset and may affect the likelihood that any relevant barrier or relevant trigger event is crossed or triggered. UBS has policies and procedures designed to minimise the risk that officers and employees are influenced by any conflicting interest or duty and that confidential information is improperly disclosed or made available. UBS may pay or receive brokerage or retrocession fees in connection with the Structured Product described herein. In respect of any Structured Product that is a security, UBS may, in certain circumstances, sell the Structured Product to dealers and other financial institutions at a discount to the issue price or rebate to them for their own account some proportion of the issue price. Further information is available on request. Structured Products are complex and may involve a high risk of loss. Prior to purchasing the Structured Product you should consult with your own legal, regulatory, tax, financial and accounting advisors to the extent you consider it necessary, and make your own investment, hedging and trading decisions (including decisions regarding the suitability of the Structured Product) based upon your own judgement and advice from those advisers you consider necessary. Save as otherwise expressly agreed in writing, UBS is not acting as your financial adviser or fiduciary in relation to the Product. UBS generally hedges its exposure to Structured Products, although it may elect not to hedge or to partially hedge any Structured Product. UBS’s hedging activity may be conducted through transactions in the underlying asset, index or instrument or in options, futures or other derivatives related to the underlying asset, index or instrument on publicly traded markets or otherwise, and may have an impact on the price of the under-lying asset. If a transaction is cash settled, UBS will generally unwind or offset any hedge it has for such Structured Product in close proximity to the relevant valuation time or period. In some cases, this activity may affect the value of the Structured Product. Unless stated otherwise in this document, (i) this document is for information purposes only and should not be construed as an offer, personal recommendation or solicitation to purchase the Structured Product and should not be treated as giving investment advice, and (ii) the terms of any investment in the Structured Product will be exclusively subject to the detailed provisions, including risk considerations, contained in the more detailed legal documentation that relates to the Structured Product (being the confirmation, information memorandum, prospectus or other issuer documentation as relevant). UBS makes no representation or warranty relating to any information herein which is derived from independent sources. This document shall not be copied or reproduced without UBS’s prior written permission. In respect of any Structured Product that is a security, no action has been or will be taken in any jurisdiction that would permit a public offering of the Product, save where explicitly stated in the issuer documentation. The Structured Product must be sold in accordance with all applicable selling restrictions in the jurisdictions in which it is sold.
© UBS 2018. All rights reserved. UBS prohibits the forwarding of this information without the approval of UBS.
Weekly Hits: Fusions et acquisitions & Netflix2019-02-15T12:16:35+01:00

Weekly Hits: Mergers and acquisitions & Netflix

KeyInvest Weekly Hits

Friday, 25.01.2019

  • Topic 1: Mergers and acquisitions - Systematic premium hunting
  • Topic 2: Netflix - Performing well

Mergers and acquisitions
Systematic premium hunting

In the Swiss mergers and acquisitions (M&A) market, 2019 began with a bang: On January 16, the logistics group DSV made a non-binding offer for Panalpina. The Danes indicated that they were prepared to pay CHF 170 in cash in addition to treasury shares for each share in the company. The price offered thus represented a premium of 24.1% over the closing price fixed for Panalpina on the day prior to publication.¹ This is yet another example of how lucrative M&A events can be for investors. With Open End PERLES (symbol: MANDAU) on the Solactive M&A Europa Total Return Index, it is possible to systematically hunt for acquisition premiums. The participation product replicates the 40 potential takeover candidates in the benchmark with a subscription ratio of 1:1.

It is clear that some investors are betting on there being further bidders for Panalpina. In any case, one week after the approach by DSV, the logistics company’s shares have been trading almost seven francs higher than the offer price. One potential counterbidder would be Kühne+Nagel. The Swiss sector player already signaled its interest in Panalpina last autumn. In response to an inquiry from Reuters, Kühne+Nagel did not wish to comment on the latest developments, however. (Source: Thomson Reuters media report, 1/16/2019).

Nevertheless, DSV’s approach for the Swiss mid-cap company underlines just how active the Swiss M&A market is. According to a recent study by the consulting and audit company KPMG, the number of deals over the last year rose by 24.8% to 493, which is the highest number since the survey began in 2007. In terms of transaction volumes, the experts have observed above-average growth: This figure increased by 30.9% to USD 101.5 billion, which is still somewhat short of the record USD 188.1 billion from 2014. The largest deal of the year involved an SMI™ heavyweight: Novartis sold a 36.5% stake in a joint venture to GlaxoSmithKline for USD 13 billion. (Source: KPMG, press release, January 16, 2019)
The only Swiss company currently in the M&A Europe Index also comes from the same sector as these two major corporations. Vifor Pharma is one of a total of 40 shares to have currently made it through the multi-level selection process. The first criteria stipulated by the index methodology relate to trading liquidity and market capitalization. All shares that meet these quantitative requirements are then subjected to checks using well-known stock market indicators. In addition to the average analysts’ forecast regarding earnings per share for the upcoming fiscal year (FY1 IBES EPS), the price-to-book value (PBV) ratio and the one-year revenue growth must be positive.
Stocks that are overvalued in terms of PBV compared to their sector are not included. The same applies to companies whose average EPS estimate is below the sector median. Of the remaining stocks, the 40 companies with the strongest revenue growth are taken into the index with equal weightings. Each quarter, Solactive carries out a review and makes adjustments as necessary – this process involves restoring the 40 component stocks to equal weightings.

Opportunities: All it takes is a single order to make this dynamic, Europe-focused M&A strategy part of your portfolio with Open End PERLES (symbol: MANDAU). The product passively replicates the underlying assets without any maturity limitation after deduction of the annual management fee of 0.75% p.a. It allows investors to participate in the distributions from the shares contained in the index – any net dividends are reinvested in the benchmark.

Risks: Open End PERLES do not have capital protection. Losses will be made if the underlying index declines. The currency risk must also be taken into account, as the trading currency of some index constituents may differ from the trading currency of the certificate shown. Investors in structured products are also exposed to issuer risk, which means that the invested capital may be lost if UBS AG becomes insolvent, regardless of the performance of the underlying.

More UBS products and further information on the risks and opportunities are available at ubs.com/keyinvest.

Solactive M&A Europe TR Index vs. EURO STOXX 50™ TR Index
(5 years; for illustrative purposes only; figures in %)

In the wake of the recent stock market correction, the M&A benchmark lost its long-term advantage over the EURO STOXX 50™. However, it was able to make up some ground at the start of 2019.

Source: UBS AG, Bloomberg

As of 23.01.2019

Solactive M&A Europe TR Index: Weighting by country

French companies in the Solactive M&A Europa TR Index are currently setting the tone. German and UK shares are the only others to account for double-digit percentage weightings.

Source: UBS AG, Bloomberg

As of: 23.01.2019

¹) Please be aware that past performance does not indicate future results.
²) The conditions of ETTs are reviewed on a yearly basis and can be adjusted with a deadline of 13 months after the announcement.

Open End PERLES on Solactive M&A Europe Total Return Index

Symbol MANDAU
SVSP Name Tracker Certificates
SPVSP Code 1300
Underlying Solactive M&A Europe Total Return Index
Currency EUR
Ratio 1:1
Administration fee 0.75% p.a.
Expiry Open End
Participation 100%
Issuer UBS AG, London
Bid/Ask EUR 176.20 / 178.00
 

Key facts Solactive M&A Europe Total Return Index

ISIN DE000SLA16H5
Index Sponsor Solactive AG
Index Currency
EUR
Index Components 40
Dividend Reinvest (Total Return Index)
Coupon 14.00% p.a.
Current status
182.10
Underlying / date 100 / 01.03.2010
Issuer UBS AG, London
Subscription until 30.01.2019, 15:00 h
 

More UBS products and further information on the risks and opportunities are available at ubs.com/keyinvest.

Source: UBS AG, Bloomberg

As of: 23.01.2019

Market overview

Index Quotation Week¹
SMI™ 8’957.19 0.9%
SLI™ 1’390.66 1.2%
S&P 500™ 2’638.70 0.9%
Euro STOXX 50™ 3’112.13 1.1%
S&P™ BRIC 40 4’025.73 0.3%
CMCI™ Compos. 896.53 0.4%
Gold (troy ounce) 1’284.00 USD -0.8%

¹ Change based on the closing price of the previous day compared to the closing price a week ago.

SMI™ vs. VSMI™ 1 year

smi vs vsmi

The VSMI™ Index is calculated since 2005. It shows the volatility of the stocks within the SMI™ index. A portfolio which reacts only to changes in volatility instead of volatility itself is relevant for the calculation. Thereby, the VSMI™ methodology uses the squared volatility, known as variance, of the SMI options with remaining time to expiry of 30 days traded at the Eurex.

Source: UBS AG, Bloomberg

As of: 23.01.2019

Netflix
Performing well

The Netflix share price is once again keeping Wall Street on its toes. Since the start of the year, the streaming service provider has gained 26%, helping it to further build on its long-term lead over the NASDAQ-100 Index (see chart)¹. Even if the technology high-flyer does not maintain this pace, a minimum return of almost 16% would be possible with Kick-In GOAL (symbol: KCEFDU). At present, the underlying stock is 37% away from the barrier.

Netflix has been disrupting the media sector for many years. Now the streaming service provider also has its eyes on the greatest film awards in the world. The Netflix production “Roma” has received ten nominations for this year’s Oscars, including in the “Best Film” category. If it were to actually win this coveted prize, this would be yet another key milestone for Netflix. (Source: Thomson Reuters media report, January 22, 2019).

In operational terms, the company continued to grow in 2018. In the fourth quarter alone, Netflix attracted 8.8 million new customers – more than in any other previous quarter. The company now has 139 million subscribers. By contrast, Wall Street was less impressed with its outlook. For the ongoing first quarter, the company’s management are expecting revenues of almost USD 4.5 billion, with a profit of USD 253 million. This forecast is significantly below previous analyst expectations. In light of this, the euphoria surrounding the Nasdaq share, which was sparked by the announcement of price increases, abated somewhat. (Source: Thomson Reuters media report, January 18, 2019).

Opportunities: Although Kick-In GOAL (symbol: KCEFDU) was able to make up some ground following the recent price rally by Netflix, the structured product is trading some way below the 100% mark. This means there is a return opportunity, which is somewhat larger than the coupon. On maturity, there is the prospect of income amounting to 20% p.a. for Kick-In GOAL. This requires that Netflix does not fall to or below the barrier of USD 208.566. At present, the underlying stock has a safety buffer of 36.6%

Risks: This product does not have capital protection. If Netflix falls to or below the kick-in level (barrier) once during the term, the underlying stock has to be trading at least at the strike level on maturity. Otherwise, the amount repaid will fall in line with the decline in the Netflix share price. In this case, it is likely that losses will be incurred. Investors in structured products are also exposed to issuer risk, which means that the invested capital may be lost if UBS AG becomes insolvent, regardless of the performance of the underlying.

More UBS products and further information on the risks and opportunities are available at ubs.com/keyinvest.

Netflix vs. Nasdaq-100 Index
(five years, for illustrative purposes only, figures in %)¹

Source: UBS AG, Bloomberg

As of: 23.01.2019

10.00% p.a. Kick-In GOAL on Netflix

Symbol KCEFDU
SVSP Name Barrier Reverse Convertibles
SPVSP Code 1230
Underlyings Netflix
Currency USD
Coupon 10.00% p.a.
Sideways return 13.93% (18.02% p.a.)
Kick-In Level (Distance)
USD 208.566 (35.56%)
Expiry 07.11.2019
Issuer UBS AG, London
Bid/Ask 93.14% / 94.14%
 

More UBS products and further information on the risks and opportunities are available at ubs.com/keyinvest.

Source: UBS AG, Bloomberg

As of: 23.01.2019

¹) Please be aware that past performance does not indicate future results.
²) The conditions of ETTs are reviewed on a yearly basis and can be adjusted with a deadline of 13 months after the announcement.

This material has been prepared by UBS AG or one of its affiliates («UBS»). This material is for distribution only as permitted by law. It is not prepared for the needs of any specific recipient. It is published solely for information and is not a solicitation or offer to buy or sell any securities or related financial instruments (“Instruments”). UBS makes no representation or warranty, either express or implied, on the completeness or reliability of the information contained in this document (“Information”) except that concerning UBS AG and its affiliates. The Information should not be regarded by recipients as a substitute for using their own judgment. Any opinions expressed in this material may change without notice and may be contrary to opinions expressed by other business areas of UBS as a result of using different assumptions or criteria. UBS is under no obligation to update the Information. UBS, its officers, employees or clients may have or have had an interest in the Instruments and may at any time transact in them. UBS may have or have had a relationship with entities referred to in the Information. Neither UBS nor any of its affiliates, or their officers or employees, accepts any liability for any loss arising from use of the Information. This presentation is not a basis for entering into a transaction. Any transaction between you and UBS will be subject to the detailed provisions of the term sheet, confirmation or electronic matching systems relating to that transaction. Clients wishing to effect transactions should contact their local sales representative.
This information is communicated by UBS AG and/or its affiliates («UBS»). * (see below) UBS may from time to time, as principal or agent, have positions in, or may buy or sell, or make a market in any securities, currencies, financial instruments or other assets underlying the product to which this website relates (the «Structured Product»). UBS may provide investment banking and other services to and/or have officers who serve as directors of the companies referred to in this website. UBS’s trading and/or hedging activities related to the Structured Product may have an impact on the price of the underlying asset and may affect the likelihood that any relevant barrier or relevant trigger event is crossed or triggered. UBS has policies and procedures designed to minimise the risk that officers and employees are influenced by any conflicting interest or duty and that confidential information is improperly disclosed or made available. UBS may pay or receive brokerage or retrocession fees in connection with the Structured Product described herein. In respect of any Structured Product that is a security, UBS may, in certain circumstances, sell the Structured Product to dealers and other financial institutions at a discount to the issue price or rebate to them for their own account some proportion of the issue price. Further information is available on request. Structured Products are complex and may involve a high risk of loss. Prior to purchasing the Structured Product you should consult with your own legal, regulatory, tax, financial and accounting advisors to the extent you consider it necessary, and make your own investment, hedging and trading decisions (including decisions regarding the suitability of the Structured Product) based upon your own judgement and advice from those advisers you consider necessary. Save as otherwise expressly agreed in writing, UBS is not acting as your financial adviser or fiduciary in relation to the Product. UBS generally hedges its exposure to Structured Products, although it may elect not to hedge or to partially hedge any Structured Product. UBS’s hedging activity may be conducted through transactions in the underlying asset, index or instrument or in options, futures or other derivatives related to the underlying asset, index or instrument on publicly traded markets or otherwise, and may have an impact on the price of the under-lying asset. If a transaction is cash settled, UBS will generally unwind or offset any hedge it has for such Structured Product in close proximity to the relevant valuation time or period. In some cases, this activity may affect the value of the Structured Product. Unless stated otherwise in this document, (i) this document is for information purposes only and should not be construed as an offer, personal recommendation or solicitation to purchase the Structured Product and should not be treated as giving investment advice, and (ii) the terms of any investment in the Structured Product will be exclusively subject to the detailed provisions, including risk considerations, contained in the more detailed legal documentation that relates to the Structured Product (being the confirmation, information memorandum, prospectus or other issuer documentation as relevant). UBS makes no representation or warranty relating to any information herein which is derived from independent sources. This document shall not be copied or reproduced without UBS’s prior written permission. In respect of any Structured Product that is a security, no action has been or will be taken in any jurisdiction that would permit a public offering of the Product, save where explicitly stated in the issuer documentation. The Structured Product must be sold in accordance with all applicable selling restrictions in the jurisdictions in which it is sold.
© UBS 2018. All rights reserved. UBS prohibits the forwarding of this information without the approval of UBS.
Weekly Hits: Mergers and acquisitions & Netflix2019-02-15T12:08:16+01:00

Die Politik gibt weiterhin den Ton an

KeyInvest Blog

21. Januar 2019 – UBS Wochenkommentar Rück-/Ausblick

Die Politik gibt weiterhin den Ton an

Noch immer übertönt das politische Gepolter alles andere. Brexit, Handelskrieg, ein Government Shutdown – die Themen bleiben im Wesentlichen die gleichen. Doch anders als noch vor ein paar Wochen, scheint das Gehör der Investoren nachzulassen. Hätte das Scheitern des Brexit-Deals, wie am vergangenen Mittwoch geschehen, im Dezember die Kurse höchstwahrscheinlich noch unter Druck gesetzt, legten sie nun sogar leicht zu.

Grossbritannien bleibt zwar auch in der neuen Woche auf der Agenda, Premierministerin Theresa May wird nun einige Änderungen an ihrem Abkommen mit der EU vornehmen und diese präsentieren (nach Radaktionsschluss). Doch wie immer sie auch ausfallen werden, die aktuelle Stimmung an den Börsen zeigt, dass die Anlegergemeinde weiterhin auf einen «weichen Brexit» hofft. Interessant könnte es sowohl aus politischer wie auch aus wirtschaftlicher Sicht zudem vom 22. bis 25. Januar werden. Dann versammeln sich im Schweizer Bergort Davos wieder führende Politiker, Wirtschaftsexperten und Unternehmenslenker aus aller Welt auf dem 48. Weltwirtschaftsforum. Hochrangige Staatsmänner wie US-Präsident Donald Trump sowie der chinesische Staatschef Xi Jinping sind allerdings nicht mit von der Partie.

Die Banken im Visier

Der Fokus der Märkte wechselt trotz aller politischer Ereignisse derzeit wieder verstärkt von der Makro- zur Mikroökonomie. Denn die Unternehmen haben bereits damit begonnen, ihre Bücher für das abgelaufene Geschäftsjahr zu öffnen. Die Vorreiter waren die US-Banken. Und diese glänzten zum Teil mit Rekordergebnissen – der US-Unternehmenssteuer sei Dank. So zum Beispiel die Bank of America. Die zweitgrösste Bank der USA steigerte ihren Gewinn im vierten Quartal um mehr als das Dreifache auf 7,3 Milliarden Dollar. Doch auch ohne Sondereffekte der Steuerreform läge das Plus bei beachtlichen 39 Prozent. Ebenfalls positiv überraschen konnten Goldman Sachs, die Citigroup und JP Morgan.

Ob das ein gutes Omen für die europäische Geldhäuser ist, wird sich schon bald zeigen. Am 22. Januar eröffnet die UBS die Bilanzsaison der Schweizer Banken, am 1. Februar zieht die Deutsche Bank nach und am 14. Februar wird die Credit Suisse zusammen mit der Commerzbank ihre Bücher offenlegen. Die guten Berichte aus den USA sorgten auch bei hiesigen Valoren zuletzt für Kursaufschläge. Mit prozentual zweistelligen Gewinnen befinden sich Julius Bär und Credit Suisse unter den Top drei im SMI seit Silvester.

Im Aufwärtstrend

Dass die Bank-Aktien generell derzeit auf Outperformance-Kurs, zeigt sich mit Blick auf den Sektor-Index. Während der STOXX Europe 600 in diesem Jahr um 3,2 Prozent avancierte, bewegte sich der STOXX Europe 600 Banks knapp doppelt so schnell nach oben.1 (Stand: 18.01.2019) Damit versucht die Branche das Gap zum Gesamtmarkt, das sich auf knapp 20 Prozentpunkte auf Sicht von einem Jahr beläuft, etwas zu schliessen (siehe Chart). Wer mittelfristig höhere Kurse bei den Finanztiteln erwartet, für den könnte der ETT (Symbol: ETBAN) auf den STOXX Europe 600 Banks EUR Net Return Index. Das Produkt bietet eine 1:1-Partizipation und kommt aktuell ohne jährliche Verwaltungsgebühr aus.2

SMI-Konzerne öffnen ihre Bücher

Die «Earnings Season» hierzulande im Blue Chip-Segment hat bereits Richemont eröffnet. Anders als das Gros der Konzerne berichtete der Luxusgüterkonzern nicht über das vierte Quartal, sondern aufgrund seines gebrochenen Geschäftsjahres über das dritte. Wie dem auch sein, letzten Endes setzte Richemont mit insgesamt 3,92 Milliarden Euro ein Viertel mehr um als im Vorjahr und konnte die Erwartungen der Analysten schlagen. Gewinnzahlen wird der Uhren- und Schmuckverkäufer erst wieder im Mai bei der Präsentation der Jahresbilanz veröffentlichen.

Einen knappen Einblick in den Geschäftsverkauf gestattete auch Geberit. Der Sanitärtechnikkonzern steigerte seine Erlöse im vergangenen Jahr um knapp sechs Prozent auf 3,1 Milliarden Franken. Damit wurde erstmals in der Geschichte des Unternehmens die Drei-Milliarden-Grenze passiert. Die Ebitda-Marge lag voraussichtlich bei 28 Prozent und somit in etwa auf dem Vorjahresniveau. Mit der Entwicklung konnte der Sanitärspezialist die Markterwartungen erfüllen. Das komplette Zahlenwerk wird Geberit am 12. März vorstellen. Damit ist der Start in die Bilanzsaison in der Schweiz bereits gelungen. Die kommenden Tage werden zeigen, ob sich die positive Entwicklung auch fortsetzen kann. Nachfolgend haben wir Ihnen die noch im Januar anstehenden Termine der SMI-Mitglieder übersichtlich aufbereitet.

Wichtige Unternehmenstermine SMI-Mitglieder im Januar

Datum Bilanzvorlage 2019
22.01.2019 UBS
22.01.2019 SGS
25.01.2019 Givaudan
30.01.2019 Novartis
30.01.2019 Lonza
31.01.2019 Roche

Quelle: Thomson Reuters

STOXX Europe 600 Banks Index vs. STOXX Europe 600 Index

1) Bitte beachten Sie, dass vergangene Wertentwicklungen keine Indikationen für künftige Wertentwicklungen sind.
2) Die Konditionen der ETTs werden jährlich überprüft und können mit einer Frist von 13 Monaten nach Bekanntgabe angepasst werden.

Weitere Blogeinträge:

Der Herbst ist da

Zum Herbstanfang meinte es das Wetter mit den Bewohnern von weiten Teilen Europas und Nordamerikas gut. In vielen Regionen strahlte die Sonne. Dagegen gab der Herbst an den Börsen diesseits wie jenseits des Atlantiks einen gebührenden Einstand.

Spannungsgeladene Woche

Das Wichtigste vorweg: In den kommenden Tagen kommt es zum Showdown bei den grossen Notenbanken.

Epochale Entscheidungen

Einen historischen Zinsschritt hat die Europäische Zentralbank (EZB) in der vergangenen Woche unternommen. Zum ersten Mal seit der Einführung des Euro-Bargeldes 2002 schraubten die Währungshüter die Leitzinsen um 0.75 Prozentpunkte nach oben.

Die Politik gibt weiterhin den Ton an2019-01-21T10:19:35+01:00

Weekly Hits: Or, Airbus & Boeing

KeyInvest Weekly Hits

Vendredi, 18.01.2019

  • Thème 1: Or - Un besoin de sécurité accru
  • Thème 2: Airbus / Boeing - Un duel transatlantique

Or
Un besoin de sécurité accru

La Chambre basse britannique a rejeté l’accord de sortie de l’UE négocié par la première ministre Theresa May avec Bruxelles. Bien que la cheffe du gouvernement travaille désormais à un « plan B », le risque d’un Brexit sans accord a augmenté. Il n’est donc pas étonnant que les investisseurs se retournent davantage vers la monnaie de crise qu’est l’or (l’or a augmenté de 3,7% depuis le 10 décembre 2018).¹ L’ETC (symbole CGCCIU) offre un accès transparent et efficace à l’important métal précieux. Le produit participe à l’identique à l’évolution de l’indice UBS Bloomberg CMCI Gold CHF Monthly Hedged TR. Les bénéficiaires de la hausse des prix de l’or sont notamment des producteurs de métal précieux comme Kinross Gold, FreeportMcRoRan et Barrick Gold. Ce trio constitue la base d’un Early Redemption (ER) Kick-In GOAL (symbole : KDAIDU). Avec le produit en souscription, les investisseurs peuvent prévoir un versement ferme de coupon d’un montant de 14,00% p.a. Par ailleurs, les trois actions très sensibles aux fluctuations débutent la période avec des barrières basses de 50% du niveau de cours d’origine.

Si seuls 202 députés ont approuvé l’accord de Brexit, une nette majorité de 432 parlementaires l’ont rejeté. Toutefois, Theresa May a relevé le défi du vote de la Chambre basse et annoncé un plan pour la procédure ultérieure. Il est possible que les choses s’arrêtent avant, car le leader de l’opposition Jeremy Corbyn a annoncé le dépôt d’une motion de défiance. (Source : Thomson Reuters, article de presse, 16.01.2019). Comme toujours, tout d’abord, le prix de l’or n’a que très faiblement réagi à la défaite fracassante du gouvernement britannique. Toutefois, le prix de l’once fine avait nettement augmenté en amont. Sur trois mois, le principal métal précieux a gagné 6 ;1% de sa valeur.¹ En plus des turbulences liées au Brexit, le conflit douanier entre les Etats-Unis et la Chine a incité les investisseurs à viser la valeur refuge.

D’autant plus que ce désaccord non résolu se répercute toujours davantage sur l’économie réelle. Par exemple, pour décembre, la Chine a annoncé un recul de 7,6% des importations par rapport à l’année précédente. Dans le même temps, les exportations ont diminué de 4,4%. Les analystes prévoyaient une croissance de ces deux chiffres repère. (Source : Thomson Reuters, article de presse, 15.01.2019).
Les actions du secteur minier se sont signalées suite à la hausse des prix du métal précieux. Par ailleurs, le secteur a attiré l’attention par une reprise : le groupe américain Newmont Mining rachète son concurrent canadien Goldcorp pour dix milliards de dollars US. Si l’accord est réellement conclu, ce sera la naissance de la plus grande entreprise aurifère du monde. En septembre 2018, Barrick Gold s’était emparée de Randgold Ressources. Cette acquisition a atteint un volume de 6,1 milliards de dollars US. (Source : Thomson Reuters, article de presse, 14.01.2019).

Opportunités: avec l’ETC (symbole : CGCCIU) sur l’indice UBS Bloomberg CMCI Gold CHF Monthly Hedged TR, les investisseurs peuvent intégrer simplement et à bon compte cette monnaie de crise à leur portefeuille. Le sous-jacent et le produit sont libellés en francs suisses. Les fluctuations de la valeur locale par rapport à la monnaie des matières premières qu’est le dollar sont couvertes sur une base mensuelle. L’Early Redemption Kick-In GOAL (symbole : KDAIDU) sur Kinross Gold, FreeportMcMoRan et Barrick Gold offre un positionnement avec couverture partielle dans le secteur minier. Tant qu’aucun sous-jacent n’atteint la barrière de 50% ou ne passe en-dessous pendant la période, le produit générera un rendement de 14,00% p.a. à l’échéance. Il est possible que les investisseurs touchent ce rendement par anticipation. Avec la fonction « Early Redemption », une échéance anticipée est possible.

Risques: les produits présentés n’offrent pas de protection du capital. Il peut y avoir des pertes avec l’ETC lorsque l’indice sous-jacent baisse. Si, pendant la durée de l’investissement, un des sous-jacents de l’ER Kick-In GOAL atteint une seule fois sa barrière respective (« Kick-In Level ») ou est inférieur à celle-ci, et que la fonction de remboursement anticipé ne s’applique pas, le montant remboursé en espèces à maturité par amortissement est basé sur la performance la plus faible (base Strike) des sous-jacents (au maximum toutefois à la valeur nominale majorée du coupon). Dans un tel cas, des pertes sont probables. Par ailleurs, avec les produits structurés, l’investisseur supporte le risque d’émetteur. Cela signifie qu’en cas d’insolvabilité d’UBS SA, le capital investi peut être perdu, indépendamment de l’évolution du sous-jacent.

Vous trouverez davantage de produits UBS et des informations sur les opportunités et les risques à l’adresse ubs.com/keyinvest.

Or (dollars US par once fine) 5 ans¹

Depuis environ trois ans, la tendance est à une forte hausse pour l’or. L’once fine est ainsi passée par de fortes fluctuations pour arriver de moins de 1100 dollars US à récemment tout juste 1300 dollars US.

Source: UBS AG, Bloomberg

Valeurs du: 16.01.2019

Kinross Gold vs. Freeport-McMoRan vs. Barrick Gold
(5 ans, aux fins d’illustration uniquement, données en %)¹

Le secteur aurifère a connu des moments assez difficiles auprès des investisseurs au cours des dernières années. Mais les cours de Kinross Gold, Freeport-McMoRan et Barrick Gold se sont quelque peu stabilisés.

Source: UBS AG, Bloomberg

Valeurs du: 16.01.2019

¹) La performance passée n’indique pas les résultats futures.
²) Les condition des ETTs sont vérifiés annuellement et peuvent être ajustées avec un délai de 13 mois après la publication.

ETC sur UBS Bloomberg CMCI Gold CHF Monthly Hedged TR Index

Symbol CGCCIU
SVSP Name Tracker Certifikat
SPVSP Code 1300
Sous-jacent UBS Bloomberg CMCI Gold CHF Monthly Hedged TR Index
Devise CHF
Rapport de souscription 10:1
Frais de gestion 0.38% p.a.
Participation 100%
Echéance Open End
Émetteur UBS AG, London
Bid/Ask CHF 77.70 / 78.05
 

14.00% p.a. Early Redemption Worst of Kick-In GOAL sur Kinross Gold / FreeportMcRoran / Goldstone

Symbol KDAIDU
SVSP Name Barrier Reverse Convertible
SPVSP Code 1230 (Auto-Callable)
Sous-jacent Kinross Gold / Freeport-McMoRan / Barrick Gold
Devise USD
Coupon 14.00% p.a.
Kick-In Level 50%
Echéance 30.01.2020
Émetteur UBS AG, London
Date de fixation du prix 30.01.2019, 15:00 h
 

Vous trouverez davantage de produits UBS et des informations sur les opportunités et les risques à l’adresse ubs.com/keyinvest.

Source: UBS AG, Bloomberg

Valeurs du: 16.01.2019

Apérçu du marché

Index Citation Semaine¹
SMI™ 8’873.77 2.1%
SLI™ 1’374.48 2.4%
S&P 500™ 2’616.10 1.2%
Euro STOXX 50™ 3’077.22 0.2%
S&P™ BRIC 40 4’012.62 1.0%
CMCI™ Compos. 893.02 -0.2%
Gold (troy ounce) 1’293.80 USD 0.1%

¹ Changement basé sur le cours de clôture du jour précédent par rapport au cours de clôture de la semaine dernière.

SMI™ vs. VSMI™ 1 année

L’index VSMI™ est calculé depuis 2005. Il affiche la volatilité des actions inclus dans le SMI™ index. Pour la calculation, un portefeuille est utilisé qui ne réagit qu’au variations de la volatilité au lieu des variations des prix. En le faisant, la méthodologie du VSMI™ utilise la volatilité carré, connu sous le terme variance, des options sur le SMI avec 30 jours jusqu’à l’échéance négociées à la Bourse Eurex.

Source: UBS AG, Bloomberg

Valeurs du: 16.01.2019

Airbus / Boeing
Un duel transatlantique

L’année était à peine terminée que les deux plus grands constructeurs d’avion du monde présentaient déjà leurs bilans opérationnels. Boeing a livré en 2018 un total de 806 appareils, se classant ainsi tout juste devant Airbus. Son rival a livré 800 avions à des compagnies aériennes et de leasing. En bourse également, en 2018, Boeing avait une longueur d’avance. Le titre du Dow Jones™ a ainsi renforcé son avance durable sur Airbus (cf. graphique).¹ Avec le nouvel Early Redemption (ER) Kick-In GOAL (symbole : KCZHDU), les investisseurs misent sur le fait que les deux grandes capitalisations pourront maintenir leurs cours plafonds ou qu’elles ne connaîtront du moins pas de trop fortes turbulences pendant la période : le coupon de 9,00% p.a. est associé à une marge de sécurité de 40%.

Avec une dernière ligne droite très performante en 2018, Airbus a réussi à réaliser très précisément les objectifs de livraison que la compagnie s’était fixés pour l’année. Des problèmes de livraison de moteurs au cours des mois précédents avaient éveillé des inquiétudes quant à la réalisation des prévisions. Mais en dépit de tous les cris d’orfraie du groupe européen, le groupe a enregistré une progression des livraisons pour la 16e année consécutive. Avec une croissance de 11% par rapport à la période précédente, Airbus a enregistré par ailleurs une nouvelle année record en 2018. Pendant ce temps, le nombre de nouvelles commandes baissait. L’entreprise a enregistré 747 commandes contre 1109 l’année précédente. Malgré tout, à la fin 2018, un carnet de commandes record de 7577 machines commerciales subsistait. (Source : Airbus, communiqué de presse, 09.01.2019)

Avec 806 jets livrés, Boeing a réalisé en 2018 un nouveau record. Le groupe de Seattle a ainsi progressé de 5,6% par rapport à l’année dernière. Dans le même temps, l’entreprise a enregistré des commandes pour 893 avions et une valeur totale de 143,7 milliards de dollars US. Le hit des ventes de Boeing reste le 737 MAX. Pour cette gamme de modèles, 675 commandes ont été enregistrées en 2018. En décembre, le programme a franchi le mur du son de 5000 commandes au total. (Source : Boeing, communiqué de presse, 08.01.2019)

Opportunités: UBS réunit comme sous-jacents dans un ER Kick-In GOAL (symbole : KCZHDU) les constructeurs d’avions classés sous « Buy » par la recherche interne. Le duo permet un coupon de 9,00% p.a. Une barrière de 60% du niveau initial s’oppose à cette opportunité de rendement. Compte tenu de la fonction « Early Redemption », il existe une opportunité d’obtenir le rendement maximal de manière anticipée. Condition : Les deux actions sont cotées au niveau du cours de début ou à un niveau supérieur à l’un des jours fixés.

Risques: il n’existe aucune protection du capital pour le produit présenté. Si, pendant la durée de l’investissement, l’un des sous-jacents atteint une seule fois la barrière respective (« Kick-In Level ») ou est inférieur à celle-ci, et que la fonction de remboursement anticipé ne s’applique pas, le remboursement par amortissement en espèces à l’échéance est basé sur la performance la plus faible (base Strike) du duo (au maximum toutefois à la valeur nominale majorée du coupon). Dans un tel cas, des pertes sont probables. Par ailleurs, avec les produits structurés, l’investisseur supporte le risque d’émetteur.
Cela signifie qu’en cas d’insolvabilité d’UBS SA, le capital investi peut être perdu, indépendamment de l’évolution du sous-jacent.

Vous trouverez davantage de produits UBS et des informations sur les opportunités et les risques à l’adresse ubs.com/keyinvest.

Airbus vs. Boeing
(5 ans, aux fins d’illustration uniquement, données en %)

Source: UBS AG, Bloomberg

Valeurs du: 16.01.2019

9.00% p.a. Early Redemption Worst of Kick-In GOAL sur Airbus / Boeing

Symbol KCZHDU
SVSP Name Barrier Reverse Convertible
SPVSP Code 1230 (Auto-Callable)
Sous-jacent Airbus / Boeing
Devise EUR
Coupon 9.00% p.a.
Kick-In Level 60%
Echéance 25.01.2021
Émetteur UBS AG, London
Date de fixation du prix 23.01.2019, 15:00 h
 

Vous trouverez davantage de produits UBS et des informations sur les opportunités et les risques à l’adresse ubs.com/keyinvest.

Source: UBS AG, Bloomberg

Valeurs du: 16.01.2019

¹) La performance passée n’indique pas les résultats futures.
²) Les condition des ETTs sont vérifiés annuellement et peuvent être ajustées avec un délai de 13 mois après la publication.

This material has been prepared by UBS AG or one of its affiliates («UBS»). This material is for distribution only as permitted by law. It is not prepared for the needs of any specific recipient. It is published solely for information and is not a solicitation or offer to buy or sell any securities or related financial instruments (“Instruments”). UBS makes no representation or warranty, either express or implied, on the completeness or reliability of the information contained in this document (“Information”) except that concerning UBS AG and its affiliates. The Information should not be regarded by recipients as a substitute for using their own judgment. Any opinions expressed in this material may change without notice and may be contrary to opinions expressed by other business areas of UBS as a result of using different assumptions or criteria. UBS is under no obligation to update the Information. UBS, its officers, employees or clients may have or have had an interest in the Instruments and may at any time transact in them. UBS may have or have had a relationship with entities referred to in the Information. Neither UBS nor any of its affiliates, or their officers or employees, accepts any liability for any loss arising from use of the Information. This presentation is not a basis for entering into a transaction. Any transaction between you and UBS will be subject to the detailed provisions of the term sheet, confirmation or electronic matching systems relating to that transaction. Clients wishing to effect transactions should contact their local sales representative.
This information is communicated by UBS AG and/or its affiliates («UBS»). * (see below) UBS may from time to time, as principal or agent, have positions in, or may buy or sell, or make a market in any securities, currencies, financial instruments or other assets underlying the product to which this website relates (the «Structured Product»). UBS may provide investment banking and other services to and/or have officers who serve as directors of the companies referred to in this website. UBS’s trading and/or hedging activities related to the Structured Product may have an impact on the price of the underlying asset and may affect the likelihood that any relevant barrier or relevant trigger event is crossed or triggered. UBS has policies and procedures designed to minimise the risk that officers and employees are influenced by any conflicting interest or duty and that confidential information is improperly disclosed or made available. UBS may pay or receive brokerage or retrocession fees in connection with the Structured Product described herein. In respect of any Structured Product that is a security, UBS may, in certain circumstances, sell the Structured Product to dealers and other financial institutions at a discount to the issue price or rebate to them for their own account some proportion of the issue price. Further information is available on request. Structured Products are complex and may involve a high risk of loss. Prior to purchasing the Structured Product you should consult with your own legal, regulatory, tax, financial and accounting advisors to the extent you consider it necessary, and make your own investment, hedging and trading decisions (including decisions regarding the suitability of the Structured Product) based upon your own judgement and advice from those advisers you consider necessary. Save as otherwise expressly agreed in writing, UBS is not acting as your financial adviser or fiduciary in relation to the Product. UBS generally hedges its exposure to Structured Products, although it may elect not to hedge or to partially hedge any Structured Product. UBS’s hedging activity may be conducted through transactions in the underlying asset, index or instrument or in options, futures or other derivatives related to the underlying asset, index or instrument on publicly traded markets or otherwise, and may have an impact on the price of the under-lying asset. If a transaction is cash settled, UBS will generally unwind or offset any hedge it has for such Structured Product in close proximity to the relevant valuation time or period. In some cases, this activity may affect the value of the Structured Product. Unless stated otherwise in this document, (i) this document is for information purposes only and should not be construed as an offer, personal recommendation or solicitation to purchase the Structured Product and should not be treated as giving investment advice, and (ii) the terms of any investment in the Structured Product will be exclusively subject to the detailed provisions, including risk considerations, contained in the more detailed legal documentation that relates to the Structured Product (being the confirmation, information memorandum, prospectus or other issuer documentation as relevant). UBS makes no representation or warranty relating to any information herein which is derived from independent sources. This document shall not be copied or reproduced without UBS’s prior written permission. In respect of any Structured Product that is a security, no action has been or will be taken in any jurisdiction that would permit a public offering of the Product, save where explicitly stated in the issuer documentation. The Structured Product must be sold in accordance with all applicable selling restrictions in the jurisdictions in which it is sold.
© UBS 2018. All rights reserved. UBS prohibits the forwarding of this information without the approval of UBS.
Weekly Hits: Or, Airbus & Boeing2019-02-15T12:17:12+01:00

Weekly Hits: Gold, Airbus & Boeing

KeyInvest Weekly Hits

Friday, 18.01.2019

  • Topic 1: Gold - An increase in the need for protection
  • Topic 2: Airbus/Boeing - A transatlantic duel

Gold
An increase in the need for protection

The British House of Commons has rejected the Brexit agreement negotiated with Brussels by Prime Minister Theresa May. Although the Prime Minister is now working on a “Plan B”, the risk of a “no deal” Brexit has increased. It therefore comes as no surprise that investors are increasingly turning to the crisis currency of gold (the gold price has risen by 3.7% since December 10, 2018).¹ The ETC (symbol: CGCCIU) offers transparent and efficient access to the most important precious metal. The product tracks the performance of the UBS Bloomberg CMCI Gold CHF Monthly Hedged TR Index. The main parties benefitting from the increasing gold prices are precious metal producers such as Kinross Gold, Freeport-McMoRan and Barrick Gold. This trio forms the basis for an Early Redemption (ER) Kick-In GOAL (symbol: KDAIDU). Investors can expect a coupon payment of 14% p.a. with this subscription product. In addition, the three shares prone to fluctuations have low barriers of 50% of the initial price level.

While only 202 MPs voted for the Brexit deal, a clear majority of 432 MPs rejected it. After the vote in the House of Commons, Theresa May nevertheless came out fighting and announced a plan for how to proceed next. However, we may not see this plan in action, as the leader of the opposition Jeremy Corbyn called for a vote of no-confidence (source: Thomson Reuters media report, January 16, 2019). In any case, the gold price initially showed little reaction to the crushing defeat suffered by the British government. However, the precious metal had grown considerably more expensive in the run-up to the vote, with its value increasing by 6.1% over three months.¹ In addition to the Brexit turbulence, the tariff dispute between the US and China has seen investors head to the safe haven offered by gold.

Especially as the unresolved spat is having a noticeable impact on the real economy. One such example is that in December, China reported a 7.6% decline in imports in comparison with the previous year. At the same time, exports also fell by 4.4%. Analysts had expected growth for both indicators (source: Thomson Reuters media report, January 15, 2019).
In the wake of rising precious metal prices, shares in the mining sector have provided a sign of life. In addition, a takeover has made the industry sit up and take notice, with US company Newmont Mining buying its Canadian competitor Goldcorp for USD 10 billion. If the deal actually comes to pass, this merger would see the creation of the world’s largest gold company. Back in September 2018, Barrick Gold merged with Randgold Resources, a deal that saw the company’s market value rise by USD 6.1 billion (source: Thomson Reuters media report, January 14, 2019).

Opportunities: With the ETT (symbol: CGCCIU) on the UBS Bloomberg CMCI Gold CHF Monthly Hedged TR Index, investors can add the crisis currency to their portfolios simply and cost-effectively. The underlying assets and product are denominated in Swiss francs. Any fluctuations in the exchange rate between the Swiss franc and the commodity currency, the US dollar, are hedged on a monthly basis. The Early Redemption Kick-In GOAL (symbol: KDAIDU) on Kinross Gold, Freeport-McMoRan and Barrick Gold provides investors with a partially protected position in the mining sector. Provided that none of the underlyings touch or fall below the barrier of 50%, the product will pay a return of 14% p.a. on the maturity date. Investors may also be able to get their hands on this return at a much earlier date. Thanks to the Early Redemption function, the term can be shortened.

Risks: The aforementioned products do not have capital protection. The ETC will make a loss if the underlying index decreases. If the underlying assets for the ER Kick-In GOAL equal or fall below the respective kick-in level (barrier) and the early redemption feature does not apply, the amount repaid on maturity may be in cash, reflecting the worst performance of the underlyings (but not more than nominal value plus coupon). In this case, it is likely that losses will be incurred. Investors in structured products are also exposed to issuer risk, which means that the invested capital may be lost if UBS AG becomes insolvent, regardless of the performance of the underlying.

More UBS products and further information on the risks and opportunities are available at ubs.com/keyinvest.

Gold (in US dollars per fine ounce) 5 years¹

Gold has been trending upwards strongly for around three years. While experiencing huge fluctuations, the troy ounce rose in price from less than USD 1,100 to just under USD 1,300.

Source: UBS AG, Bloomberg

As of 16.01.2019

Kinross Gold vs. Freeport-McMoRan vs. Barrick Gold
(five years, for illustrative purposes only, figures in %)¹

The gold sector has had quite a hard time with investors in recent years. All the same, the prices of shares in Kinross Gold,
Freeport-McMoRan and Barrick Gold have stabilized somewhat.

Source: UBS AG, Bloomberg

As of: 16.01.2019

¹) Please be aware that past performance does not indicate future results.
²) The conditions of ETTs are reviewed on a yearly basis and can be adjusted with a deadline of 13 months after the announcement.

ETC on UBS Bloomberg CMCI Gold CHF Monthly Hedged TR Index

Symbol CGCCIU
SVSP Name Tracker Certificates
SPVSP Code 1300
Underlying UBS Bloomberg CMCI Gold CHF Monthly Hedged TR Index
Currency CHF
Ratio 10:1
Administration fee 0.38% p.a.
Expiry Open End
Participation 100%
Issuer UBS AG, London
Bid/Ask CHF 77.70 / 78.05
 

14.00% p.a. Early Redemption Worst of Kick-In GOAL on Kinross Gold / FreeportMcRoran / Goldstone

Symbol KDAIDU
SVSP Name Barrier Reverse Convertibles
SPVSP Code 1230 (Auto-Callable)
Underlying Kinross Gold / Freeport-McMoRan / Barrick Gold
Currency USD
Coupon 14.00% p.a.
Kick-In Level
50%
Expiry 30.01.2020
Issuer UBS AG, London
Subscription until 30.01.2019, 15:00 h
 

More UBS products and further information on the risks and opportunities are available at ubs.com/keyinvest.

Source: UBS AG, Bloomberg

As of: 16.01.2019

Market overview

Index Quotation Week¹
SMI™ 8’873.77 2.1%
SLI™ 1’374.48 2.4%
S&P 500™ 2’616.10 1.2%
Euro STOXX 50™ 3’077.22 0.2%
S&P™ BRIC 40 4’012.62 1.0%
CMCI™ Compos. 893.02 -0.2%
Gold (troy ounce) 1’293.80 USD 0.1%

¹ Change based on the closing price of the previous day compared to the closing price a week ago.

SMI™ vs. VSMI™ 1 year

smi vs vsmi

The VSMI™ Index is calculated since 2005. It shows the volatility of the stocks within the SMI™ index. A portfolio which reacts only to changes in volatility instead of volatility itself is relevant for the calculation. Thereby, the VSMI™ methodology uses the squared volatility, known as variance, of the SMI options with remaining time to expiry of 30 days traded at the Eurex.

Source: UBS AG, Bloomberg

As of: 16.01.2019

Airbus/Boeing
A transatlantic duel

The year had barely come to a close when the two largest aircraft manufacturers in the world presented their operating balance sheets. In 2018, Boeing supplied a total of 806 aircraft and in doing slightly outperformed Airbus, with its rival delivering 800 aircraft to airline and leasing companies. Boeing also led the race on the stock exchange in 2018. As a result, the Dow Jones™ stock thus extended its longer-term lead over Airbus (see chart).¹ With a new Early Redemption (ER) Kick-In GOAL (symbol: KCZHDU), investors are counting on the two large caps to be able to maintain their current altitude on the market and avoid too much turbulence during the term. The annual coupon of 9% comes with a safety buffer of 40%.

Following a strong end to the year, Airbus has succeeded in meeting its own delivery target for 2018 with pinpoint accuracy. Due to problems with the supply of engines, there had been doubts that this forecast would be met in recent months. Despite all the cries of the naysayers, the European group has increased deliveries for the 16th year in a row. Airbus also posted another record year in 2018 with year-on-year growth of 11%. During this time, however, there was a decline in new orders. The company recorded 747 net orders, compared with 1,109 in the previous year. Nevertheless, a record-high order backlog of 7,577 commercial aircraft had piled up at the end of 2018 (source: Airbus media release, January 9, 2019).

By delivering 806 jet aircraft, Boeing also set a new record in 2018, which saw the Seattle-based group enjoying year-on-year growth of 5.6%. At the same time, the company received orders for a net total of 893 aircraft with a total value of USD 143.7 billion. The 737 MAX remains Boeing’s best-selling product, with 675 net orders being placed for this model in 2018. In December, the program hit the 5,000 net orders mark (source: Boeing media release, January 8, 2019).

Opportunities: UBS has combined the shares in the aircraft manufacturers, both of which have been rated as «Buy” by UBS’ inhouse research department, as the underlying assets for an ER Kick-In GOAL (symbol: KCZHDU). A coupon of 9% p.a. is available on the two shares. This return opportunity comes with a barrier of a low 60% of the starting price. The Early Redemption function makes it possible for the maximum return to be paid out early. This requires that both shares close at or above their respective initial prices on one of the observation days.

Risks: This product does not have capital protection. If the underlyings equal or fall below the respective kick-in level (barrier) and the early redemption feature does not apply, the amount repaid on the date of maturity may be in cash, reflecting the worst performance of the two shares (but not more than nominal value plus coupon). In this case, it is likely that losses will be incurred. Investors in structured products are also exposed to issuer risk, which means that the invested capital may be lost if UBS AG becomes insolvent, regardless of the performance of the underlying.

More UBS products and further information on the risks and opportunities are available at ubs.com/keyinvest.

Airbus vs. Boeing
(five years, for illustrative purposes only, figures in %)¹

Source: UBS AG, Bloomberg

As of: 16.01.2019

9.00% p.a. Early Redemption Worst of Kick-In GOAL on Airbus / Boeing

Symbol KCZHDU
SVSP Name Barrier Reverse Convertibles
SPVSP Code 1230 (Auto-Callable)
Underlyings Airbus / Boeing
Currency EUR
Coupon 9.00% p.a.
Kick-In Level 60%
Expiry 25.01.2021
Issuer UBS AG, London
Subscription until 23.01.2019, 15:00 h
 

More UBS products and further information on the risks and opportunities are available at ubs.com/keyinvest.

Source: UBS AG, Bloomberg

As of: 16.01.2019

¹) Please be aware that past performance does not indicate future results.
²) The conditions of ETTs are reviewed on a yearly basis and can be adjusted with a deadline of 13 months after the announcement.

This material has been prepared by UBS AG or one of its affiliates («UBS»). This material is for distribution only as permitted by law. It is not prepared for the needs of any specific recipient. It is published solely for information and is not a solicitation or offer to buy or sell any securities or related financial instruments (“Instruments”). UBS makes no representation or warranty, either express or implied, on the completeness or reliability of the information contained in this document (“Information”) except that concerning UBS AG and its affiliates. The Information should not be regarded by recipients as a substitute for using their own judgment. Any opinions expressed in this material may change without notice and may be contrary to opinions expressed by other business areas of UBS as a result of using different assumptions or criteria. UBS is under no obligation to update the Information. UBS, its officers, employees or clients may have or have had an interest in the Instruments and may at any time transact in them. UBS may have or have had a relationship with entities referred to in the Information. Neither UBS nor any of its affiliates, or their officers or employees, accepts any liability for any loss arising from use of the Information. This presentation is not a basis for entering into a transaction. Any transaction between you and UBS will be subject to the detailed provisions of the term sheet, confirmation or electronic matching systems relating to that transaction. Clients wishing to effect transactions should contact their local sales representative.
This information is communicated by UBS AG and/or its affiliates («UBS»). * (see below) UBS may from time to time, as principal or agent, have positions in, or may buy or sell, or make a market in any securities, currencies, financial instruments or other assets underlying the product to which this website relates (the «Structured Product»). UBS may provide investment banking and other services to and/or have officers who serve as directors of the companies referred to in this website. UBS’s trading and/or hedging activities related to the Structured Product may have an impact on the price of the underlying asset and may affect the likelihood that any relevant barrier or relevant trigger event is crossed or triggered. UBS has policies and procedures designed to minimise the risk that officers and employees are influenced by any conflicting interest or duty and that confidential information is improperly disclosed or made available. UBS may pay or receive brokerage or retrocession fees in connection with the Structured Product described herein. In respect of any Structured Product that is a security, UBS may, in certain circumstances, sell the Structured Product to dealers and other financial institutions at a discount to the issue price or rebate to them for their own account some proportion of the issue price. Further information is available on request. Structured Products are complex and may involve a high risk of loss. Prior to purchasing the Structured Product you should consult with your own legal, regulatory, tax, financial and accounting advisors to the extent you consider it necessary, and make your own investment, hedging and trading decisions (including decisions regarding the suitability of the Structured Product) based upon your own judgement and advice from those advisers you consider necessary. Save as otherwise expressly agreed in writing, UBS is not acting as your financial adviser or fiduciary in relation to the Product. UBS generally hedges its exposure to Structured Products, although it may elect not to hedge or to partially hedge any Structured Product. UBS’s hedging activity may be conducted through transactions in the underlying asset, index or instrument or in options, futures or other derivatives related to the underlying asset, index or instrument on publicly traded markets or otherwise, and may have an impact on the price of the under-lying asset. If a transaction is cash settled, UBS will generally unwind or offset any hedge it has for such Structured Product in close proximity to the relevant valuation time or period. In some cases, this activity may affect the value of the Structured Product. Unless stated otherwise in this document, (i) this document is for information purposes only and should not be construed as an offer, personal recommendation or solicitation to purchase the Structured Product and should not be treated as giving investment advice, and (ii) the terms of any investment in the Structured Product will be exclusively subject to the detailed provisions, including risk considerations, contained in the more detailed legal documentation that relates to the Structured Product (being the confirmation, information memorandum, prospectus or other issuer documentation as relevant). UBS makes no representation or warranty relating to any information herein which is derived from independent sources. This document shall not be copied or reproduced without UBS’s prior written permission. In respect of any Structured Product that is a security, no action has been or will be taken in any jurisdiction that would permit a public offering of the Product, save where explicitly stated in the issuer documentation. The Structured Product must be sold in accordance with all applicable selling restrictions in the jurisdictions in which it is sold.
© UBS 2018. All rights reserved. UBS prohibits the forwarding of this information without the approval of UBS.
Weekly Hits: Gold, Airbus & Boeing2019-02-15T12:08:47+01:00
Go to Top