About ubs-ch

This author has not yet filled in any details.
So far ubs-ch has created 402 blog entries.

Warten auf neue Hochs

KeyInvest Blog

25. Februar 2019 – UBS Wochenkommentar Rück-/Ausblick

Warten auf neue Hochs

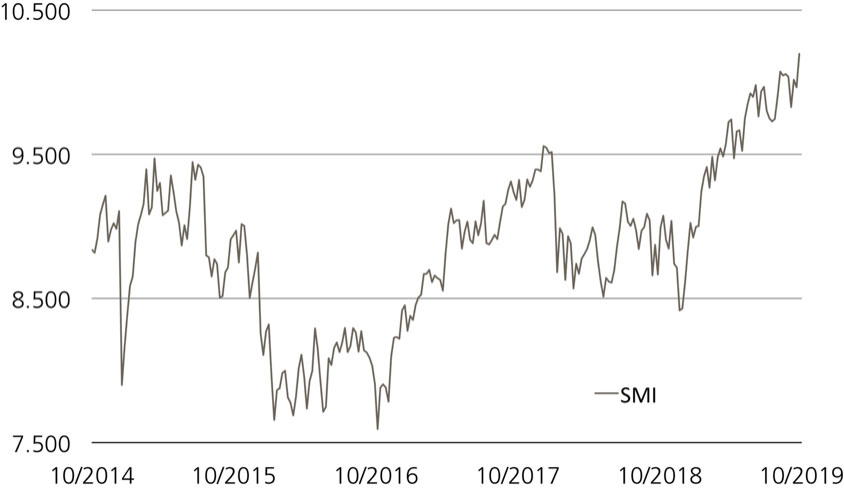
Nach Ende des vergangenen Jahres schien es so, als würde die Stunde der «Untergangspropheten» schlagen. Der SMI tauchte im vierten Quartal um knapp acht Prozent ab, der S&P 500 gar um rund 14 Prozent. Doch so schnell liessen sich die Bullen nicht das Zepter aus der Hand nehmen. Seit Jahresbeginn haben die Börsenampeln wieder auf Grün umgeschaltet. Und wenn es auch kaum zu glauben ist, aber einige Indizes stehen kurz bevor, neue Hochs markieren zu können.1

Dazu zählt der SMI, dem lediglich rund 300 Punkte oder drei Prozent auf den Rekordstand von 9’616 Punkten aus dem Vorjahr fehlen. Beim S&P 500 sind es noch etwas mehr als fünf Prozent zum Gipfel bei 2’940 Punkten. Mit guten Firmenergebnissen im Rücken ist es durchaus vorstellbar, dass die Indizes auf neue Niveaus klettern.1

Die positiven Überraschungen überwiegen

Beinahe zu Ende ist die Quartalssaison in den USA. Bereits 89 Prozent der S&P 500-Mitglieder haben ihre Bücher offengelegt. Nach einer Auswertung von Factset übertrafen 61 Prozent die durchschnittlichen Erlösprognosen und sogar 69 Prozent die Ergebnisschätzungen. Aktuell errechnet sich für den S&P 500 ein Gewinnwachstum von 13.1 Prozent. Sollte es dabei bleiben, wird das US-Leitbarometer das fünfte Quartal in Folge mit einem zweistelligen Gewinnanstieg abschliessen. (Quelle: Factset, Earnings Insight, 22.02.2019)

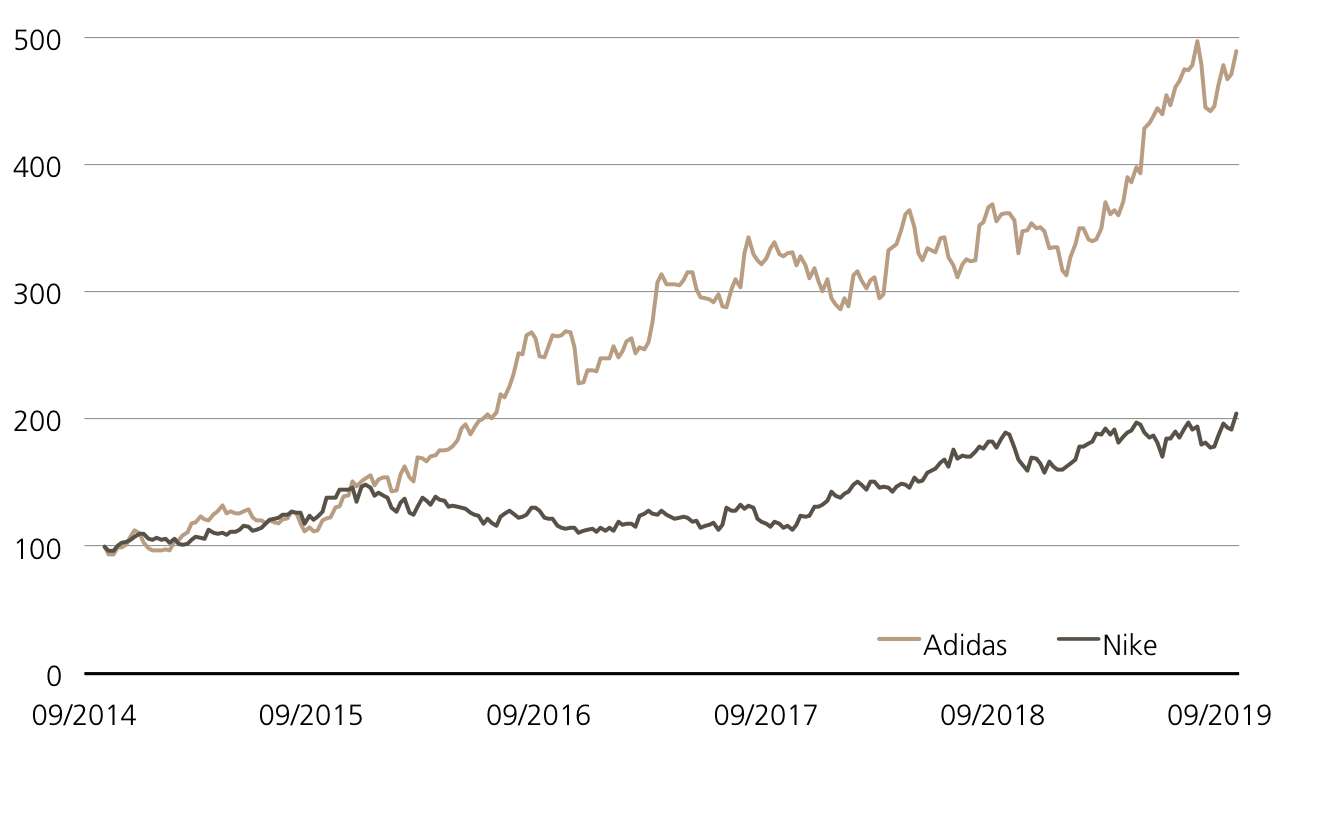
Obwohl die Sektoren Informationstechnologie (86 Prozent) und Industrial (81 Prozent) die meisten Unternehmen beheimaten, welche die Erwartungen übertreffen konnten, stiehlt ein Branchenfremder ihnen die Show. Das höchste Überraschungsmoment hatte Under Armour. Berechnungen von Facset zeigen, dass der Sportartikelhersteller die Erwartungen beim Ergebnis je Aktie (EPS) um 112 Prozent übertreffen konnte und damit mehr als jedes andere Mitglied im S&P 500. Aber auch Konkurrent Nike schloss seine letzte Geschäftsperiode deutlich oberhalb der Erwartungen ab. Prognostiziert wurde ein EPS von 0.46 US-Dollar, gemeldet hat Nike 0.52 US-Dollar. Der Early Redemption Kick-In GOAL (Symbol: KBXDDU) auf Nike und Under Armour stellt eine Seitwärtsrendite von 18.92 Prozent in Aussicht. Dabei kann es das Sport-Duo gemütlich angehen lassen, einzig der Risikopuffer von 45 Prozent muss bis zum Verfall am 6. Juli 2020 ausreichen.

Wachstumsdelle im ersten Quartal

Ein derart hohes Wachstumstempo wie in den vergangenen Quartalen wird die Wall Street wohl nicht halten können. Für 2019 geht der Analystenkonsens nur noch von einem Ergebnisplus beim S&P 500 von 4.5 Prozent aus. Vor allem im ersten Quartal stehen die Zeichen auf Rot. Von Januar bis März wir mit einem Gewinnrückgang um 2.7 Prozent gerechnet. Auch die Profitabilität ist Schätzungen zufolge auf dem Rückzug. Erwartet wird beim S&P 500 eine Nettomarge von 10.8 Prozent, nach geschätzten 11.3 Prozent für das Schlussviertel 2018. Sollten die Analysten Recht bekommen, wird dies die geringste Nettogewinnspanne seit dem vierten Quartal 2017 sein. (Quelle: Factset, Earnings Insight, 22.02.2019)

In der Schweiz bleibt es spannend

Auch wenn hierzulande schon das Gros der SMI-Konzerne ihre Zahlenkränze präsentiert haben, bleibt es diese Woche diesbezüglich spannend. Am 26. Februar legt Swiss Life seine Bücher offen, am 28. Februar werden ABB und Adecco ihre Bilanzen präsentieren. An diesem Tag hält Novartis auch sein jährliches Aktionärstreffen ab. Ebenso aufschlussreich wird es in der zweiten und dritten Börsenreihe. PSP Swiss Property, EMMI oder auch Kühne + Nagel gewähren Einblick. Bei letztgenanntem Logistiker könnte es besonders interessant werden, nachdem aus der Branche zuletzt verschiedene Töne zu vernehmen waren. So veröffentlichte beispielsweise der US-Konkurrent FedEx eine Gewinnwarnung aufgrund eines sich eintrübenden Umfelds, die Deutsche Post spürt dagegen noch keinerlei Gegenwinde.

USA, Grossbritannien, China: Noch keine Einigungen

Von politischer und konjunktureller Seite bleiben in der neuen Woche die alten Themen weiterhin präsent. Beim Handelskonflikt zwischen den USA und China kam es zuletzt zu Annäherungen. Die Wahrscheinlichkeit, dass ein Abkommen vereinbart werde, sei nun höher als die, dass es keins geben werde, sagte Donald Trump. Wahrscheinlich noch im März möchte der US-Präsident den chinesischen Staatschef Xi Jinping in Florida treffen, um über die wichtigsten Punkte einer Handelseinigung zu entscheiden. (Quelle: Thomson Reuters, Medienbericht, 23.02.2019) Darüber hinaus bleibt der Brexit eines der Hauptthemen: In der laufenden Woche ist eine erneute Abstimmung im Unterhaus geplant. Echte Fortschritte zwischen Premierministerin Theresa May und EU-Kommissionschef Jean-Claude Juncker hat es allerdings in den vergangenen Tagen nicht gegeben, sodass die Gefahr eines «No Deal»-Brexit hoch bleibt.

Nike vs. Under Armour (5 Jahre)

¹) Bitte beachten Sie, dass vergangene Wertentwicklungen keine Indikationen für künftige Wertentwicklungen sind.

Schweizer Unternehmenstermine

Datum Unternehmen
26.02.2019 PSP Swiss Property
26.02.2019 Swiss Life
27.02.2019 Georg Fischer
27.02.2019 Kühne + Nagel
28.02.2019 ABB
28.02.2019 Adecco
28.02.2019 Emmi
28.02.2019 Novartis (HV)
28.02.2019 Panalpina
28.02.2019 Swiss Prime Site

Quelle: Thomson Reuters

Weitere Blogeinträge:

Ein wahrer Luxus

Das «R»-Wort machte zuletzt an den Kapitalmärkten wieder einmal die Runde. Nach einem starken Start in das Börsenjahr kam verstärkt die Diskussion um eine drohende Rezession in wichtigen Wirtschaftsräumen auf. Enttäuschende Unternehmensberichte und verhaltene Ausblicke liessen die Kurse in der vergangenen Woche zunächst absacken.

Der Terminkalender füllt sich

Das mit der Inflation ist derzeit so eine Sache: Jenseits des Atlantiks, also Richtung Westen, ist die Teuerung auf dem Rückzug. So fielen in den USA die Preise im Dezember auf 6.5 von 7.1 Prozent im November.

Warten auf neue Hochs2019-02-25T10:21:24+01:00

Weekly Hits: Le secteur de l’alimentation, Temenos & SAP

KeyInvest Weekly Hits

Vendredi, 22.02.2019

  • Thème 1: Le secteur de l’alimentation - Quand on y a pris goût
  • Thème 2: Temenos / SAP - Un duo de logiciels à forte croissance

Le secteur de l’alimentation
Quand on y a pris goût

En 2018, Nestlé a concrétisé son objectif en enregistrant une croissance organique de son chiffre d’affaires de 3%. Après la publication de ces résultats, l’action du premier groupe agroalimentaire mondial n’a pas été la seule à s’envoler vers un plus haut historique : dans la foulée du géant de la branche, le STOXX™ Europe 600 Food & Beverage Index a également atteint un nouveau record.¹ Un ETT (symbole : ETFOO) reproduit fidèlement cet indice composé de 24 fabricants européens de produits alimentaires et de boissons. L’été dernier, Nestlé, Barry Callebaut et EMMI ont été sélectionnés comme sous-jacents pour un Early Redemption (ER) Kick-In GOAL (symbole : KCAODU). En intégrant ce produit dans leur portefeuille, les investisseurs peuvent espérer une opportunité de rendement de 6,7% p.a. Même EMMI, le « Worst Performer » actuel, jouit d’un écart confortable de 38,8% par rapport à la barrière.

«La croissance a repris sur nos deux plus grands marchés, les États-Unis et la Chine, mais aussi dans le secteur de la nutrition infantile», a indiqué Mark Schneider, le CEO de Nestlé, en présentant les chiffres actuels. Il a également souligné que le groupe avait réalisé des « progrès considérables » avec la nouvelle orientation. Le bénéfice a bondi de manière disproportionnée grâce, notamment, aux effets exceptionnels générés par la vente de certaines activités. Au total, en 2018 Nestlé a gagné 10,1 milliards de francs, soit 41,6% de plus que l’année précédente. Les actionnaires devraient participer avec un dividende majoré de 10 centimes, soit 2,45 francs par action. Pour 2019, Mark Schneider laisse entrevoir une nouvelle accélération de la croissance. Il souhaite en même temps améliorer la marge, le bénéfice et l’efficience du capital. (Source : Nestlé, communiqué de presse, 14.02.2019)

Selon UBS CIO GWM, le groupe agroalimentaire a su redresser la barre en 2018 après six années de croissance en repli. Pour la période en cours, les analystes tablent déjà sur une hausse organique du chiffre d’affaires de 3,6% pour le géant agroalimentaire. CIO GWM continue de recommander « Buy » pour la Large Cap et a augmenté son objectif de cours à 100 francs. (Source : UBS CIO GWM, Nestlé, 18.02.2019)
Quelques jours après Nestlé, Danone a confirmé la reprise dans l’industrie agroalimentaire. À données comparables, le groupe de produits laitiers a annoncé pour 2018 une croissance de son chiffre d’affaires supérieure aux attentes de 2,9%. Pour 2019, le groupe français prévoit qu’elle s’établira aux alentours de 3%. (Source : Thomson Reuters, article de presse, 19.02.2019) Dans ce tableau esquissé par le premier producteur mondial de yaourts, les résultats divulgués récemment par EMMI ne dénotent pas : le 30 janvier 2019, le fabricant suisse de produits laitiers a publié une croissance organique de son chiffre d’affaires (corrigée des variations de change et des acquisitions) de 2,3% pour l’année passée, soit, selon l’entreprise, la plus forte progression enregistrée depuis 2014.

Opportunités: Grâce à l’ETT (symbole : ETFOO) sur le STOXX™ Europe 600 Food & Beverage Index, les investisseurs qui y ont pris goût peuvent se positionner facilement et de manière diversifiée dans le secteur agroalimentaire européen. Il n’y a traditionnellement pas de frais récurrents pour cette structure de produit² Toutefois, EMMI n’entre pas dans la composition de cet indice. Cela dit, la Mid Cap combinée à Nestlé et au spécialiste du chocolat Barry Callebaut offre une opportunité de rendement attrayante de 6,7% p.a. avec le ER Kick-In GOAL (symbole : KCAODU). Bien qu’EMMI affiche la plus faible évolution de cours du trio par rapport au cours d’émission, l’action présente un écart de 38,8% par rapport à la barrière. Dès que la cote des trois sous-jacents atteint ou dépasse le cours initial lors d’un jour d’observation, le Early Redemption devient exigible – l’émetteur rembourse alors l’intégralité du nominal et le pro rata du coupon par anticipation.

Risques: les produits présentés n’offrent pas de protection du capital. Une évolution négative de l’actif sous-jacent entraîne des pertes correspondantes pour l’ETT. Si, pendant la durée de l’investissement, un des sous-jacents du Worst of Kick-In GOAL cote une seule fois au niveau ou en dessous de la barrière respective («Kick-In Level») et que, de plus, la fonction «Early Redemption» ne s’applique pas, le remboursement par amortissement en espèces à l’échéance est basé sur la performance la plus faible (sur la base du Strike) du trio (au maximum toutefois à la valeur nominale majorée du coupon). Dans un tel cas, des pertes sont probables. Par ailleurs, avec les produits structurés, l’investisseur supporte le risque d’émetteur. Cela signifie qu’en cas d’insolvabilité d’UBS SA, le capital investi peut être perdu, indépendamment de l’évolution du sous-jacent.

Vous trouverez davantage de produits UBS et des informations sur les opportunités et les risques à l’adresse ubs.com/keyinvest.

STOXX™ Europe 600 Food & Beverages Index vs. STOXX™ Europe 600 Index
(5 ans, aux fins d’illustration uniquement, données en %)¹

Avec son récent pic historique, le STOXX™ Europe 600 Food & Beverages Index a mis fin à l’évolution latérale observée pendant près de deux ans.

Source: UBS AG, Bloomberg

Valeurs du: 20.02.2019

Barry Callebaut vs. EMMI vs. Nestlé
(5 ans, aux fins d’illustration uniquement, données en %)¹

Sur cinq ans, EMMI a distancé les deux grandes capitalisations. Alors que le fabricant de produits laitiers et Barry Callebaut ont enregistré des variations marquées, Nestlé a affiché une tendance haussière relativement stable.

Source: UBS AG, Bloomberg

Valeurs du: 20.02.2019

¹) La performance passée n’indique pas les résultats futures.
²) Les condition des ETTs sont vérifiés annuellement et peuvent être ajustées avec un délai de 13 mois après la publication.

ETT sur STOXX™ Europe 600 Food & Beverages NR Index

Symbol ETFOO
SVSP Name Tracker Certifikat
SVSP Code 1300
Sous-jacent STOXX™ Europe 600 Food & Beverages Net Return Index
Devise EUR
Rapport de souscription 1:1
Frais de gestion 0.00% p.a.²
Participation 100%
Echéance Open End
Émetteur UBS AG, London
Bid/Ask EUR 1’291.00 / 1’298.00 
 

5.00% p.a. Early Redemption Kick-In GOAL sur Barry Callebaut / EMMI AG / Nestlé

Symbol KCAODU
SVSP Name Barrier Reverse Convertible
SPVSP Code 1230 (Auto-Callable)
Sous-jacent Barry Callebaut / EMMI AG / Nestlé
Devise CHF
Coupon 5.00% p.a.
Rendement latéraux 13.03% (6.47% p.a.)
Kick-In Level (distance) Barry Callebaut: CHF 1’041.00 (40.14%)
EMMI AG: CHF 490.50 (39.52%)
Nestlé: CHF 47.94 (47.04%)
Echéance 26.01.2021
Émetteur UBS AG, London
Bid/Ask 96.10% / 97.10%
 

Vous trouverez davantage de produits UBS et des informations sur les opportunités et les risques à l’adresse ubs.com/keyinvest.

Source: UBS AG, Bloomberg

Valeurs du: 20.02.2019

Apérçu du marché

Index Citation Semaine¹
SMI™ 9’315.63 Pt. 1.7%
SLI™ 1’433.77 Pt. 1.2%
S&P 500™ 2’284.70 Pt. 1.2%
Euro STOXX 50™ 3’259.49 Pt. 1.8%
S&P™ BRIC 40 4’180.10 Pt. 0.0%
CMCI™ Compos. 928.80 Pt. 2.6%
Gold (troy ounce) 1’347.90 USD 2.5%

¹ Changement basé sur le cours de clôture du jour précédent par rapport au cours de clôture de la semaine dernière.

SMI™ vs. VSMI™ 1 année

L’index VSMI™ est calculé depuis 2005. Il affiche la volatilité des actions inclus dans le SMI™ index. Pour la calculation, un portefeuille est utilisé qui ne réagit qu’au variations de la volatilité au lieu des variations des prix. En le faisant, la méthodologie du VSMI™ utilise la volatilité carré, connu sous le terme variance, des options sur le SMI avec 30 jours jusqu’à l’échéance négociées à la Bourse Eurex.

Source: UBS AG, Bloomberg

Valeurs du: 20.02.2019

Temenos / SAP
Un duo de logiciels à forte croissance

On ne peut désormais plus parler de logiciels sans parler du cloud. L’externalisation des données et des logiciels sur Internet connaît un engouement croissant. Ainsi, en 2018, les activités de SAP sur le cloud ont bondi de 32% pour atteindre 4,99 milliards d’euros. L’indicateur « New Cloud Bookings » en hausse de 25% en fin d’année laisse penser que cet élan n’est pas près de s’essouffler. Les programmes de Temenos, qui déjà en 2011 avait lancé un système bancaire central sur le cloud pour la première fois, ont également été bien reçus. Le spécialiste des logiciels bancaires a vu ses revenus de licences croître de 21% l’an dernier. Pour maintenir cette dynamique, l’entreprise romande a lancé deux nouveaux produits basés sur le cloud en début d’année : Temenos Infinity et Temenos T24 Transact. Le Kick-In GOAL en souscription (symbole : KDEADU) réunit SAP et Temenos comme sous-jacents. Le duo offre une opportunité de rendement de 6,00% p.a. avec une marge de sécurité de 40%.

Les deux groupes brillent non seulement par leurs chiffres d’affaires mais aussi par leurs bénéfices considérables. En 2018, la marge opérationnelle de SAP s’est élevée à 29%, et la rentabilité du groupe devrait encore progresser. Lors de la Journée du marché des capitaux à New York, le directeur financier, Luka Mucic, a laissé entrevoir une amélioration des marges ces prochaines années, notamment grâce à un meilleur mix du chiffre d’affaires qui devrait accroître la rentabilité. À titre d’exemple, le groupe souhaite porter la marge brute de ses activités sur le cloud de 63% actuellement à 71% en 2020. (Source : Finanzen.net, article de presse, 07.02.2018)

Temenos devrait également poursuivre son ascension. Max Chuard, l’actuel COO et directeur financier qui prendra la barre du fabricant de logiciels bancaires le 1er mars, souhaite poursuivre la stratégie fructueuse de son prédécesseur, David Arnott. À moyen terme, l’entreprise table sur une expansion de son volume d’affaires de 10 à 15% chaque année, ce qui devrait également permettre d’améliorer la rentabilité de 100 à 150 points de base. En 2018, la marge EBIT a pris un point de pourcentage pour s’établir à 31,5%. (Source : Temenos, communiqué de presse, 12.02.2019)

Opportunités: depuis le début de l’année, les actions de SAP et de Temenos grimpent beaucoup plus vite que l’ensemble du marché comme en témoigne la Mid Cap suisse qui a gagné 21% depuis le 1er janvier.¹ Pour le Kick-In GOAL en souscription (symbole : KDEADU), de nouvelles avancées de cours ne sont pas nécessaires. Le produit offre un rendement maximal de 6,00% à condition qu’aucun des sous-jacents n’atteigne ou ne descende en-dessous de sa barrière fixée à 60% de sa valeur initiale pendant la période de 18 mois.

Risques: les Kick-In GOALs ne bénéficient d’aucune protection du capital. Si, pendant la durée de l’investissement, l’un des sous-jacents atteint une seule fois la barrière respective (« Kick-In Level ») ou est inférieur à celle-ci, l’amortissement par remboursement en espèces à l’échéance est basé sur la performance la plus faible (base Strike) du duo (au maximum toutefois à la valeur nominale majorée du coupon). Dans un tel cas, des pertes sont probables. Par ailleurs, avec les produits structurés, l’investisseur supporte le risque d’émetteur. Cela signifie qu’en cas d’insolvabilité d’UBS SA, le capital investi peut être perdu, indépendamment de l’évolution du sous-jacent.

Vous trouverez davantage de produits UBS et des informations sur les opportunités et les risques à l’adresse ubs.com/keyinvest.

Temenos vs. SAP
(5 ans, aux fins d’illustration uniquement, données en %)¹

Source: UBS AG, Bloomberg

Valeurs du: 20.02.2019

6.00% p.a. Worst of Kick-In GOAL sur Temenos / SAP

Symbol KDEADU
SVSP Name Barrier Reverse Convertible
SPVSP Code 1230
Sous-jacent Temenos / SAP
Devise CHF (Quanto)
Coupon 6.00% p.a.
Strike Level 100%
Kick-In Level (barrière)
60%
Echéance 31.08.2020
Émetteur UBS AG, London
Sous-jacent 27.02.2019, 15:00 h
 

Vous trouverez davantage de produits UBS et des informations sur les opportunités et les risques à l’adresse ubs.com/keyinvest.

Source: UBS AG, Bloomberg

Valeurs du: 20.02.2019

¹) La performance passée n’indique pas les résultats futures.
²) Les condition des ETTs sont vérifiés annuellement et peuvent être ajustées avec un délai de 13 mois après la publication.

This material has been prepared by UBS AG or one of its affiliates («UBS»). This material is for distribution only as permitted by law. It is not prepared for the needs of any specific recipient. It is published solely for information and is not a solicitation or offer to buy or sell any securities or related financial instruments (“Instruments”). UBS makes no representation or warranty, either express or implied, on the completeness or reliability of the information contained in this document (“Information”) except that concerning UBS AG and its affiliates. The Information should not be regarded by recipients as a substitute for using their own judgment. Any opinions expressed in this material may change without notice and may be contrary to opinions expressed by other business areas of UBS as a result of using different assumptions or criteria. UBS is under no obligation to update the Information. UBS, its officers, employees or clients may have or have had an interest in the Instruments and may at any time transact in them. UBS may have or have had a relationship with entities referred to in the Information. Neither UBS nor any of its affiliates, or their officers or employees, accepts any liability for any loss arising from use of the Information. This presentation is not a basis for entering into a transaction. Any transaction between you and UBS will be subject to the detailed provisions of the term sheet, confirmation or electronic matching systems relating to that transaction. Clients wishing to effect transactions should contact their local sales representative.
This information is communicated by UBS AG and/or its affiliates («UBS»). * (see below) UBS may from time to time, as principal or agent, have positions in, or may buy or sell, or make a market in any securities, currencies, financial instruments or other assets underlying the product to which this website relates (the «Structured Product»). UBS may provide investment banking and other services to and/or have officers who serve as directors of the companies referred to in this website. UBS’s trading and/or hedging activities related to the Structured Product may have an impact on the price of the underlying asset and may affect the likelihood that any relevant barrier or relevant trigger event is crossed or triggered. UBS has policies and procedures designed to minimise the risk that officers and employees are influenced by any conflicting interest or duty and that confidential information is improperly disclosed or made available. UBS may pay or receive brokerage or retrocession fees in connection with the Structured Product described herein. In respect of any Structured Product that is a security, UBS may, in certain circumstances, sell the Structured Product to dealers and other financial institutions at a discount to the issue price or rebate to them for their own account some proportion of the issue price. Further information is available on request. Structured Products are complex and may involve a high risk of loss. Prior to purchasing the Structured Product you should consult with your own legal, regulatory, tax, financial and accounting advisors to the extent you consider it necessary, and make your own investment, hedging and trading decisions (including decisions regarding the suitability of the Structured Product) based upon your own judgement and advice from those advisers you consider necessary. Save as otherwise expressly agreed in writing, UBS is not acting as your financial adviser or fiduciary in relation to the Product. UBS generally hedges its exposure to Structured Products, although it may elect not to hedge or to partially hedge any Structured Product. UBS’s hedging activity may be conducted through transactions in the underlying asset, index or instrument or in options, futures or other derivatives related to the underlying asset, index or instrument on publicly traded markets or otherwise, and may have an impact on the price of the under-lying asset. If a transaction is cash settled, UBS will generally unwind or offset any hedge it has for such Structured Product in close proximity to the relevant valuation time or period. In some cases, this activity may affect the value of the Structured Product. Unless stated otherwise in this document, (i) this document is for information purposes only and should not be construed as an offer, personal recommendation or solicitation to purchase the Structured Product and should not be treated as giving investment advice, and (ii) the terms of any investment in the Structured Product will be exclusively subject to the detailed provisions, including risk considerations, contained in the more detailed legal documentation that relates to the Structured Product (being the confirmation, information memorandum, prospectus or other issuer documentation as relevant). UBS makes no representation or warranty relating to any information herein which is derived from independent sources. This document shall not be copied or reproduced without UBS’s prior written permission. In respect of any Structured Product that is a security, no action has been or will be taken in any jurisdiction that would permit a public offering of the Product, save where explicitly stated in the issuer documentation. The Structured Product must be sold in accordance with all applicable selling restrictions in the jurisdictions in which it is sold.
© UBS 2018. All rights reserved. UBS prohibits the forwarding of this information without the approval of UBS.
Weekly Hits: Le secteur de l’alimentation, Temenos & SAP2019-02-22T09:12:08+01:00

Weekly Hits: Food sector, Temenos & SAP

KeyInvest Weekly Hits

Friday, 22.02.2019

  • Topic 1: Food sector - Acquiring a taste for more
  • Topic 2: Temenos/SAP - Fast-growing software duo

Food sector
Acquiring a taste for more

In 2018, Nestlé generated organic revenue growth of 3%, in line with the target. According to the reported figures, not only the share of the world’s largest food company climbed to an all-time high. The STOXX™ Europe 600 Food & Beverage Index also reached a historic best in the wake of the industry giant.¹ An ETT (symbol: ETFOO) replicates the benchmark of 24 European food and beverage manufacturers. Last summer Nestlé, along with Barry Callebaut and EMMI, was selected as the underlying for an Early Redemption (ER) Kick-In GOAL (symbol: KCAODU). With this product, investors can add a return opportunity of 6.7% p.a. to their portfolio. Even the current worst performer, EMMI, has a comfortable distance to the barrier of 38.8%.

«Growth has picked up in our two largest markets, the U.S. and China, as well as in infant nutrition,» explained Nestlé CEO Mark Schneider. At the same time, he stressed that the Group had «made significant progress» with its realignment. The profit grew disproportionately, not least thanks to one-off effects from the saleof business units: Below the line, Nestlé earned CHF 10.1 billion in 2018, 41.6% more than in the previous year. Shareholders are to participate with a dividend that increased by 10 centimes to CHF 2.45 per share certificate. Schneider is anticipating a further acceleration in growth for 2019. At the same time, he wants to improve the margin, profit and capital efficiency. (Source: Nestlé, media release, February 14, 2019)

According to UBS CIO GWM, the food company has achieved a turnaround in 2018 after six years of declining growth. For the current period, analysts already believe that the industry giant will generate organic sales growth of 3.6%. CIO GWM continues to rate the large cap as a «buy» and raised its price target to CHF 100. (Source: UBS CIO GWM, Nestlé, February 18, 2019)
A few days after Nestlé, Danone corroborated the upturn in the food industry. On a comparable basis, the dairy group reported sales growth of 2.9% in 2018, which exceeded expectations. For 2019, the French company forecasts a growth in sales of around 3%. (Source: Thomson Reuters, media release, February 19, 2019) EMMI’s latest figures fit the latest world’s largest yogurt producer’s expectations : On January 30, 2019, the domestic milk processor reported organic (currency- and acquisition-adjusted) revenue growth of 2.3% for last year. According to the company, this was the highest increase since 2014.

Opportunities: Investors who have acquired a taste for the food industry can position themselves in the European food sector in an easy and diversified manner with the ETT (symbol: ETFOO) on the STOXX™ Europe 600 Food & Beverage Index. There are typically no ongoing fees for this product structure.² EMMI is not included in this benchmark.- The mid cap however, together with Nestlé and chocolate specialist Barry Callebaut, provides an attractive yield opportunity of 6.7% p.a. for the ER Kick-In GOAL (Symbol: KCAODU). Although EMMI exhibits the weakest price trend of the three compared to when shares were issued, the share has a distance to the barrier of 38.8%. Once all three underlyings are quoted at or above the starting level on an observation date, the early redemption will take place and the issuer will repay the full nominal and pro-rata coupon early.

Risks: The aforementioned products do not have capital protection. Should the underlying assets deliver a negative performance, the ETT will incur commensurate losses. If one of the underlyings in a Worst of Kick-In GOAL touches or falls below the respective kick-in level (barrier) and the early redemption feature does not apply, repayment at maturity may be in cash, reflecting the weakest performance of the trio from strike (but no more than nominal value plus coupon). In this case, it is likely that losses will be incurred. Investors in structured products are also exposed to issuer risk, which means that the invested capital may be lost if UBS AG becomes insolvent, regardless of the performance of the underlying.

More UBS products and further information on the risks and opportunities are available at ubs.com/keyinvest.

STOXX™ Europe 600 Food & Beverages Index vs. STOXX™ Europe 600 Index
(five years, for illustrative purposes only, figures in %)¹

With the recent all-time high, the STOXX™ Europe 600 Food & Beverages Index set out to break out of a sideways movement that had been observed for almost two years.

Source: UBS AG, Bloomberg

As of 20.02.2019

Barry Callebaut vs. EMMI vs. Nestlé
(five years, for illustrative purposes only, figures in %)¹

EMMI outperformed the two large caps over a period of five years. While both the milk processor and Barry Callebaut showed marked swings, Nestlé exhibited a relatively stable upward trend.

Source: UBS AG, Bloomberg

As of: 20.02.2019

¹) Please be aware that past performance does not indicate future results.
²) The conditions of ETTs are reviewed on a yearly basis and can be adjusted with a deadline of 13 months after the announcement.

ETT on STOXX™ Europe 600 Food & Beverages NR Index

Symbol ETFOO
SVSP Name Tracker Certificates
SPVSP Code 1300
Underlying STOXX™ Europe 600 Food & Beverages Net Return Index
Currency EUR
Ratio 1:1
Administration fee 0.00% p.a.²
Expiry Open End
Participation 100%
Issuer UBS AG, London
Bid/Ask EUR 1’291.00 / 1’298.00 
 

5.00% p.a. Early Redemption Kick-In GOAL on Barry Callebaut / EMMI AG / Nestlé

Symbol KCAODU
SVSP Name Barrier Reverse Convertible
SPVSP Code 1230 (Auto-Callable)
Underlying Barry Callebaut / EMMI AG / Nestlé
Currency CHF
Coupon 5.00% p.a.
Sideways return 13.03% (6.47% p.a.)
Kick-In Level (Distance) Barry Callebaut: CHF 1’041.00 (40.14%)
EMMI AG: CHF 490.50 (39.52%)
Nestlé: CHF 47.94 (47.04%)
Expiry 26.01.2021
Issuer UBS AG, London
Bid/Ask 96.10% / 97.10%
 

More UBS products and further information on the risks and opportunities are available at ubs.com/keyinvest.

Source: UBS AG, Bloomberg

As of: 20.02.2019

Market overview

Index Quotation Week¹
SMI™ 9’315.63 Pt. 1.7%
SLI™ 1’433.77 Pt. 1.2%
S&P 500™ 2’284.70 Pt. 1.2%
Euro STOXX 50™ 3’259.49 Pt. 1.8%
S&P™ BRIC 40 4’180.10 Pt. 0.0%
CMCI™ Compos. 928.80 Pt. 2.6%
Gold (troy ounce) 1’347.90 USD 2.5%

¹ Change based on the closing price of the previous day compared to the closing price a week ago.

SMI™ vs. VSMI™ 1 year

smi vs vsmi

The VSMI™ Index is calculated since 2005. It shows the volatility of the stocks within the SMI™ index. A portfolio which reacts only to changes in volatility instead of volatility itself is relevant for the calculation. Thereby, the VSMI™ methodology uses the squared volatility, known as variance, of the SMI options with remaining time to expiry of 30 days traded at the Eurex.

Source: UBS AG, Bloomberg

As of: 20.02.2019

Temenos/SAP
Fast-growing software duo

When it comes to software, it has been impossible to avoid the cloud for some time now. There is an ever-increasing demand for outsourcing data and software to the Internet. As a result, SAP expanded its cloud business by 32% to EUR 4.99 billion in 2018. The fact that this growth will continue is underscored by the «new cloud bookings» figure, which rose by 25%. Temenos’s programs have also been well received. The company launched a core banking system in the cloud for the first time in 2011. The banking software specialist increased its software license revenues by 21% last year. In order to maintain the momentum, the company, based in French-speaking Switzerland,launched two new cloud products at the beginning of the year: Temenos Infinity and Temenos T24 Transact. The Kick-In GOAL (symbol: KDEADU) available for subscription brings SAP and Temenos together as underlying values. With a risk buffer of 40%, the duo offers a return opportunity of 6.00% p.a.

Not only are the software companies excelling on the sales side, they are also both generating high profits. SAP’s operating margin was 29% in 2018 and profitability is expected to increase even further. At Capital Markets Day in New York, Chief Financial Officer Luka Mucic held out the prospect of an improvement in margins year over year. An improved revenue mix in particular should lead to greater profitability. For example, Mucic wants to improve the gross margin in the cloud business from the current 63% to 71% by 2020. (Source: Finanzen.net, media report, February 7, 2018)

Temenos is also expected to continue its upward trend. The former COO and CFO Max Chuard, who will take over the leadership at the banking software manufacturer on March 1, wants to continue the successful strategy of his predecessor David Arnott. In the medium term, the company anticipates an annual increase in business volume of 10-15%. Profitability is also expected to improve by 100 to 150 basis points p.a. In 2018, the EBIT margin increased by one percentage point to 31.5%. (Source: Temenos, media release, February 12, 2019)

Opportunities: Since the beginning of the year, SAP and Temenos shares have significantly outperformed the market as a whole. For example, the Swiss mid cap has gained 21% since December 31.¹ Further price premiums are not necessary for the Kick-In GOAL (symbol: KDEADU) in subscription. The product offers a maximum return of 6.00% p.a. This is subject to the condition that none of the underlyings touches or falls below the barrier fixed at 60% of the starting values within the 18-month term.

Risks: Kick-In GOALs do not have capital protection. If the underlyings equal or fall below the respective kick-in level (barrier), the amount repaid on the date of maturity may be in cash, reflecting the worst performance of the two shares (but not more than nominal value plus coupon). In this case, it is likely that losses will be incurred. Investors in structured products are also exposed to issuer risk, which means that the capital invested may be lost if UBS AG becomes insolvent, regardless of the performance of the underlying.

More UBS products and further information on the risks and opportunities are available at ubs.com/keyinvest.

Temenos vs. SAP
(five years, for illustrative purposes only, figures in %)¹

Source: UBS AG, Bloomberg

As of: 20.02.2019

6.00% p.a. Worst of Kick-In GOAL on Temenos / SAP

Symbol KDEADU
SVSP Name Barrier Reverse Convertibles
SPVSP Code 1230
Underlyings Temenos / SAP
Currency CHF (Quanto)
Coupon 6.00% p.a.
Strike Level 100%
Kick-In Level (barrier) 60%
Expiry 31.08.2020
Issuer UBS AG, London
Subscription until 27.02.2019, 15:00 h
 

More UBS products and further information on the risks and opportunities are available at ubs.com/keyinvest.

Source: UBS AG, Bloomberg

As of: 20.02.2019

¹) Please be aware that past performance does not indicate future results.
²) The conditions of ETTs are reviewed on a yearly basis and can be adjusted with a deadline of 13 months after the announcement.

This material has been prepared by UBS AG or one of its affiliates («UBS»). This material is for distribution only as permitted by law. It is not prepared for the needs of any specific recipient. It is published solely for information and is not a solicitation or offer to buy or sell any securities or related financial instruments (“Instruments”). UBS makes no representation or warranty, either express or implied, on the completeness or reliability of the information contained in this document (“Information”) except that concerning UBS AG and its affiliates. The Information should not be regarded by recipients as a substitute for using their own judgment. Any opinions expressed in this material may change without notice and may be contrary to opinions expressed by other business areas of UBS as a result of using different assumptions or criteria. UBS is under no obligation to update the Information. UBS, its officers, employees or clients may have or have had an interest in the Instruments and may at any time transact in them. UBS may have or have had a relationship with entities referred to in the Information. Neither UBS nor any of its affiliates, or their officers or employees, accepts any liability for any loss arising from use of the Information. This presentation is not a basis for entering into a transaction. Any transaction between you and UBS will be subject to the detailed provisions of the term sheet, confirmation or electronic matching systems relating to that transaction. Clients wishing to effect transactions should contact their local sales representative.
This information is communicated by UBS AG and/or its affiliates («UBS»). * (see below) UBS may from time to time, as principal or agent, have positions in, or may buy or sell, or make a market in any securities, currencies, financial instruments or other assets underlying the product to which this website relates (the «Structured Product»). UBS may provide investment banking and other services to and/or have officers who serve as directors of the companies referred to in this website. UBS’s trading and/or hedging activities related to the Structured Product may have an impact on the price of the underlying asset and may affect the likelihood that any relevant barrier or relevant trigger event is crossed or triggered. UBS has policies and procedures designed to minimise the risk that officers and employees are influenced by any conflicting interest or duty and that confidential information is improperly disclosed or made available. UBS may pay or receive brokerage or retrocession fees in connection with the Structured Product described herein. In respect of any Structured Product that is a security, UBS may, in certain circumstances, sell the Structured Product to dealers and other financial institutions at a discount to the issue price or rebate to them for their own account some proportion of the issue price. Further information is available on request. Structured Products are complex and may involve a high risk of loss. Prior to purchasing the Structured Product you should consult with your own legal, regulatory, tax, financial and accounting advisors to the extent you consider it necessary, and make your own investment, hedging and trading decisions (including decisions regarding the suitability of the Structured Product) based upon your own judgement and advice from those advisers you consider necessary. Save as otherwise expressly agreed in writing, UBS is not acting as your financial adviser or fiduciary in relation to the Product. UBS generally hedges its exposure to Structured Products, although it may elect not to hedge or to partially hedge any Structured Product. UBS’s hedging activity may be conducted through transactions in the underlying asset, index or instrument or in options, futures or other derivatives related to the underlying asset, index or instrument on publicly traded markets or otherwise, and may have an impact on the price of the under-lying asset. If a transaction is cash settled, UBS will generally unwind or offset any hedge it has for such Structured Product in close proximity to the relevant valuation time or period. In some cases, this activity may affect the value of the Structured Product. Unless stated otherwise in this document, (i) this document is for information purposes only and should not be construed as an offer, personal recommendation or solicitation to purchase the Structured Product and should not be treated as giving investment advice, and (ii) the terms of any investment in the Structured Product will be exclusively subject to the detailed provisions, including risk considerations, contained in the more detailed legal documentation that relates to the Structured Product (being the confirmation, information memorandum, prospectus or other issuer documentation as relevant). UBS makes no representation or warranty relating to any information herein which is derived from independent sources. This document shall not be copied or reproduced without UBS’s prior written permission. In respect of any Structured Product that is a security, no action has been or will be taken in any jurisdiction that would permit a public offering of the Product, save where explicitly stated in the issuer documentation. The Structured Product must be sold in accordance with all applicable selling restrictions in the jurisdictions in which it is sold.
© UBS 2018. All rights reserved. UBS prohibits the forwarding of this information without the approval of UBS.
Weekly Hits: Food sector, Temenos & SAP2019-02-22T09:23:13+01:00

Von West bis Ost: Die Welt im Wandel

KeyInvest Blog

18. Februar 2019 – UBS Wochenkommentar Rück-/Ausblick

Von West bis Ost: Die Welt im Wandel

Die Tumpsche «One Man Show» geht in eine neue Runde: Noch am vergangenen Freitag rief US-Präsident Donald Trump im Streit um den geplanten Bau einer Mauer an der Grenze zu Mexiko den Nationalen Notstand aus. Während diese Meldung hohe Wellen schlug und dies auch noch weiterhin tun dürfte – der Bundesstaat New York hat beispielsweise sofort angekündigt dagegen klagen zu wollen –, ist eine weitere Notstandserklärung beinahe untergegangen.

Das US-Handelsministerium hat den von Trump bestellten Bericht über die Auswirkungen von Autoimporten auf die nationale Sicherheit vorgelegt. Details des Reports werden zwar nicht veröffentlicht, am Markt gilt allerdings als sicher, dass die Experten die PKWs als eine Bedrohung einstufen. Damit rücken Zölle auf europäische Auto-Exporte in die USA näher. Trump hat für die Entscheidung nun 90 Tage Zeit. (Quelle: Thomson Reuters, Medienbericht, 17.02.2019)

Autos im Fokus

Folglich droht neues Ungemach für die bereits kriselnde Branche. Zuletzt hagelte es Gewinnwarnungen von den Unternehmen wie jene vom Autozulieferer Leoni oder auch sinkende Umsatz- und Ergebniszahlen von Renault. Aufgrund der schwierigen Rahmenbedingungen hat der Sektor auch an der Börse einen schweren Stand. Mehr als ein Viertel liegt der Branchenindex STOXX Europe 600 Automobiles & Parts auf Sicht von einem Jahr in den Miesen, das entspricht einer Underperformance von rund 20 Prozentpunkten gegenüber dem Gesamtmarkt.1 Weitere Neuigkeiten aus der Branche stehen diese Woche mit den vorläufigen Zahlen von Volkswagen am Freitag an.

Keine News gibt es derweil aus Grossbritannien. Rund sechs Wochen vor dem eigentlichen Brexit-Termin scheint die Regierung auf der Stelle zu treten. Derweil stellte die estnische Präsidentin Kersti Kaljulaid am Sonntag gegenüber der Nachrichtenagentur klar, dass sie keine Möglichkeit der EU sieht, der Premierministerin Theresa May bei den Brexit-Abmachungen entgegenzukommen. Entsprechend dazu nimmt das Risiko eines ungeordneten Austritts zu.

Im Osten geht die Sonne auf

Die Gefahr eines ausufernden Handelsstreits zwischen den USA und China könnte dagegen abnehmen. Trump sieht die Gespräche auf einem guten Weg. Die Verhandlungen seien kompliziert, kämen aber extrem gut voran, sagte der US-Präsident. (Quelle: Thomson Reuters, Medienbericht, 15.02.2019) Früheren Angaben zufolge hat Trump gedroht, ab dem 2. März weitere US-Zölle auf Waren aus China festzulegen, sollte es bis dahin keine Einigung geben. Die Gespräche sollen in der neuen Woche in den USA fortgesetzt werden.

Der Streit zwischen West und Ost ist auch ein Belastungsfaktor für die exportlastige japanische Wirtschaft. Zuletzt sorgte das Land der aufgehenden Sonne aber für positive Nachrichten. Dank zunehmender Konsumausgaben und höheren Investitionen ist die Konjunktur im vierten Quartal wieder auf den Wachstumspfad zurückgekehrt. Das Bruttoinlandsprodukt legte auf Jahressicht zwischen Oktober und Dezember um 1.4 Prozent zu. Im dritten Quartal schrumpfte das BIP noch um 2.6 Prozent. Die Ausfuhren nahmen im Vergleich zum Vorquartal um beachtliche 0.9 Prozent zu. In der kommenden Woche stehen weitere wichtige Wirtschaftsdaten an. Beispielsweise werden am Montag die Aufträge im Maschinenbau im Dezember veröffentlicht, am Freitag die Verbraucherpreise für den Januar (Konsens-Prognose: +0.3 Prozent)

Mögliche Aufholjagd

Am japanischen Aktienmarkt wird die Stimmung dagegen nur zögerlich besser. Seit Silvester liegt der Nikkei 225 nur etwas mehr als vier Prozent vorne, der SMI dagegen 9.6 Prozent und der S&P 500 schaffte gar ein Plus von über einem Zehntel.1 Bleiben die Konjunkturdaten in Fernost allerdings weiterhin im positiven Bereich und können die USA und China ihre Handelsauseinandersetzung friedlich lösen, könnte der Nikkei 225 eine Aufholjagd starten. Wer dieses Szenario für plausibel hält, kann mit dem Open End PERLES (ISIN: CH0013127300) auf den Nikkei 225 eins zu eins investieren.

NNikkei 225 vs. SMI (5 Jahre)

¹) Bitte beachten Sie, dass vergangene Wertentwicklungen keine Indikationen für künftige Wertentwicklungen sind.

Wichtige Konjunkturtermine

Datum Land Ereignis
18.02.2019 JP Aufträge Maschinenbau
19.02.2019 CH Handelsbilanz
19.02.2019 DE ZEW-Konjunkturerwartungen
20.02.2019 JP Exporte/Importe
20.02.2019 CH Industrieproduktion
20.02.2019 US FOMC-Protokoll
21.02.2019 EU Einkaufsmanagerindex
21.02.2019 US Philadelphia Fed Index
21.02.2019 US Verkäufe bestehender Häuser
22.01.2019 JP Verbraucherpreise
22.01.2019 DE Ifo Geschäftsklima

Quelle: Thomson Reuters

Weitere Blogeinträge:

Ein wahrer Luxus

Das «R»-Wort machte zuletzt an den Kapitalmärkten wieder einmal die Runde. Nach einem starken Start in das Börsenjahr kam verstärkt die Diskussion um eine drohende Rezession in wichtigen Wirtschaftsräumen auf. Enttäuschende Unternehmensberichte und verhaltene Ausblicke liessen die Kurse in der vergangenen Woche zunächst absacken.

Der Terminkalender füllt sich

Das mit der Inflation ist derzeit so eine Sache: Jenseits des Atlantiks, also Richtung Westen, ist die Teuerung auf dem Rückzug. So fielen in den USA die Preise im Dezember auf 6.5 von 7.1 Prozent im November.

Von West bis Ost: Die Welt im Wandel2019-02-18T13:23:18+01:00

Weekly Hits: Assureurs européens, Spotify & Twitter

KeyInvest Weekly Hits

Vendredi, 15.02.2019

  • Thème 1: Assureurs européens - Une saison des bilans de bon augure
  • Thème 2: Spotify / Twitter - Un duo d’une très grande portée

Assureurs européens
Une saison des bilans de bon augure

Alors que la saison des bilans bat son plein, le secteur des assurances entre dans la danse à son tour. Premier groupe d’assurance en Suisse, Zurich Insurance a publié ses résultats pour l’exercice écoulé. En Allemagne, le groupe munichois Münchener Rück s’est imposé comme chef de file. Les deux entités ont présenté des bilans irréprochables et sont parvenues à dépasser les attentes des analystes. L’évolution positive de leurs opérations se reflète également dans le cours de leurs actions. Sur une rétrospective d’un an, non seulement le duo caracole largement en tête du marché dans son ensemble, mais l’action de la Münchener Rück a même atteint un plus haut historique et l’action de Zurich Insurance n’en est pas loin.¹ L’ETT (symbole : ETINS) sur le STOXX™ Europe 600 Insurance Index permet de participer pleinement et de manière très diversifiée aux opportunités qu’offre la branche.²
De son côté, le Kick-In GOAL (symbole : KCNGDU) sur Zurich Insurance offre une opportunité d’entrée aux investisseurs préférant une approche conservatrice. Ce produit structuré laisse entrevoir un rendement de 9,4% même en cas de stagnation des cours.

Les chiffres de Zurich Assurance pour l’exercice écoulé sont remarquables : le groupe a enregistré un bénéfice net de 3,72 milliards de dollars américains, dépassant ainsi les prévisions les plus optimistes des analystes qui avaient tablé sur 3,56 milliards de dollars américains. De même, à 4,57 milliards de dollars américains, le résultat opérationnel est ressorti largement au-dessus de l’estimation consensuelle. Mario Greco, directeur général de Zurich Insurance, commente ces bons résultats en expliquant que le groupe a continué d’accroître sa rentabilité et de baisser ses coûts. (Source : Zurich Insurance, communiqué de presse, 07.02.2019) Zurich Insurance maintient ses objectifs : entre 2017 et 2019, le groupe vise un bénéfice d’exploitation après impôts de plus 12% du capital. L’an passé, il s’est élevé à 12,1%. Les actionnaires doivent également participer au succès. Pour 2018, la direction a proposé un dividende de 19 francs par action, ce qui représente un franc de plus que l’année précédente.

Son homologue allemand, Münchener Rück, a également revu sa distribution à la hausse après des résultats annuels très satisfaisants. Le premier réassureur mondial a réalisé un bénéfice net de tout juste 2,3 milliards d’euros contre seulement 0,4 milliard d’euros l’année précédente. Les actionnaires seront ravis de percevoir un dividende de 9,25 euros par action, soit une hausse de 7,5%.
Nous verrons dans les jours et semaines à venir si les autres groupes d’assurance européens parviennent à égaler Zurich Insurance et Münchener Rück. Par exemple, Swiss Re et Axa publieront leurs comptes le 21 février, suivis par Swiss Life le 26 février et par Baloise le 7 mars. À court terme, le bilan le plus attendu est celui d’Allianz. Le premier groupe d’assurance européen communiquera ses résultats le 15 février. Selon certaines informations émanant de Thomson Reuters, les analystes misent sur une hausse du résultat par action de 15,9% qui atteindra ainsi 17,65 euros par action. Dans l’ensemble, l’assureur allemand peut se préparer à une belle année 2019. L’Association des Assureurs allemands (Gesamtverband der Deutschen Versicherungswirtschaft ou GDV) attend une nouvelle hausse des primes d’environ 2%.

Opportunités: Avec le ETT (symbole : ETINS) sur le STOXX™ Europe 600 Insurance Index, les investisseurs peuvent choisir un placement diversifié dans le secteur. Le produit se présente sans commission de gestion et participe à l’identique au sous-jacent.² L’indice est composé de 35 sociétés, le rendement en dividendes s’élève à 4,3%. Les distributions sont prises en compte sur une base nette. Le Callable Worst of Kick-In GOAL (symbole : KCNGDU) sur Zurich Insurance propose en revanche un placement partiellement couvert dans le secteur des assurances. Le produit offre un rendement latéral de 9,4% avec une marge de sécurité de 27,4%.

Risques: il n’existe aucune protection du capital pour les produits. Une évolution négative de l’actif sous-jacent entraîne des pertes correspondantes pour l’ETT. En revanche, les Worst of Kick-In GOALs bénéficient d’une protection du capital sous conditions. Si pendant la durée de l’investissement le sous-jacent atteint ou franchit une seule fois le Kick-In Level (barrière) et qu’en plus la fonction Callable ne s’applique pas, la cote du sous-jacent doit remonter au moins au niveau du Strike Level à l’échéance. Dans le cas contraire, le remboursement s’effectuera sous la forme d’un nombre d’actions déterminé à l’avance. Par ailleurs, avec les produits structurés, l’investisseur supporte le risque d’émetteur. Cela signifie qu’en cas d’insolvabilité d’UBS SA, le capital investi peut être perdu, indépendamment de l’évolution du sous-jacent.

Vous trouverez davantage de produits UBS et des informations sur les opportunités et les risques à l’adresse ubs.com/keyinvest.

STOXX™ Europe 600 Insurance Index (5 ans)

La tendance haussière observée entre 2016 et 2018 a adopté une tendance latérale dans le domaine des 600 points. Au total, l’indice sectoriel enregistre une performance positive sur cinq ans.

Source: UBS AG, Bloomberg

Valeurs du: 13.02.2019

Zurich Insurance vs. SMI™
(5 ans, aux fins d’illustration uniquement, données en %)¹

L’action Zurich Insurance a fluctué ces dernières années. Même lorsque le titre subissait des variations plus fortes que l’ensemble du marché, il s’en sortait au final mieux que le SMI™.

Source: UBS AG, Bloomberg

Valeurs du: 13.02.2019

¹) La performance passée n’indique pas les résultats futures.
²) Les condition des ETTs sont vérifiés annuellement et peuvent être ajustées avec un délai de 13 mois après la publication.

ETT sur STOXX™ Europe 600 Insurance Index

Symbol ETINS
SVSP Name Tracker Certifikat
SVSP Code 1300
Sous-jacent STOXX™ Europe 600 Insurance Net Return Index
Devise EUR
Rapport de souscription 1:1
Frais de gestion 0.00% p.a.²
Participation 100%
Echéance Open End
Émetteur UBS AG, London
Bid/Ask EUR 600.50 / 604.00
 

5.00% p.a. Callable Kick-In GOAL sur Zurich Insurance

Symbol KCNGDU
SVSP Name Barrier Reverse Convertible
SPVSP Code 1230 (Callable)
Sous-jacent Zurich Insurance
Devise CHF
Coupon 5.00% p.a.
Rendement latéraux 9.38% / 5.55% p.a.
Kick-In Level (Distance) CHF 231.825 (27.55%)
Echéance 05.10.2020
Émetteur UBS AG, London
Bid/Ask 97.95% / 98.95%
 

Vous trouverez davantage de produits UBS et des informations sur les opportunités et les risques à l’adresse ubs.com/keyinvest.

Source: UBS AG, Bloomberg

Valeurs du: 13.02.2019

Apérçu du marché

Index Citation Semaine¹
SMI™ 9’164.06 0.2%
SLI™ 1’417.38 0.1%
S&P 500™ 2’753.03 0.8%
Euro STOXX 50™ 3’202.37 -0.3%
S&P™ BRIC 40 4’178.84 0.0%
CMCI™ Compos. 905.13 -0.9%
Gold (troy ounce) 1’315.10 USD 0.1%

¹ Changement basé sur le cours de clôture du jour précédent par rapport au cours de clôture de la semaine dernière.

SMI™ vs. VSMI™ 1 année

L’index VSMI™ est calculé depuis 2005. Il affiche la volatilité des actions inclus dans le SMI™ index. Pour la calculation, un portefeuille est utilisé qui ne réagit qu’au variations de la volatilité au lieu des variations des prix. En le faisant, la méthodologie du VSMI™ utilise la volatilité carré, connu sous le terme variance, des options sur le SMI avec 30 jours jusqu’à l’échéance négociées à la Bourse Eurex.

Source: UBS AG, Bloomberg

Valeurs du: 13.02.2019

Spotify / Twitter
Un duo d’une très grande portée

Qu’il s’agisse d’écouter de la musique en allant au travail ou d’écrire rapidement un tweet le soir, nombreux sont ceux qui ont intégré Spotify et Twitter dans leur quotidien. À la fin 2018, le prestataire de streaming et le service de messages courts comptaient à eux deux plus de 500 millions d’utilisateurs actifs. Ce duo constitue également une base intéressante pour un Early Redemption (ER) Kick-In GOAL (symbole : KCTLDU). Ce produit promet un rendement latéral de 14,5% p.a. Bien que les deux actions aient cédé du terrain depuis son émission en novembre 2018, Twitter dispose encore d’une marge de sécurité de plus de 40% malgré son statut actuel de «Worst Performer».

À l’instar d’un grand nombre d’actions Internet, Spotify et Twitter ont démarré l’année en fanfare.¹ Le duo a toutefois subi une accalmie après que les deux entreprises ont publié leurs résultats. À cet égard, Spotify a pour la première fois enregistré un bénéfice trimestriel pour ses opérations – alors que les analystes pensaient que l’entreprise continuerait d’évoluer dans le rouge. Avec une croissance de 30%, la plateforme de musique a réussi à satisfaire quelque peu les attentes en termes de chiffre d’affaires pour le dernier trimestre 2018, mais les investisseurs ont manifestement été contrariés par les perspectives en provenance de Suède. En effet, Spotify prévoit entre autres un recul de sa brute marge pour 2019. (Source : Thomson Reuters, article de presse, 06.02.2019)

Twitter a finalement présenté un cas de figure similaire. Le service de messages courts américain a divulgué de solides résultats pour le quatrième trimestre 2019, avec une croissance de son chiffre d’affaires de 24%, notamment grâce à la hausse des revenus dans ses activités avec des publicités vidéo. En parallèle, l’entreprise de médias sociaux a gagné plus que ce que le consensus attendait. Mais la direction de Twitter a également déçu les investisseurs en laissant entrevoir des chiffres d’affaires entre 715 millions et 775 millions de dollars américains pour le premier trimestre 2019. Le point central de cette fourchette se situe en dessous des volumes d’affaires attendus en moyenne par les analystes auparavant. (Source : Thomson Reuters, article de presse, 07.02.2019)

Opportunités: Le ER Kick-In GOAL (symbole : KCTLDU) offre une alternative à un investissement direct dans Spotify et Twitter. Tant qu’aucune des deux actions n’atteindra ou ne passera en dessous de la barrière, le produit structuré produira à l’échéance le rendement maximal de 14,5% p.a. Actuellement, les sous-jacents évoluent plus de 40% au-dessus du Kick-In Level. La fonction Early Redemption sera utilisée pour la première fois le 7 novembre 2019. Si la cote de Spotify et de Twitter atteint ou dépasse le cours initial lors de ce jour d’observation trimestrielle ou lors d’un des suivants, le Kick-In GOAL sera exigible avant terme. Dans ce cas, les investisseurs recevront quelques jours plus tard un virement comprenant l’intégralité du nominal ainsi que le pro rata du coupon sur leur compte.

Risques: les Kick-In GOALs ne bénéficient d’aucune protection du capital. Si, pendant la durée de l’investissement, l’un des sous-jacents atteint une seule fois la barrière respective («Kick-In Level») ou est inférieur à celle-ci, et que la fonction de remboursement anticipé ne s’applique pas, le remboursement par amortissement en espèces à l’échéance est basé sur la performance la plus faible (base Strike) du duo (au maximum toutefois à la valeur nominale majorée du coupon). Dans un tel cas, des pertes sont probables. Par ailleurs, avec les produits structurés, l’investisseur supporte le risque d’émetteur. Cela signifie qu’en cas d’insolvabilité d’UBS SA, le capital investi peut être perdu, indépendamment de l’évolution du sous-jacent.

Vous trouverez davantage de produits UBS et des informations sur les opportunités et les risques à l’adresse ubs.com/keyinvest.

Spotify Technology vs. Twitter
(depuis l’introduction en bourse de Spotify, aux fins d’illustration uniquement, données en %)¹

Source: UBS AG, Bloomberg

Valeurs du: 13.02.2019

12.00% p.a. Early Redemption Kick-In GOAL sur Spotify Technology / Twitter

Symbol KCTLDU
SVSP Name Barrier Reverse Convertible
SPVSP Code 1230 (Auto-Callable)
Sous-jacent Spotify Technology / Twitter
Devise USD
Coupon 12.00% p.a.
Rendement latéraux 16.29% (12.84% p.a.)
Kick-In Level (Distance)
Spotify: USD 72.885 (49.22%)
Twitter: USD 17.495 (43.78%)
Echéance 08.05.2020
Émetteur UBS AG, London
Bid/Ask 97.50% / 98.50%
 

Vous trouverez davantage de produits UBS et des informations sur les opportunités et les risques à l’adresse ubs.com/keyinvest.

Source: UBS AG, Bloomberg

Valeurs du: 13.02.2019

¹) La performance passée n’indique pas les résultats futures.
²) Les condition des ETTs sont vérifiés annuellement et peuvent être ajustées avec un délai de 13 mois après la publication.

This material has been prepared by UBS AG or one of its affiliates («UBS»). This material is for distribution only as permitted by law. It is not prepared for the needs of any specific recipient. It is published solely for information and is not a solicitation or offer to buy or sell any securities or related financial instruments (“Instruments”). UBS makes no representation or warranty, either express or implied, on the completeness or reliability of the information contained in this document (“Information”) except that concerning UBS AG and its affiliates. The Information should not be regarded by recipients as a substitute for using their own judgment. Any opinions expressed in this material may change without notice and may be contrary to opinions expressed by other business areas of UBS as a result of using different assumptions or criteria. UBS is under no obligation to update the Information. UBS, its officers, employees or clients may have or have had an interest in the Instruments and may at any time transact in them. UBS may have or have had a relationship with entities referred to in the Information. Neither UBS nor any of its affiliates, or their officers or employees, accepts any liability for any loss arising from use of the Information. This presentation is not a basis for entering into a transaction. Any transaction between you and UBS will be subject to the detailed provisions of the term sheet, confirmation or electronic matching systems relating to that transaction. Clients wishing to effect transactions should contact their local sales representative.
This information is communicated by UBS AG and/or its affiliates («UBS»). * (see below) UBS may from time to time, as principal or agent, have positions in, or may buy or sell, or make a market in any securities, currencies, financial instruments or other assets underlying the product to which this website relates (the «Structured Product»). UBS may provide investment banking and other services to and/or have officers who serve as directors of the companies referred to in this website. UBS’s trading and/or hedging activities related to the Structured Product may have an impact on the price of the underlying asset and may affect the likelihood that any relevant barrier or relevant trigger event is crossed or triggered. UBS has policies and procedures designed to minimise the risk that officers and employees are influenced by any conflicting interest or duty and that confidential information is improperly disclosed or made available. UBS may pay or receive brokerage or retrocession fees in connection with the Structured Product described herein. In respect of any Structured Product that is a security, UBS may, in certain circumstances, sell the Structured Product to dealers and other financial institutions at a discount to the issue price or rebate to them for their own account some proportion of the issue price. Further information is available on request. Structured Products are complex and may involve a high risk of loss. Prior to purchasing the Structured Product you should consult with your own legal, regulatory, tax, financial and accounting advisors to the extent you consider it necessary, and make your own investment, hedging and trading decisions (including decisions regarding the suitability of the Structured Product) based upon your own judgement and advice from those advisers you consider necessary. Save as otherwise expressly agreed in writing, UBS is not acting as your financial adviser or fiduciary in relation to the Product. UBS generally hedges its exposure to Structured Products, although it may elect not to hedge or to partially hedge any Structured Product. UBS’s hedging activity may be conducted through transactions in the underlying asset, index or instrument or in options, futures or other derivatives related to the underlying asset, index or instrument on publicly traded markets or otherwise, and may have an impact on the price of the under-lying asset. If a transaction is cash settled, UBS will generally unwind or offset any hedge it has for such Structured Product in close proximity to the relevant valuation time or period. In some cases, this activity may affect the value of the Structured Product. Unless stated otherwise in this document, (i) this document is for information purposes only and should not be construed as an offer, personal recommendation or solicitation to purchase the Structured Product and should not be treated as giving investment advice, and (ii) the terms of any investment in the Structured Product will be exclusively subject to the detailed provisions, including risk considerations, contained in the more detailed legal documentation that relates to the Structured Product (being the confirmation, information memorandum, prospectus or other issuer documentation as relevant). UBS makes no representation or warranty relating to any information herein which is derived from independent sources. This document shall not be copied or reproduced without UBS’s prior written permission. In respect of any Structured Product that is a security, no action has been or will be taken in any jurisdiction that would permit a public offering of the Product, save where explicitly stated in the issuer documentation. The Structured Product must be sold in accordance with all applicable selling restrictions in the jurisdictions in which it is sold.
© UBS 2018. All rights reserved. UBS prohibits the forwarding of this information without the approval of UBS.
Weekly Hits: Assureurs européens, Spotify & Twitter2019-02-15T11:58:05+01:00

Weekly Hits: European Insurers, Spotify & Twitter

KeyInvest Weekly Hits

Friday, 15.02.2019

  • Topic 1: European Insurers - A good start into the reporting season
  • Topic 2: Spotify and Twitter - Two platforms with tremendous reach

European Insurers
A good start into the reporting season

The insurance industry has now entered the latest financial reporting season too. Zurich Insurance was the first Swiss insurance company to release its figures for the last fiscal year, while in Germany Munich Re was the frontrunner. Both companies presented squeaky clean balance sheets and exceeded analysts› expectations, and their strong operating profits are reflected in the share prices. The pair is ahead of the market average for the year, and Munich Re shares have just reached an all-time high, while Zurich shares are within sight of the mark.¹ The ETT tracker certificate (symbol: ETINS) for the STOXX™ Europe 600 Insurance Index allows full participation in the growth of the industry with broad diversification.² The Kick-In GOAL (Symbol: KCNGDU) on Zurich Insurance gives conservative investors an opportunity to take a position in the market. A 9.4 percent return is possible with this structured product even if prices move sideways.

Zurich Insurance recorded impressive full-year results with a net profit of USD 3.72 billion that exceeded the highest analyst estimate of USD 3.56 billion. The reported operating profit of 4.57 billion US dollars was also significantly above the consensus estimate. «We have further increased profitability and lowered costs,» said Zurich Chief Executive Mario Greco, commenting on the company’s good numbers. (Source: Zurich Insurance press release of February 2, 2019) Zurich’s goals remain unchanged, as the Group is striving for an after-tax operating profit for the years 2017 – 2019 representing more than twelve percent return on capital. For last year, this figure was 12.1 percent. And shareholders should profit from this success, as for 2018 the Executive Board has proposed a dividend of 19 Swiss francs per share, which is one franc higher than last year.

Munich Re is increasing its dividend as well after announcing good results: For 2018 the world’s largest reinsurer recorded a net profit of approximately 2.3 billion euros, coming after a mere 0.4 billion euros for the previous year. Shareholders can look forward to a 7.5 percent dividend increase, up to 9.25 euros per share.
Over the next few weeks we will find out how many other European insurers will be able to keep pace with Zurich Insurance and Munich Re. Swiss Re and AXA, for example, will be releasing their books on February 21, followed by Swiss Life on February 26 and Baloise on March 7. The greatest anticipation swirls around Allianz: Europe’s largest insurance group will be releasing its figures on February 15. According to Thomson Reuters, analysts are expecting a 15.9 percent rise in earnings per share to 17.65 euros. The German insurance industry can expect 2019 to be a good year overall, the German Insurance Association GDV is projecting premiums to further increase by roughly two percent.

Opportunities: The ETT tracker certificate on the STOXX™ Europe 600 Insurance Index (symbol: ETINS) affords investors a diversified investment opportunity in the industry. This product has no annual management fee, thus tracking the performance of the underlying index exactly.² The index is comprised of 35 stocks; the dividend yield is 4.3 percent. Distributions are accounted on a net basis. The Callable Worst of Kick-In GOAL (symbol: KCNGDU) on Zurich Insurance is a partially protected vehicle for investment in the insurance industry. The product features a risk buffer of 27.4 percent and a sideways yield of 9.4 percent.

Risks: The products are not capital-protected investments. Negative performance of the underlying stock results in corresponding loss in value for the ETT. In contrast, Worst of Kick-In GOALs do offer contingent capital protection. If the underlying is quoted at or below the kick-in level (barrier) once during the product term and the callable function is not triggered, the underlying has to at least trade back at the strike level by the expiration date. If not, payout takes place in the form of delivery of a fixed number of shares. In addition, the investor bears issuer risk with structured products, which means capital invested may be lost if UBS AG should go bankrupt, regardless of the performance of the underlying.

More UBS products and further information on the risks and opportunities are available at ubs.com/keyinvest.

STOXX™ Europe 600 Insurance Index (5 years)

The uptrend that lasted from 2016 to 2018 gave way to sideway trading in the 600 point range. The sector index’s bottom-line performance has been good over a five-year period.

Source: UBS AG, Bloomberg

As of 13.02.2019

Zurich Insurance vs. SMI™
(five years, for illustrative purposes only, figures in %)¹

Zurich Insurance shares have traded up and down in recent years. The stock has been slightly more volatile than the overall market, but has ultimately performed the SMI™.

Source: UBS AG, Bloomberg

As of: 13.02.2019

¹) Please be aware that past performance does not indicate future results.
²) The conditions of ETTs are reviewed on a yearly basis and can be adjusted with a deadline of 13 months after the announcement.

ETT on STOXX™ Europe 600 Insurance Index

Symbol ETINS
SVSP Name Tracker Certificates
SPVSP Code 1300
Underlying STOXX™ Europe 600 Insurance Net Return Index
Currency EUR
Ratio 1:1
Administration fee 0.00% p.a.²
Expiry Open End
Participation 100%
Issuer UBS AG, London
Bid/Ask EUR 600.50 / 604.00
 

5.00% p.a. Callable Kick-In GOAL on Zurich Insurance

Symbol KCNGDU
SVSP Name Barrier Reverse Convertible
SPVSP Code 1230 (Callable)
Underlying Zurich Insurance
Currency CHF
Coupon 5.00% p.a.
Sideways return 9.38% / 5.55% p.a.
Kick-In Level (Distance) CHF 231.825 (27.55%)
Sideways return 9.38% / 5.55% p.a.
Expiry 05.10.2020
Issuer UBS AG, London
Bid/Ask 97.95% / 98.95%
 

More UBS products and further information on the risks and opportunities are available at ubs.com/keyinvest.

Source: UBS AG, Bloomberg

As of: 13.02.2019

Market overview

Index Quotation Week¹
SMI™ 9’164.06 0.2%
SLI™ 1’417.38 0.1%
S&P 500™ 2’753.03 0.8%
Euro STOXX 50™ 3’202.37 -0.3%
S&P™ BRIC 40 4’178.84 0.0%
CMCI™ Compos. 905.13 -0.9%
Gold (troy ounce) 1’315.10 USD 0.1%

¹ Change based on the closing price of the previous day compared to the closing price a week ago.

SMI™ vs. VSMI™ 1 year

smi vs vsmi

The VSMI™ Index is calculated since 2005. It shows the volatility of the stocks within the SMI™ index. A portfolio which reacts only to changes in volatility instead of volatility itself is relevant for the calculation. Thereby, the VSMI™ methodology uses the squared volatility, known as variance, of the SMI options with remaining time to expiry of 30 days traded at the Eurex.

Source: UBS AG, Bloomberg

As of: 13.02.2019

Spotify and Twitter
Two platforms with tremendous reach

Whether listening to music on the way to work or popping off a quick tweet in the evening – for many people, Spotify and Twitter are an integral part of everyday life. Together the streaming provider and short message service had more than half a billion active users at the end of 2018. The two make for an interesting Early Redemption (ER) Kick-In GOAL product too (symbol: KCTLDU). This product offers a potential sideways annualized yield of 14.5 percent p.a. Both stocks have declined since their IPOs in November 2018, the current worst-performer of the two, Twitter, still has a safety buffer of more than 40 percent.

Spotify, Twitter and many other internet stocks got off to a strong start to the year¹, but the two lost momentum after releasing their financials. Spotify announced recording an operating profit for the first quarter ever despite analysts expecting the company to remain in the red. Growing at a rate of 30 percent, the music platform managed to roughly meet sales expectations for the period October to December 2018. Investors were apparently concerned about the outlook for this Swedish company, as Spotify is forecasting declining gross margin for 2019 among other things. (Source: Thomson Reuters Media Report, February 6, 2019)

The US short message service Twitter has recently found itself in a similar situation, reporting strong figures for the fourth quarter of 2019, partly on rising video advertising income, which contributed to a 24 percent increase in sales. The social media company reported better-than-expected earnings as well, yet investors were still disappointed about the outlook for Twitter. For the first quarter of 2019 management estimates sales will range between 715 and 775 million US dollars, the mid-point of which is below the average sales previously projected by analysts. (Source: Thomson Reuters Media Report, 2/7/2019)

Opportunities: The ER Kick-In GOAL is an alternative option to directly investing in Spotify and Twitter (symbol: KCTLDU). As long as neither of the stocks falls to or below their respective barrier, the structured product can afford an annualized yield of up to 14.5 percent at maturity. The underlying stocks are currently trading more than 40 percent above the kick-in level. The first possible early redemption is on November 7, 2019. If Spotify and Twitter trade at or above the starting level on this day or any other quarterly observation day, the Kick-in GOAL expires early. In such case, investors will receive the full nominal amount plus pro rata coupon transferred to their account a few days later.

Risks: Kick-In GOALs are not capital-protected investments. If one of the underlyings trades at or below the applicable kick-in level (barrier) during the product term and the early redemption feature cannot apply, the product may be redeemed on the expiry date in cash based on the price of the weaker performing of the two (relative to the strike, not to exceed nominal value plus coupon). Losses are likely in such case. In addition, investors in structured products bear issuer risk, which means capital invested may be lost if UBS AG should go bankrupt, regardless of the performance of the underlying.

More UBS products and further information on the risks and opportunities are available at ubs.com/keyinvest.

Spotify Technology vs. Twitter
(since Spotify IPO, for illustrative purposes only; figures in %)¹

Source: UBS AG, Bloomberg

As of: 13.02.2019

12.00% p.a. Early Redemption Kick-In GOAL on Spotify Technology / Twitter

Symbol KCTLDU
SVSP Name Barrier Reverse Convertibles
SPVSP Code 1230 (Auto-Callable)
Underlyings Spotify Technology / Twitter
Currency USD
Coupon 12.00% p.a.
Sideways return 16.29% (12.84% p.a.)
Kick-In Level (Distance)
Spotify: USD 72.885 (49.22%)
Twitter: USD 17.495 (43.78%)
Expiry 08.05.2020
Issuer UBS AG, London
Bid/Ask 97.50% / 98.50%
 

More UBS products and further information on the risks and opportunities are available at ubs.com/keyinvest.

Source: UBS AG, Bloomberg

As of: 13.02.2019

¹) Please be aware that past performance does not indicate future results.
²) The conditions of ETTs are reviewed on a yearly basis and can be adjusted with a deadline of 13 months after the announcement.

This material has been prepared by UBS AG or one of its affiliates («UBS»). This material is for distribution only as permitted by law. It is not prepared for the needs of any specific recipient. It is published solely for information and is not a solicitation or offer to buy or sell any securities or related financial instruments (“Instruments”). UBS makes no representation or warranty, either express or implied, on the completeness or reliability of the information contained in this document (“Information”) except that concerning UBS AG and its affiliates. The Information should not be regarded by recipients as a substitute for using their own judgment. Any opinions expressed in this material may change without notice and may be contrary to opinions expressed by other business areas of UBS as a result of using different assumptions or criteria. UBS is under no obligation to update the Information. UBS, its officers, employees or clients may have or have had an interest in the Instruments and may at any time transact in them. UBS may have or have had a relationship with entities referred to in the Information. Neither UBS nor any of its affiliates, or their officers or employees, accepts any liability for any loss arising from use of the Information. This presentation is not a basis for entering into a transaction. Any transaction between you and UBS will be subject to the detailed provisions of the term sheet, confirmation or electronic matching systems relating to that transaction. Clients wishing to effect transactions should contact their local sales representative.
This information is communicated by UBS AG and/or its affiliates («UBS»). * (see below) UBS may from time to time, as principal or agent, have positions in, or may buy or sell, or make a market in any securities, currencies, financial instruments or other assets underlying the product to which this website relates (the «Structured Product»). UBS may provide investment banking and other services to and/or have officers who serve as directors of the companies referred to in this website. UBS’s trading and/or hedging activities related to the Structured Product may have an impact on the price of the underlying asset and may affect the likelihood that any relevant barrier or relevant trigger event is crossed or triggered. UBS has policies and procedures designed to minimise the risk that officers and employees are influenced by any conflicting interest or duty and that confidential information is improperly disclosed or made available. UBS may pay or receive brokerage or retrocession fees in connection with the Structured Product described herein. In respect of any Structured Product that is a security, UBS may, in certain circumstances, sell the Structured Product to dealers and other financial institutions at a discount to the issue price or rebate to them for their own account some proportion of the issue price. Further information is available on request. Structured Products are complex and may involve a high risk of loss. Prior to purchasing the Structured Product you should consult with your own legal, regulatory, tax, financial and accounting advisors to the extent you consider it necessary, and make your own investment, hedging and trading decisions (including decisions regarding the suitability of the Structured Product) based upon your own judgement and advice from those advisers you consider necessary. Save as otherwise expressly agreed in writing, UBS is not acting as your financial adviser or fiduciary in relation to the Product. UBS generally hedges its exposure to Structured Products, although it may elect not to hedge or to partially hedge any Structured Product. UBS’s hedging activity may be conducted through transactions in the underlying asset, index or instrument or in options, futures or other derivatives related to the underlying asset, index or instrument on publicly traded markets or otherwise, and may have an impact on the price of the under-lying asset. If a transaction is cash settled, UBS will generally unwind or offset any hedge it has for such Structured Product in close proximity to the relevant valuation time or period. In some cases, this activity may affect the value of the Structured Product. Unless stated otherwise in this document, (i) this document is for information purposes only and should not be construed as an offer, personal recommendation or solicitation to purchase the Structured Product and should not be treated as giving investment advice, and (ii) the terms of any investment in the Structured Product will be exclusively subject to the detailed provisions, including risk considerations, contained in the more detailed legal documentation that relates to the Structured Product (being the confirmation, information memorandum, prospectus or other issuer documentation as relevant). UBS makes no representation or warranty relating to any information herein which is derived from independent sources. This document shall not be copied or reproduced without UBS’s prior written permission. In respect of any Structured Product that is a security, no action has been or will be taken in any jurisdiction that would permit a public offering of the Product, save where explicitly stated in the issuer documentation. The Structured Product must be sold in accordance with all applicable selling restrictions in the jurisdictions in which it is sold.
© UBS 2018. All rights reserved. UBS prohibits the forwarding of this information without the approval of UBS.
Weekly Hits: European Insurers, Spotify & Twitter2019-02-15T12:00:25+01:00

Börsenausblick: Das Konjunkturgespenst geht um

KeyInvest Blog

11. Februar 2019 – UBS Wochenkommentar Rück-/Ausblick

Börsenausblick: Das Konjunkturgespenst geht um

In der laufenden Berichtssaison zeigt sich, dass die US-Unternehmen ihren Wachstumslauf Ende 2018 fortsetzen konnten. Gleichwohl trübte sich die Stimmung an den Börsen zuletzt etwas ein. Mehr denn je zerbrechen sich Investoren den Kopf darüber, ob und wie stark Brexit und Zollstreit den Konjunktur- und damit auch den Gewinnmotor abwürgen. Diesbezüglich könnten die Jahreszahlen sowie der Ausblick von Nestlé neue Aufschlüsse liefern.

„Mässigeres Wachstum angesichts globaler Unsicherheiten“ – bereits in der Überschrift ihrer Konjunkturprognose bringt die Europäische Kommission die aktuelle makroökonomische Grosswetterlage auf den Punkt. Folgerichtig hat die Institution ihren Ausblick zurückgeschraubt. Für die Europäische Union (EU) rechnet sie im laufenden Jahr mit einem BIP-Wachstum von 1.5%. Noch im Herbst hatte die Kommission mit einer Steigerung von 1.9% gerechnet. Vor allem bei grossen Mitgliedsstaaten wie Deutschland, Italien und den Niederlanden haben die Experten den Rotstift angesetzt. Wenig überraschend nennen sie die handelspolitischen Spannungen sowie den Brexit als zentrale Unsicherheitsfaktoren. Pierre Moscovici, EU-Kommissar für Wirtschafts- und Finanzangelegenheiten, Steuern und Zoll, kann auch positive Entwicklungen, allen voran die Beschäftigung, vermelden. „Das Wachstum dürfte in der zweiten Hälfte dieses Jahres und im Jahr 2020 allmählich wieder anziehen“, gibt sich der Franzose vorsichtig optimistisch. (Quelle: EU-Kommission, Medienmitteilung, 07.02.2019)

US-Konzerne in Top-Form

An der Börse kam die Winterprognose der EU-Kommission dennoch nicht gut an. Am Tag vor der Publikation hatte der STOXXTM Europe 600 Index noch ein Verlaufshoch von 365.91 Punkten erreicht. Bis zum Wochenende büsste der Benchmark für den europäischen Aktienmarkt gegenüber dem Top mehr als 2% ein. Auch die Wall Street drosselte nach der Rallye der vergangenen Wochen das Tempo. Neben der Makroökonomie steht diesseits wie jenseits des Atlantiks die Berichtssaison im Fokus. Mittlerweile hat das Gros der Unternehmen seine Resultate vorgelegt.

Die US-Grosskonzerne präsentieren sich weiterhin in Top-Form. Für zwei von drei im S&P 500TM Index enthaltene Unternehmen lagen die Zahlen per 8. Februar 2019 vor. Laut einer Auswertung von Factset konnten davon 71 Prozent die durchschnittlichen Analystenerwartungen beim Gewinn je Aktie übertreffen. Momentan geht der Konsens davon aus, dass die Indexmitglieder ihren Überschuss im 4. Quartal 2018 um durchschnittlich 13.3 Prozent gesteigert haben. Wird diese Prognose Realität, wären die S&P 500TM-Konzerne das fünfte Quartal nacheinander prozentual zweistellig gewachsen. Allerdings geht die Konjunkturabkühlung nicht spurlos am Unternehmenssektor vorbei. Für das laufende erste Quartal 2019 rechnen die Analysten mit einem Ergebnisrückgang im US-Leitindex. (Quelle: Factset, „Earnings Insight, 08.02.2019)

Nestlé im Rampenlicht

Auf dem alten Kontinent steht in dieser Woche ein Highlight der Berichtssaison an. Am Donnerstag veröffentlicht Nestlé die Jahreszahlen. Dabei dürfte vor allem das organische Wachstum im Fokus stehen. Bekanntlich hatte der Lebensmittelkonzern für 2018 eine Umsatzsteigerung von rund drei Prozent in Aussicht gestellt. Ab 9:00 Uhr respektive 14:00 Uhr melden sich CEO Mark Schneider sowie CFO François-Xavier Roger an einem Medien- respektive Investoren-Call zu Wort. Ihr Ausblick könnte wichtige Fingerzeige für die globale Kauflaune respektive Konjunktur liefern. An der Börse präsentierte sich Nestlé vor diesem wichtigen Termin in einer starken Verfassung. Am 6. Februar erreicht der Large Cap ein Allzeithoch von 87.72 Franken (siehe Grafik).1 Gerade die Trader nutzen die Zahlenpublikation mitunter für eine kurzfristige Positionierung. Auf UBS KeyInvest finden sie das zu einer solchen Strategie passende Instrumentarium. Der Basiswert Nestlé ist dort mit mehr als 130 Hebelprodukten – sowohl Long als auch Short – vertreten.

Nestlé 5 Jahre¹

Stand: 11.02.2019; Quelle: UBS AG, Bloomberg

¹) Bitte beachten Sie, dass vergangene Wertentwicklungen keine Indikationen für künftige Wertentwicklungen sind.

Wichtige Unternehmenstermine

Datum Uhrzeit Land Ereignis
12.02.2019 k.A. DE thyssenkrupp Quartalszahlen
13.02.2019 k.A. DE Deutsche Börse Jahreszahlen
13.02.2019 07:00 CH Clariant Jahreszahlen
14.02.2019 06:00 CH Sulzer Jahreszahlen
14.02.2019 06:30 CH Schindler Jahreszahlen
14.02.2019 07:00 CH Credit Suisse Jahreszahlen
14.02.2019 07:15 CH Nestlé Jahreszahlen
15.02.2019 07:00 DE Allianz Jahreszahlen

Stand: 11.02.2019; Quelle: Thomson Reuters

Weitere Blogeinträge:

Ein wahrer Luxus

Das «R»-Wort machte zuletzt an den Kapitalmärkten wieder einmal die Runde. Nach einem starken Start in das Börsenjahr kam verstärkt die Diskussion um eine drohende Rezession in wichtigen Wirtschaftsräumen auf. Enttäuschende Unternehmensberichte und verhaltene Ausblicke liessen die Kurse in der vergangenen Woche zunächst absacken.

Der Terminkalender füllt sich

Das mit der Inflation ist derzeit so eine Sache: Jenseits des Atlantiks, also Richtung Westen, ist die Teuerung auf dem Rückzug. So fielen in den USA die Preise im Dezember auf 6.5 von 7.1 Prozent im November.

Börsenausblick: Das Konjunkturgespenst geht um2019-02-11T08:23:20+01:00

Weekly Hits: Stratégie de dividendes & Tesla

KeyInvest Weekly Hits

Vendredi, 08.02.2019

  • Thème 1: Stratégie de dividendes - La récolte peut commencer
  • Thème 2: Tesla - Les chaînes de production génèrent des bénéfices

Stratégie de dividendes
La récolte peut commencer

Alors que le revirement des taux s’enlise aux États-Unis, on ne voit toujours aucun signe annonçant la fin de la politique ultra-accommodante ici, en Suisse. Par conséquent, les rendements réalisables sur le marché des obligations en CHF sont bas. A contrario, les rendements en dividendes de plus de 3% générés sur le marché des actions suisse sont assez impressionnants. UBS CIO WM estime cet écart intéressant à moyen terme pour les investisseurs, notamment pour ceux qui se concentrent sur des entreprises qui affichent des distributions de grande qualité. C’est là qu’intervient le Dow Jones Switzerland Select Dividend 15 Index™. Cet indice sonde systématiquement le marché suisse à la recherche de titres distribuant des dividendes attrayants. L’UBS Global Quality Dividend Payers Total Return Index, de son côté, adopte une approche mondiale. Les Open End PERLES offrent un accès simple et rentable aux deux stratégies. Le produit (symbole : SWDIV) qui se concentre sur des titres domestiques est proposé en CHF, tandis que l’UBS Global Quality Dividend Payers Index est disponible en CHF (symbole : DIVQC), en EUR (symbole : DIVQE) ainsi qu’en USD (symbole : DIVQD).

Selon UBS CIO GWM, les entreprises suisses affichent actuellement un niveau d’endettement historiquement bas ainsi qu’une solide rentabilité. Bien qu’on observe une hausse des fusions et acquisitions, tant en Suisse que dans le reste du monde, les experts partent du principe que les coefficients de distribution resteront élevés. Dans la quête de titres à dividendes attrayants, CIO GWM estime que la durabilité ainsi que les rendements des distributions comptent parmi les critères objectifs et courants. La croissance des dividendes, en revanche, serait parfois négligée. Toutefois, les analystes sont d’avis que les entreprises qui affichent des rendements élevés mais qui sont à la traîne en termes de croissance des bénéfices et des dividendes risquent de sous-performer, notamment dans le contexte actuel. (Source : UBS CIO GWM, «Swiss high-quality dividends», Equities, 21.01.2019)

Pour le Dow Jones Switzerland Select Dividend 15 Index™, la croissance des dividendes compte parmi les critères de sélection déterminants. Cette stratégie observe à la loupe la participation aux bénéfices sur une période de trois ans. En plus d’autres paramètres tels que la liquidité des transactions, les rendements des dividendes ainsi que les rendements des capitaux propres jouent aussi un rôle important. L’UBS Global Quality Dividend Payers Index poursuit une approche tout à fait comparable, à une différence près: UBS Research est responsable de la composition de l’indice. Tous les trimestres, les analystes filtrent 30 titres de substance au sein d’un univers international de plus de 3300 actions. À cet égard, ils prennent en compte le taux d’intérêt appliqué aux distributions et les rendements des capitaux propres dans l’évaluation. Les experts se concentrent également sur des sociétés qui enregistrent une croissance durable de leur chiffre d’affaires et de leurs bénéfices. Ils veillent par ailleurs à assurer une diversification saine concernant l’allocation des secteurs et des pays.

Opportunités: la prochaine saison des dividendes débutera dans les semaines à venir et devrait alors capter toute l’attention. Avec les Open End PERLES (symbole : SWDIV), les investisseurs peuvent se positionner tôt sur une sélection de titres de substance suisses via le Dow Jones Switzerland Select Dividend 15 Index™. Ceux qui préfèrent une approche internationale peuvent opter pour l’UBS Global Quality Dividend Payers Index qui leur permettra de choisir entre trois monnaies de transaction (voir à droite). En toute logique, ces deux indices sont des indices Total Return. Cela signifie que les éventuels versements de dividendes sont pris en compte dans le calcul du sous-jacent correspondant.

Risques: les Open End PERLES ne bénéficient d’aucune protection du capital. Il peut y avoir des pertes lorsque l’indice sous-jacent baisse. Il faut également prendre en compte le risque de change, car la monnaie des membres de l’indice peut être différente de celle dans laquelle le certificat présenté est négocié. Par ailleurs, avec les produits structurés, l’investisseur supporte le risque d’émetteur. Cela signifie qu’en cas d’insolvabilité d’UBS SA, le capital investi peut être perdu, indépendamment de l’évolution du sous-jacent.

Vous trouverez davantage de produits UBS et des informations sur les opportunités et les risques à l’adresse ubs.com/keyinvest.

Dow Jones Switzerland Select Dividend 15 Index™ vs. SMI™ Index
(5 ans, aux fins d’illustration uniquement, données en%)¹

La recherche ciblée de titres à dividendes attrayants porte ses fruits : d’un point de vue historique, le Dow Jones Switzerland Select Dividend 15 Index™ affiche une nette surperformance par rapport au SMI™.

Source: UBS AG, Bloomberg

Valeurs du: 06.02.2019

UBS Global Quality Dividend Payers Index vs. MSCI™ World Index (5 ans, aux fins d’illustration uniquement, données en %)¹

L’UBS Global Quality Dividend Payers Index a également enregistré des rendements plus élevés que le marché des actions dans son ensemble. Depuis 2016, l’indice se distance à vue d’œil du MSCI™ World Index. ¹) Nous attirons votre attention sur le fait que la performance passée n’est pas un indicateur de l’évolution de valeur future.

Source: UBS AG, Bloomberg

Valeurs du: 06.02.2019

¹) La performance passée n’indique pas les résultats futures.
²) Les condition des ETTs sont vérifiés annuellement et peuvent être ajustées avec un délai de 13 mois après la publication.

Open End PERLES sur Dow Jones Switzerland Select Dividend 15 Index™

Symbol SWDIV
SVSP Name Tracker Certifikat
SVSP Code 1300
Sous-jacent Dow Jones Switzerland Select Dividend 15 Total Return Index™
Devise CHF
Rapport de souscription 10:1
Frais de gestion 0.40% p.a.
Participation 100%
Echéance Open End
Émetteur UBS AG, London
Bid/Ask CHF 207.80 / 209.10
 

Open End PERLES sur UBS Global Quality Dividend Payers Net Total Return Index

Symbol DIVQC
Symbol DIVQD
Symbol DIVQE
SVSP Name Tracker Certifikat
SPVSP Code 1300
Rapport de souscription 1:1
Frais de gestion 1.00% p.a.
Participation 100%
Echéance Open End
Émetteur UBS AG, London
Bid/Ask CHF 266.01 / 268.70
USD 314.22 /317.39
EUR 377.75 / 380.50
 

Vous trouverez davantage de produits UBS et des informations sur les opportunités et les risques à l’adresse ubs.com/keyinvest.

Source: UBS AG, Bloomberg

Valeurs du: 06.02.2019

Apérçu du marché

Index Citation Semaine¹
SMI™ 9’143.00 Pt. 2.0%
SLI™ 1’415.70 Pt. 1.5%
S&P 500™ 2’731.61 Pt. 1.9%
Euro STOXX 50™ 3’212.75 Pt. 1.6%
S&P™ BRIC 40 4’177.63 Pt. 1.1%
CMCI™ Compos. 913.51 Pt. 0.8%
Gold (troy ounce) 1’314.40 USD -0.1%

¹ Changement basé sur le cours de clôture du jour précédent par rapport au cours de clôture de la semaine dernière.

SMI™ vs. VSMI™ 1 année

L’index VSMI™ est calculé depuis 2005. Il affiche la volatilité des actions inclus dans le SMI™ index. Pour la calculation, un portefeuille est utilisé qui ne réagit qu’au variations de la volatilité au lieu des variations des prix. En le faisant, la méthodologie du VSMI™ utilise la volatilité carré, connu sous le terme variance, des options sur le SMI avec 30 jours jusqu’à l’échéance négociées à la Bourse Eurex.

Source: UBS AG, Bloomberg

Valeurs du: 06.02.2019

Tesla
Les chaînes de production génèrent des bénéfices

Pendant très longtemps, les chiffres des bilans de Tesla, le pionnier américain des voitures électriques, sont ressortis dans le rouge. Mais le second semestre 2018 a marqué un tournant puisque le groupe californien a publié des bénéfices pendant deux trimestres consécutifs. Cette tendance positive devrait se poursuivre. Le fondateur de la société, Elon Musk, a annoncé qu’en 2019, la société réaliserait des bénéfices tous les trimestres, notamment grâce au modèle 3 très porteur, qui sera probablement disponible en Europe à partir de février. Seule ombre au tableau, l’objectif de production de plus de 500 000 unités par an prévu initialement pour 2018 ne pourra vraisemblablement être atteint qu’entre le quatrième trimestre 2019 et le deuxième trimestre 2020. (Source : Thomson Reuters, article de presse, 30.01.2019) Le Kick-In GOAL (symbole : KCWSDU) sur Tesla permet de réaliser des bénéfices importants même si le parcours est semé d’embûches. Le produit offre une opportunité de rendement de 19,1% avec une marge de sécurité de 42%.

Malgré ces premiers bénéfices, la société continue d’évoluer en dents de scie, aussi bien dans ses activités opérationnelles qu’au niveau de la bourse. L’action du constructeur automobile américain fait le yoyo entre 280 et 380 dollars américains depuis des mois. Bien que Tesla ait tenu sa promesse de publier un bilan positif en termes de fondamentaux, son CEO charismatique, Elon Musk, est encore très loin de l’objectif fixé. Il se heurte, entre autres, aux difficultés que provoque le conflit entre la Chine et les États-Unis. Afin de compenser la hausse des taxes douanières, Tesla baisse maintenant le prix du modèle 3. Pour contourner ce genre de problème à l’avenir, Tesla veut fabriquer directement en Chine. La production doit commencer au second semestre de cette année dans l’usine de Shanghai avec un objectif de 3000 véhicules de type 3 par semaine. (Source : Thomson Reuters, article de presse, 01.02.2019) Le groupe américain met également en place des mesures pour réduire les coûts. « Nous devons impitoyablement réduire les coûts pour fabriquer des voitures abordables et ne pas faire faillite», a déclaré le patron de Tesla lors d’une conférence d’analystes le 31 janvier.

Opportunités: Malgré ces premiers succès, Tesla doit encore surmonter quelques difficultés. Il pourrait donc être judicieux d’investir dans l’action du constructeur automobile non pas directement, mais avec une protection partielle sous condition. Le Kick-In GOAL offre une opportunité de gain considérable avec une marge de sécurité correcte (symbole : KCWSDU). Le titre émis en décembre 2018 est doté d’un coupon de 15,00% p.a. Étant donné que le Kick-In GOAL cote au-dessous du pair, le rendement s’établit même à 22,8% p.a. actuellement. La barrière se situe à 181,53 dollars américains, elle est donc éloignée du cours actuel par une marge de 42%.

Risques: les Kick-In GOALs ne bénéficient d’aucune protection du capital. Si pendant la durée de l’investissement Tesla atteint ou franchit une seule fois le Kick-In Level, la cote du sous-jacent doit remonter au moins au niveau du Strike Level à l’échéance. Dans le cas contraire, le remboursement s’effectuera en espèces conformément au ratio de souscription. Dans un tel cas, des pertes sont probables. Par ailleurs, avec les produits structurés, l’investisseur supporte le risque d’émetteur. Cela signifie qu’en cas d’insolvabilité d’UBS SA, le capital investi peut être perdu, indépendamment de l’évolution du sous-jacent.

Vous trouverez davantage de produits UBS et des informations sur les opportunités et les risques à l’adresse ubs.com/keyinvest.

Tesla

Source: UBS AG, Bloomberg

Valeurs du: 06.02.2019

15.00% p.a. Kick-In GOAL sur Tesla

Symbol KCWSDU
SVSP Name Barrier Reverse Convertible
SPVSP Code 1230
Sous-jacent Tesla
Devise USD
Coupon 15.00% p.a.
Rendement latéraux 19.83% (23.82% p.a.)
Kick-In Level (Distance)
USD 181.53 (43.06%)
Echéance 05.12.2019
Émetteur UBS AG, London
Bid/Ask 92.72% / 93.72%
 

Vous trouverez davantage de produits UBS et des informations sur les opportunités et les risques à l’adresse ubs.com/keyinvest.

Source: UBS AG, Bloomberg

Valeurs du: 06.02.2019

¹) La performance passée n’indique pas les résultats futures.
²) Les condition des ETTs sont vérifiés annuellement et peuvent être ajustées avec un délai de 13 mois après la publication.

This material has been prepared by UBS AG or one of its affiliates («UBS»). This material is for distribution only as permitted by law. It is not prepared for the needs of any specific recipient. It is published solely for information and is not a solicitation or offer to buy or sell any securities or related financial instruments (“Instruments”). UBS makes no representation or warranty, either express or implied, on the completeness or reliability of the information contained in this document (“Information”) except that concerning UBS AG and its affiliates. The Information should not be regarded by recipients as a substitute for using their own judgment. Any opinions expressed in this material may change without notice and may be contrary to opinions expressed by other business areas of UBS as a result of using different assumptions or criteria. UBS is under no obligation to update the Information. UBS, its officers, employees or clients may have or have had an interest in the Instruments and may at any time transact in them. UBS may have or have had a relationship with entities referred to in the Information. Neither UBS nor any of its affiliates, or their officers or employees, accepts any liability for any loss arising from use of the Information. This presentation is not a basis for entering into a transaction. Any transaction between you and UBS will be subject to the detailed provisions of the term sheet, confirmation or electronic matching systems relating to that transaction. Clients wishing to effect transactions should contact their local sales representative.
This information is communicated by UBS AG and/or its affiliates («UBS»). * (see below) UBS may from time to time, as principal or agent, have positions in, or may buy or sell, or make a market in any securities, currencies, financial instruments or other assets underlying the product to which this website relates (the «Structured Product»). UBS may provide investment banking and other services to and/or have officers who serve as directors of the companies referred to in this website. UBS’s trading and/or hedging activities related to the Structured Product may have an impact on the price of the underlying asset and may affect the likelihood that any relevant barrier or relevant trigger event is crossed or triggered. UBS has policies and procedures designed to minimise the risk that officers and employees are influenced by any conflicting interest or duty and that confidential information is improperly disclosed or made available. UBS may pay or receive brokerage or retrocession fees in connection with the Structured Product described herein. In respect of any Structured Product that is a security, UBS may, in certain circumstances, sell the Structured Product to dealers and other financial institutions at a discount to the issue price or rebate to them for their own account some proportion of the issue price. Further information is available on request. Structured Products are complex and may involve a high risk of loss. Prior to purchasing the Structured Product you should consult with your own legal, regulatory, tax, financial and accounting advisors to the extent you consider it necessary, and make your own investment, hedging and trading decisions (including decisions regarding the suitability of the Structured Product) based upon your own judgement and advice from those advisers you consider necessary. Save as otherwise expressly agreed in writing, UBS is not acting as your financial adviser or fiduciary in relation to the Product. UBS generally hedges its exposure to Structured Products, although it may elect not to hedge or to partially hedge any Structured Product. UBS’s hedging activity may be conducted through transactions in the underlying asset, index or instrument or in options, futures or other derivatives related to the underlying asset, index or instrument on publicly traded markets or otherwise, and may have an impact on the price of the under-lying asset. If a transaction is cash settled, UBS will generally unwind or offset any hedge it has for such Structured Product in close proximity to the relevant valuation time or period. In some cases, this activity may affect the value of the Structured Product. Unless stated otherwise in this document, (i) this document is for information purposes only and should not be construed as an offer, personal recommendation or solicitation to purchase the Structured Product and should not be treated as giving investment advice, and (ii) the terms of any investment in the Structured Product will be exclusively subject to the detailed provisions, including risk considerations, contained in the more detailed legal documentation that relates to the Structured Product (being the confirmation, information memorandum, prospectus or other issuer documentation as relevant). UBS makes no representation or warranty relating to any information herein which is derived from independent sources. This document shall not be copied or reproduced without UBS’s prior written permission. In respect of any Structured Product that is a security, no action has been or will be taken in any jurisdiction that would permit a public offering of the Product, save where explicitly stated in the issuer documentation. The Structured Product must be sold in accordance with all applicable selling restrictions in the jurisdictions in which it is sold.
© UBS 2018. All rights reserved. UBS prohibits the forwarding of this information without the approval of UBS.
Weekly Hits: Stratégie de dividendes & Tesla2019-02-28T13:24:09+01:00

Weekly Hits: Dividend strategy & Tesla

KeyInvest Weekly Hits

Friday, 08.02.2019

  • Topic 1: Dividend strategy - The harvest can be brought in
  • Topic 2: Tesla - Profits rolling off the production line

Dividend strategy
The harvest can be brought in

While the turnaround of interest rates in the US is stagnating, there is still no sign of an end to the ultra-loose monetary policy here in Switzerland – the yields achievable on the CHF bond market are correspondingly poor. In strong contrast to this, the dividend yield of just over 3% being generated on the Swiss equity market is quite impressive. UBS CIO GWM believes that this discrepancy is an interesting proposition for investors in the medium term, particularly for those investors who focus on companies with high-quality distributions. This is exactly where the Dow Jones Switzerland Select Dividend 15 Index™ comes in. This benchmark systematically searches the domestic equity market for attractive dividend stocks. On the other hand, the UBS Global Quality Dividend Payers Total Return Index takes a global approach. Open End PERLES offer simple and cost-effective access to both strategies. The product (symbol: SWDIV) focusing on domestic stocks is denominated in Swiss francs, while the UBS Global Quality Dividend Payers Index is available in Swiss francs (symbol: DIVQC), euros (symbol: DIVQE) and US dollars (symbol: DIVQD).

According to UBS CIO GWM, Swiss companies currently have historically low levels of debt and are robustly profitable. Although the number of mergers and acquisitions is increasing both on a national and global level, experts are acting on the assumption that distribution rates will continue to remain high. According to CIO GWM, sustainability and the distribution yields are just some of the objective and common criteria in the search for attractive dividend stocks. In contrast, dividend growth is sometimes overlooked. However, analysts believe that companies that show high yields but lag behind in terms of profit and dividend growth are likely to underperform, especially in the current environment (Source: UBS CIO GWM, “Swiss high-quality dividends”, Equities, January 21, 2019).

With the Dow Jones Switzerland Select Dividend 15 Index™, dividend growth is one of the key selection criteria. This strategy examines profit sharing over a period of three years, with dividend yields and the return on equity also playing an important role, in addition to other parameters such as trading liquidity. The UBS Global Quality Dividend Payers Index takes an extremely similar approach, albeit with one major difference – UBS Research is responsible for the composition of the index. Every quarter, the analysts filter 30 value stocks out of an international universe of more than 3,300 equities. This evaluation takes into consideration both the interest rate applied to the distribution as well as the return on equity. The experts also focus on equities with sustainable revenue and earnings growth. In addition, the experts ensure that there is healthy diversification within the portfolio in terms of countries and sector allocation.

Opportunities: The next dividend season will begin in the coming weeks and this issue is likely to be brought further into the spotlight. With Open End PERLES (symbol: SWDIV), investors can take up an early position in a selection of Swiss value stocks via the Dow Jones Switzerland Select Dividend 15 Index™. Should the international markets seem more appealing, investors can look to the UBS Global Quality Dividend Payers Index. With this benchmark, investors can choose between three different trading currencies (see right). In the interests of consistency, both benchmarks are total return indices. This means that any dividend payments are reflected in the calculation of each of the underlying assets.

Risks: Open End PERLES do not have capital protection. Losses will be made if the underlying index declines. The currency risk must also be taken into account, as the trading currency of some index constituents may differ from the trading currency of the certificate shown. Investors in structured products are also exposed to issuer risk, which means that the invested capital may be lost if UBS AG becomes insolvent, regardless of the performance of the underlying.

More UBS products and further information on the risks and opportunities are available at ubs.com/keyinvest.

Dow Jones Switzerland Select Dividend 15 Index™ vs. SMI™ Index
(5 years; for illustrative purposes only; figures in %)

Searching specifically for attractive dividend stocks really pays off – historically, the Dow Jones Switzerland Select Dividend 15 Index™ has massively outperformed the SMI™.

Source: UBS AG, Bloomberg

As of 06.02.2019

UBS Global Quality Dividend Payers Index vs. MSCI™ World Index
(five years, for illustrative purposes only, figures in %)¹

The UBS Global Quality Dividend Payers Index has also recorded higher returns than the broad equity market, with the benchmark increasingly outperforming the MSCI™ World Index since 2016. ¹) Please note that past performance is not an indication of future performance.

Source: UBS AG, Bloomberg

As of: 06.02.2019

¹) Please be aware that past performance does not indicate future results.
²) The conditions of ETTs are reviewed on a yearly basis and can be adjusted with a deadline of 13 months after the announcement.

Open End PERLES on Dow Jones Switzerland Select Dividend 15 Index™

Symbol SWDIV
SVSP Name Tracker Certificates
SPVSP Code 1300
Underlying Dow Jones Switzerland Select Dividend 15 Total Return Index™
Currency CHF
Ratio 10:1
Administration fee 0.40% p.a.
Expiry Open End
Participation 100%
Issuer UBS AG, London
Bid/Ask CHF 207.80 / 209.10
 

Open End PERLES on UBS Global Quality Dividend Payers Net Total Return Index

Symbol DIVQC
Symbol DIVQD
Symbol DIVQE
SVSP Name Tracker Certificates
SPVSP Code 1300
Ratio 1:1
Administration fee 1.00% p.a.
Participation 100%
Expiry Open End
Issuer UBS AG, London
Bid/Ask CHF 266.01 / 268.70
USD 314.22 /317.39
EUR 377.75 / 380.50
 

More UBS products and further information on the risks and opportunities are available at ubs.com/keyinvest.

Source: UBS AG, Bloomberg

As of: 06.02.2019

Market overview

Index Quotation Week¹
SMI™ 9’143.00 Pt. 2.0%
SLI™ 1’415.70 Pt. 1.5%
S&P 500™ 2’731.61 Pt. 1.9%
Euro STOXX 50™ 3’212.75 Pt. 1.6%
S&P™ BRIC 40 4’177.63 Pt. 1.1%
CMCI™ Compos. 913.51 Pt. 0.8%
Gold (troy ounce) 1’314.40 USD -0.1%

¹ Change based on the closing price of the previous day compared to the closing price a week ago.

SMI™ vs. VSMI™ 1 year

smi vs vsmi

The VSMI™ Index is calculated since 2005. It shows the volatility of the stocks within the SMI™ index. A portfolio which reacts only to changes in volatility instead of volatility itself is relevant for the calculation. Thereby, the VSMI™ methodology uses the squared volatility, known as variance, of the SMI options with remaining time to expiry of 30 days traded at the Eurex.

Source: UBS AG, Bloomberg

As of: 06.02.2019

Tesla
Profits rolling off the production line

The balance sheets of US electric car pioneer Tesla have long been in the red. However, change has been afoot since the second half of 2018, with the California-based group posting a profit in two successive quarters. This positive trend looks set to continue, as company founder Elon Musk announced that the company would close each quarter in 2019 with a profit. The drivers behind this good performance include the Model 3 car, which the company has pinned its hopes on and is now scheduled to be available on European shores in February. There is, however, some bad news – the production target of more than 500,000 units per year that was previously promised to be met in 2018 will probably only be achieved between the fourth quarter of 2019 and the second quarter of 2020 (Source: Thomson Reuters media report, January 30, 2019). With the Kick-In GOAL (symbol: KCWSDU) on Tesla, great profits can also be made on a bumpy road. The product comes with a risk buffer of 42% and offers a potential return of 19.1%.

Despite these initial profits, Tesla can expect a fluctuating performance, both in its operational business and on the stock exchange. The US car manufacturer’s share has been yo-yoing between 280 and 380 US dollars for months. Although Tesla has kept to its promise of remaining in the black from a fundamental perspective, the CEO of the company Musk is still a long way from achieving his goal. There are many factors causing difficulties for the charismatic head of the company, chief among them being the trade dispute between China and the US. Tesla is now having to slash the price of the Model 3 so that it can offset the higher tariffs. In order to avoid such problems in the future, Tesla wants its manufacturing operations to be carried out directly in China. Production is set to commence in the Shanghai plant in the second half of this year, with the target of 3,000 Model 3 cars rolling off the production line every week (Source: Thomson Reuters media report, February 2, 2019). The US group is also introducing cost-cutting measures. “We have to mercilessly cut costs to ensure that we can build affordable cars and not go broke,» said CEO Elon Musk at an analysts’ conference held on January 31.

Opportunities: Despite the initial profits, Tesla will still have to battle against the odds. It could therefore be sensible to invest in the electric car manufacturer with conditional partial protection rather than directly in the share. The Kick-In GOAL (symbol: KCWSDU) offers a high potential return with a healthy risk buffer. The security issued in December 2018 has an annual coupon of 15%. As the Kick-In GOAL is listed under par, the annual return is currently 22.8%. The barrier currently stands at USD 181.53, i.e. 42% of the current price.

Risks: Kick-In GOALs do not have capital protection. If Tesla touches or falls below the kick-in level once during the term, the underlying stock has to be trading at least at the strike level on maturity. Otherwise, the amount repaid in cash will reflect the subscription ratio. In this case, it is likely that losses will be incurred. Investors in structured products are also exposed to issuer risk, which means that the invested capital may be lost if UBS AG becomes insolvent, regardless of the performance of the underlying.

More UBS products and further information on the risks and opportunities are available at ubs.com/keyinvest.

Tesla

Source: UBS AG, Bloomberg

As of: 06.02.2019

15.00% p.a. Kick-In GOAL on Tesla

Symbol KCWSDU
SVSP Name Barrier Reverse Convertibles
SPVSP Code 1230
Underlyings Tesla
Currency USD
Coupon 15.00% p.a.
Sideways return 19.83% (23.82% p.a.)
Kick-In Level (Distance)
USD 181.53 (43.06%)
Expiry 05.12.2019
Issuer UBS AG, London
Bid/Ask 92.72% / 93.72%
 

More UBS products and further information on the risks and opportunities are available at ubs.com/keyinvest.

Source: UBS AG, Bloomberg

As of: 06.02.2019

¹) Please be aware that past performance does not indicate future results.
²) The conditions of ETTs are reviewed on a yearly basis and can be adjusted with a deadline of 13 months after the announcement.

This material has been prepared by UBS AG or one of its affiliates («UBS»). This material is for distribution only as permitted by law. It is not prepared for the needs of any specific recipient. It is published solely for information and is not a solicitation or offer to buy or sell any securities or related financial instruments (“Instruments”). UBS makes no representation or warranty, either express or implied, on the completeness or reliability of the information contained in this document (“Information”) except that concerning UBS AG and its affiliates. The Information should not be regarded by recipients as a substitute for using their own judgment. Any opinions expressed in this material may change without notice and may be contrary to opinions expressed by other business areas of UBS as a result of using different assumptions or criteria. UBS is under no obligation to update the Information. UBS, its officers, employees or clients may have or have had an interest in the Instruments and may at any time transact in them. UBS may have or have had a relationship with entities referred to in the Information. Neither UBS nor any of its affiliates, or their officers or employees, accepts any liability for any loss arising from use of the Information. This presentation is not a basis for entering into a transaction. Any transaction between you and UBS will be subject to the detailed provisions of the term sheet, confirmation or electronic matching systems relating to that transaction. Clients wishing to effect transactions should contact their local sales representative.
This information is communicated by UBS AG and/or its affiliates («UBS»). * (see below) UBS may from time to time, as principal or agent, have positions in, or may buy or sell, or make a market in any securities, currencies, financial instruments or other assets underlying the product to which this website relates (the «Structured Product»). UBS may provide investment banking and other services to and/or have officers who serve as directors of the companies referred to in this website. UBS’s trading and/or hedging activities related to the Structured Product may have an impact on the price of the underlying asset and may affect the likelihood that any relevant barrier or relevant trigger event is crossed or triggered. UBS has policies and procedures designed to minimise the risk that officers and employees are influenced by any conflicting interest or duty and that confidential information is improperly disclosed or made available. UBS may pay or receive brokerage or retrocession fees in connection with the Structured Product described herein. In respect of any Structured Product that is a security, UBS may, in certain circumstances, sell the Structured Product to dealers and other financial institutions at a discount to the issue price or rebate to them for their own account some proportion of the issue price. Further information is available on request. Structured Products are complex and may involve a high risk of loss. Prior to purchasing the Structured Product you should consult with your own legal, regulatory, tax, financial and accounting advisors to the extent you consider it necessary, and make your own investment, hedging and trading decisions (including decisions regarding the suitability of the Structured Product) based upon your own judgement and advice from those advisers you consider necessary. Save as otherwise expressly agreed in writing, UBS is not acting as your financial adviser or fiduciary in relation to the Product. UBS generally hedges its exposure to Structured Products, although it may elect not to hedge or to partially hedge any Structured Product. UBS’s hedging activity may be conducted through transactions in the underlying asset, index or instrument or in options, futures or other derivatives related to the underlying asset, index or instrument on publicly traded markets or otherwise, and may have an impact on the price of the under-lying asset. If a transaction is cash settled, UBS will generally unwind or offset any hedge it has for such Structured Product in close proximity to the relevant valuation time or period. In some cases, this activity may affect the value of the Structured Product. Unless stated otherwise in this document, (i) this document is for information purposes only and should not be construed as an offer, personal recommendation or solicitation to purchase the Structured Product and should not be treated as giving investment advice, and (ii) the terms of any investment in the Structured Product will be exclusively subject to the detailed provisions, including risk considerations, contained in the more detailed legal documentation that relates to the Structured Product (being the confirmation, information memorandum, prospectus or other issuer documentation as relevant). UBS makes no representation or warranty relating to any information herein which is derived from independent sources. This document shall not be copied or reproduced without UBS’s prior written permission. In respect of any Structured Product that is a security, no action has been or will be taken in any jurisdiction that would permit a public offering of the Product, save where explicitly stated in the issuer documentation. The Structured Product must be sold in accordance with all applicable selling restrictions in the jurisdictions in which it is sold.
© UBS 2018. All rights reserved. UBS prohibits the forwarding of this information without the approval of UBS.
Weekly Hits: Dividend strategy & Tesla2019-02-28T13:23:21+01:00

Neuer Monat, alte Brennpunkte

KeyInvest Blog

4. Februar 2019 – UBS Wochenkommentar Rück-/Ausblick

Neuer Monat, alte Brennpunkte

Die US-Notenbank nimmt im laufenden Zinserhöhungszyklus den Fuss vom Gaspedal. Mit dieser zentralen Botschaft meldete sich das Fed nach seiner jüngsten Sitzung zu Wort. Zwei Tage später lieferte der Arbeitsmarktbericht einen Beleg für die eigentlich starke Verfassung der weltgössten Volkswirtschaft. Positiv reagierten die Märkte auf die Ankündigung von US-Präsident Donald Trump, den Zollstreit mit China beilegen zu wollen. Neben diesem Dauerthema wird die Bilanzsaison die Märkte bis auf weiteres beschäftigen.

Federal Reserve: Ein neues Signalwort

Mehr als eine Dreiviertelstunde nahm sich Fed-Präsident Jerome Powell am 30. Januar Zeit, um nach der jüngsten Notenbanksitzung die geldpolitische Ausrichtung zu erläutern und Fragen der Medienvertreter zu beantworten. Der Offenmarktausschuss hatte zuvor den Schlüsselsatz unverändert bei einer Spanne von 2.25 bis 2.50 Prozent belassen. Hinsichtlich weiterer Schritte möchte Powell „geduldig“ agieren. Dieses Adjektiv zog sich wie eine Art Signalwort durch die Ausführungen des obersten US-Währungshüters. „Die Argumente für Zinserhöhungen sind etwas schwächer geworden“, brachte Powell die neue Vorsicht auf den Punkt. Gleichzeitig verzichtete die Notenbank auf die so genante Forward Guidance. Noch im Dezember hatte das Entscheidungsgremium für 2019 zwei weitere Zinserhöhungen ins Auge gefasst. (Quelle: Thomson Reuters, Medienbericht, 30.01.2019)

US-Konjunktur: Jobmotor läuft auf Hochtouren

Gebannt dürften Powell und seine Fed-Kollegen den jüngsten Arbeitsmarktbericht studiert haben. Im Januar entstanden in den USA ausserhalb der Landwirtschaft 304’000 neue Stellen. Von der Nachrichtenagentur Reuters befragte Experten hatten im Schnitt mit lediglich 165’000 zusätzlichen Jobs gerechnet. Für den Dezember revidierte das Arbeitsministerium die zunächst gemeldete Zahl der neuen Stellen um 90’000 auf jetzt 222’000 nach unten. Zwar hatte der durch einen Haushaltsstreit ausgelöste 35-tägige Stillstand von Teilen der Regierung keinen „erkennbaren“ Einfluss auf den Jobmotor. Gleichwohl zog der „Government Shutdown“ dem Arbeitsministerium zufolge einen leichten Anstieg der Erwerbslosenquote nach sich. Diese viel beachtete Rate erreichte im Januar ein Sieben-Monats-Hoch von 4.0 Prozent. Hier lag der Konsens bei 3.9%. Die durchschnittlichen Stundenlöhne zogen Anfang Jahr um lediglich 0.1% an. Im Dezember lag das Plus noch bei 0.4%. Der abnehmende Inflationsdruck sollte dem Fed bei seiner vorsichtigeren Gangart in die Hände spielen. (Quelle: Thomson Reuters, Medienbericht, 01.02.2019).

Februar: Zahlenflut und Showdown im Zollstreit

Eine zentrale Rolle nimmt für Geldpolitik, Realwirtschaft und Kapitalmärkte der Zollstreit ein. US-Präsident Donald Trump hat jetzt ein Treffen mit seinem chinesischen Amtskollegen Xi Jinping angekündigt. Gleichzeitig gab sich der Republikaner zuversichtlich, dass die beiden Staaten „den größten Deal aller Zeiten“ erreichen könnten. Auch von Seiten Chinas kamen nach zweitägigen Verhandlungen in der US-Hauptstadt versöhnliche Töne. Die Delegation aus Peking sprach von substanziellen Fortschritten. Ob das Gipfeltreffen noch im Februar stattfinden wird, blieb zunächst offen. Die Zeit drängt, da Ende Monat der zwischen den USA und China vereinbarte «Burgfrieden» endet. Sofern bis zum 2. März keine Lösung erreicht wird, möchte Washington wie angekündigt die Einfuhrzölle auf Waren aus der Volksrepublik erhöhen. (Quelle: Thomson Reuters, Medienbericht, 01.02.2019)

Neben dem Zollstreit hält die Bilanzsaison die Märkte bis auf weiteres in Atem. In der neuen Woche stehen hier zu Lande beispielsweise die Finanzberichte von Zurich Insurance und Swisscom (Veröffentlichung jeweils am 07.02.) an. In den USA reihen sich unter anderem Alphabet (04.02.), Disney (05.02.) sowie Eli Lilly (06.02.) in den Zahlenreigen ein. Nicht zuletzt die Reports der Wall Street-Schwergewichte Apple oder Facebook sorgten dafür, dass die Börsen Ende Januar weiter zulegen konnten. Zuvor hatten bereits die geldpolitische Entwicklung sowie die Hoffnung auf ein Ende des Handelsstreits für Kauflaune gesorgt. Kurzum: Die Bilanz für den ersten Monat im Börsenjahr 2019 (siehe Grafik) kann sich sehen lassen.

Ausgewählte Anlageklassen: Performance Januar 2019¹

Stand: 31.01.2019; Quelle: UBS AG, Bloomberg

¹) Bitte beachten Sie, dass vergangene Wertentwicklungen keine Indikationen für künftige Wertentwicklungen sind.

Weitere Blogeinträge:

Ein wahrer Luxus

Das «R»-Wort machte zuletzt an den Kapitalmärkten wieder einmal die Runde. Nach einem starken Start in das Börsenjahr kam verstärkt die Diskussion um eine drohende Rezession in wichtigen Wirtschaftsräumen auf. Enttäuschende Unternehmensberichte und verhaltene Ausblicke liessen die Kurse in der vergangenen Woche zunächst absacken.

Der Terminkalender füllt sich

Das mit der Inflation ist derzeit so eine Sache: Jenseits des Atlantiks, also Richtung Westen, ist die Teuerung auf dem Rückzug. So fielen in den USA die Preise im Dezember auf 6.5 von 7.1 Prozent im November.

Neuer Monat, alte Brennpunkte2019-02-04T09:01:30+01:00
Go to Top