About ubs-ch

This author has not yet filled in any details.
So far ubs-ch has created 384 blog entries.

Weekly-Hits edition of 16.11.2018

KeyInvest Weekly Hits

Friday, 16.11.2018

keyinvest Norwegen
  • Topic 1: Norway - Upswing in the far north
  • Topic 2: General Motors / Ford - Car manufacturers with strong figures

Norway
Upswing in the far north

The oil sector has been the main driving force behind the current upswing being enjoyed in Norway. At the same time, the Scandinavian country is benefitting from the flourishing business of the fishing industry. According to the current forecasts of the International Monetary Fund (IMF), Norway’s gross domestic product in 2018 could on the whole grow by more than 2% for the first time since 2012. The ETT (symbol: ETLNO) on the MSCI™ Daily TR Net Norway Index allows investors to take up a diversified position on the equity market of this small economy. With the PERLES (symbol: REUFIU) on the Norway Fish Equity Basket, investors can focus on the country’s second largest export sector.

While Norway attracts millions of tourists every year with its breathtaking fjords, huge glaciers, picturesque villages and modern cities, the country in the far north is also proving attractive for investors. Over the past year, the MSCI™ Daily TR Net Norway Index has recorded positive growth of 2.2%. This sets the Oslo Stock Exchange apart from the European stock market, which is dominated by negative performances.¹ Norway’s outperformance was driven by the oil industry, which is home to Equinor, by far the largest company in the country. The energy multinational, which has operations in more than 30 countries, has just published its figures for the first nine months of 2018. Its quarterly report illustrates how the rise in oil prices during this period had a positive impact on earnings. Standing at USD 13.4 billion, operating earnings for the period from January to September were up 56% on the previous year. Equinor’s operating cash flow after nine months totaled USD 15.5 billion, which means that it has already surpassed the figure recorded in 2017 as a whole. (Source: Equinor Financial Report Q3 2018)

The Norwegian fishing industry has also been flourishing lately. The country’s second most important export sector is benefitting from changing dietary habits among the world’s population, with farm-raised salmon in particular appealing to the taste buds of an ever-increasing number of consumers. In August alone, Norway exported 100,000 tons of the typically pink fish – a new record for the summer month. In the first eight months of the year, the Scandinavians increased total seafood exports by 11% to 1.8 million tons. (Source: Norwegian Seafood Council press release, October 18, 2018) In light of this, it is not surprising that Marine Harvest’s share is trading at record levels.¹ Especially as the world’s largest salmon farmer exceeded expectations in the third quarter in terms of both volume and earnings. (Source: Thomson Reuters media report, October 15, 2018)

Opportunities: Equinor and Marine Harvest are among the heavyweights in the MSCI Daily TR Net Norway Index. In addition to the aforementioned duo, eight other shares are included in the benchmark. According to index provider MSCI, the benchmark thus covers around 85% of the free-float-adjusted market capitalization of the Scandinavian country. The ETT (symbol: ETLNO) tracks the index at a subscription ratio of 100:1. There are usually no ongoing management fees for this product structure.² The dividend payments made by the included companies are reinvested net in the index. In June 2017, UBS launched the PERLES (symbol: REUFIU) on the Norway Fish Equity Basket. The participation product denominated in Norwegian kroner is now trading at 65% above the issue price. The basket includes the industry leader Marine Harvest together with six other shares in Norwegian fisheries.

Risks: The aforementioned products do not have capital protection. Should the underlying assets deliver a negative performance, the ETT and PERLES will incur commensurate losses. Investors in structured products are also exposed to issuer risk, which means that the capital invested may be lost if UBS AG becomes insolvent, regardless of the performance of the underlying.

More UBS products and further information on the risks and opportunities are available at ubs.com/keyinvest.

MSCI™ Daily TR Net Norway USD Index 5 years¹

The MSCI™ Daily Norway Index has been trending upwards since the beginning of 2016. At the end of September, the benchmark climbed to its highest level in around four years.

Source: UBS AG, Bloomberg

As of 14.11.2018

Marine Harvest vs. SalMar vs. Leroy Seafood 5 years¹

Marine Harvest, SalMar and Leroy Seafood are the three largest members of the Norway Fish Equity Basket in terms of market value. In recent years, the trio has made impressive gains.

Source: UBS AG, Bloomberg

As of: 14.11.2018

¹) Please be aware that past performance does not indicate future results.
²) The conditions of ETTs are reviewed on a yearly basis and can be adjusted with a deadline of 13 months after the announcement.

ETT on MSCI™ Daily TR Net Norway USD Index

Symbol ETLNO
SVSP Name Tracker Certifikat
SPVSP Code 1300
Underlying MSCI™ Daily TR Net Norway USD Index 
Currency USD
Ratio 100:1
Administration fee 0.00% p.a.²
Participation 100%
Expiry Open End
Issuer UBS AG, London
Bid/Ask USD 85.00 / 85.45
 

PERLES on Norway Fish Equity Basket

Symbol REUFIU
SVSP Name Tracker Certifikat
SPVSP Code 1300
Underlying Norway Fish Equity Basket
Currency NOK
Ratio 1:1
Participation 100%
Expiry 03.06.2019
Issuer UBS AG, London
Bid/Ask NOK 1’569.00 / 1’585.00 
 

More UBS products and further information on the risks and opportunities are available at ubs.com/keyinvest.

Source: UBS AG, Bloomberg

As of: 14.11.2018

Market overview

Index Quotation Week¹
SMI™ 8’931.20 -1.3%
SLI™ 1’392.78 -2.3%
S&P 500™ 2’701.58 -4.0%
Euro STOXX 50™ 3’205.36 -1.3%
S&P™ BRIC 40 3’812.92 -3.6%
CMCI™ Compos. 907.58 -2.2%
Gold (troy ounce) 1’210.10 USD -1.5%

¹ Change based on the closing price of the previous day compared to the closing price a week ago.

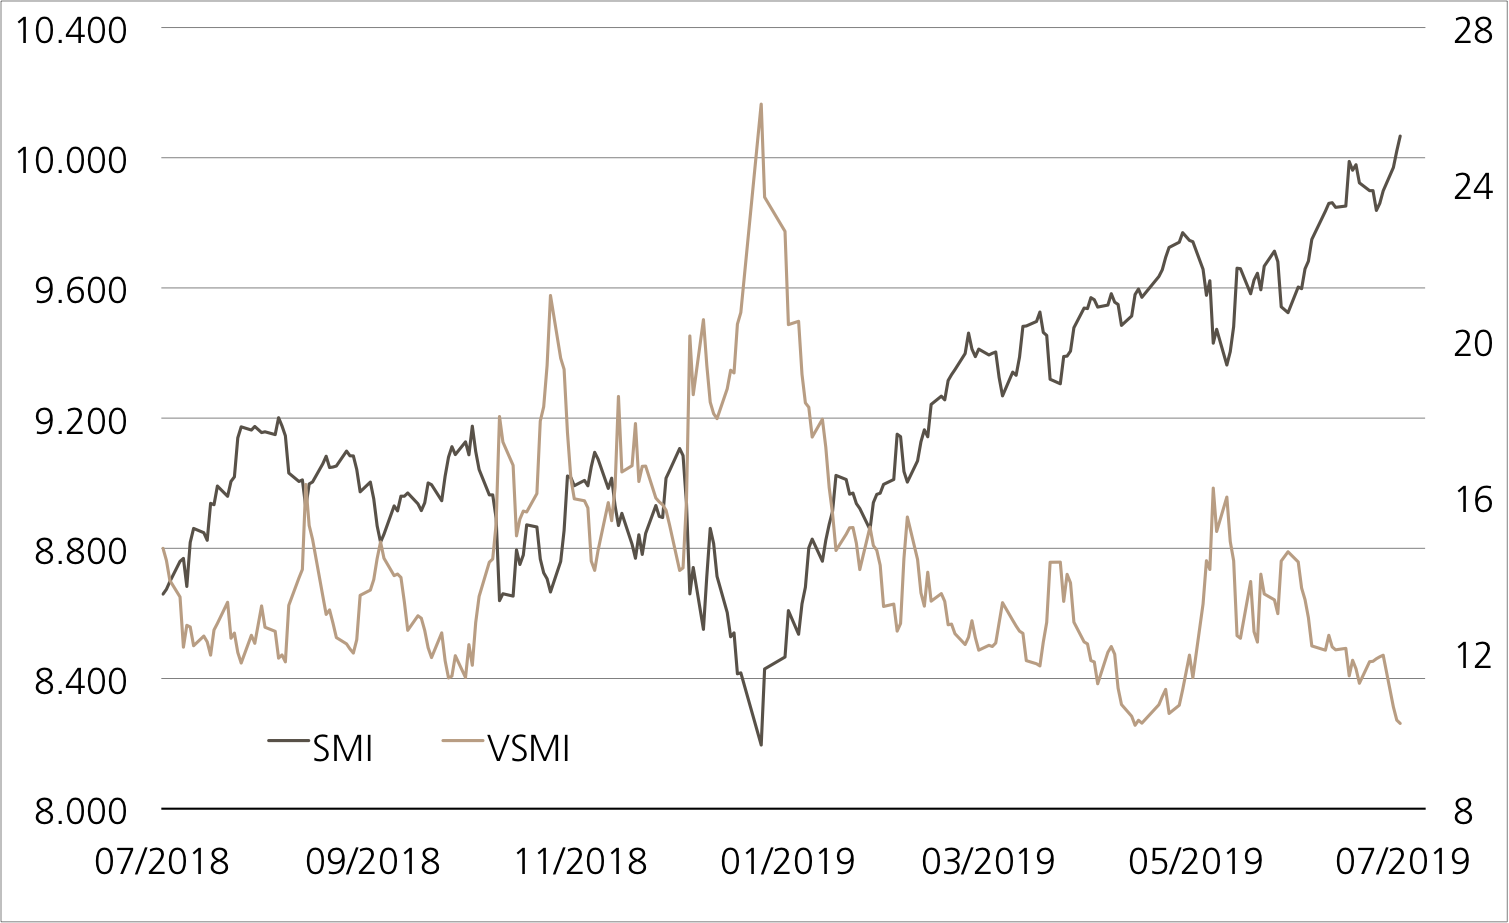
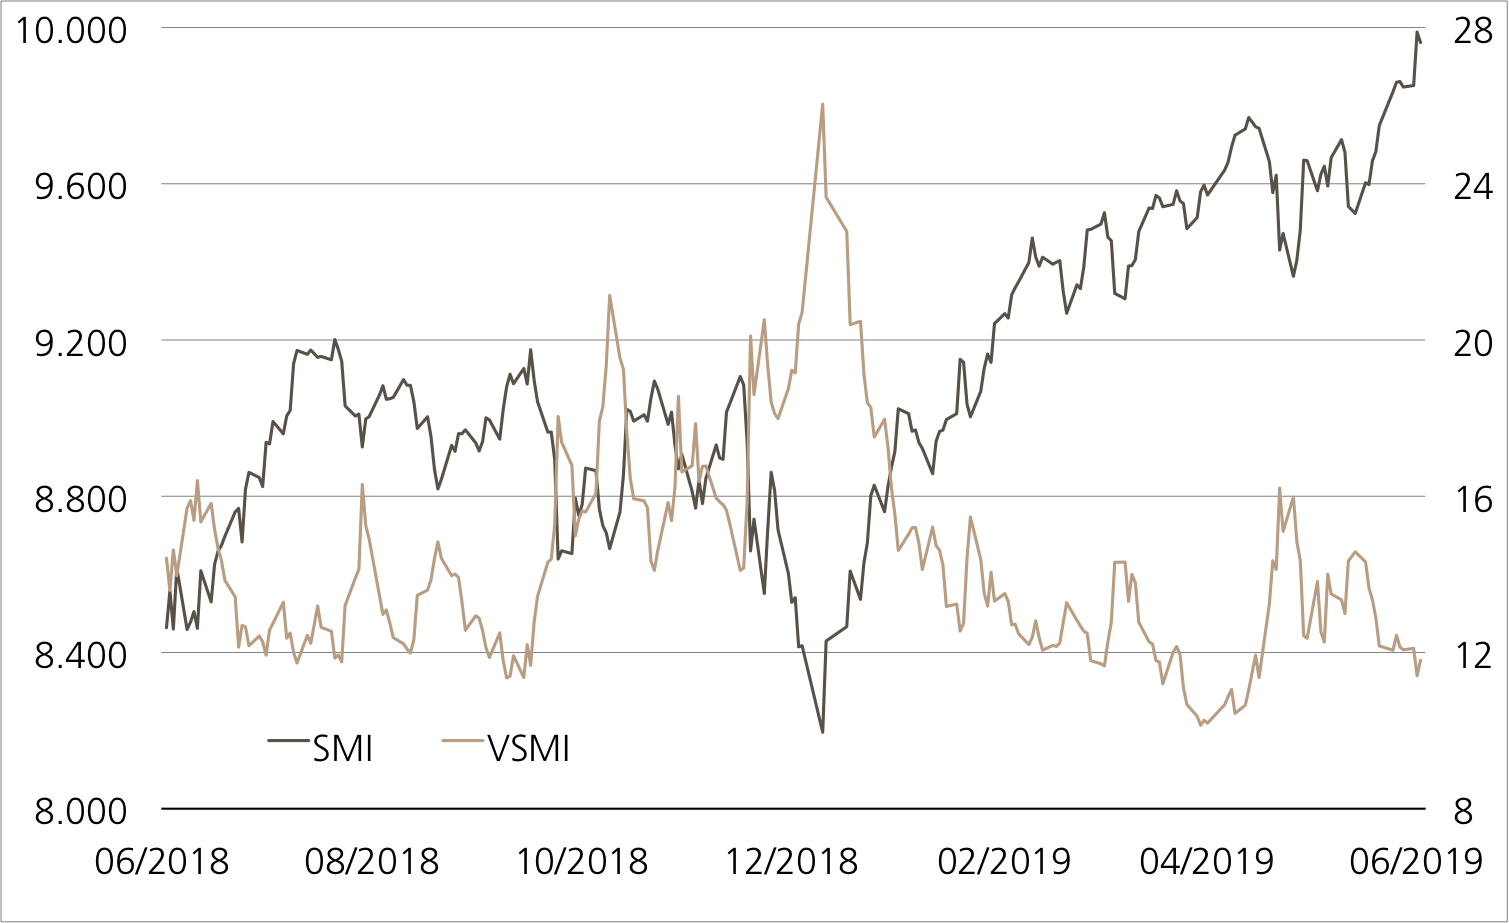
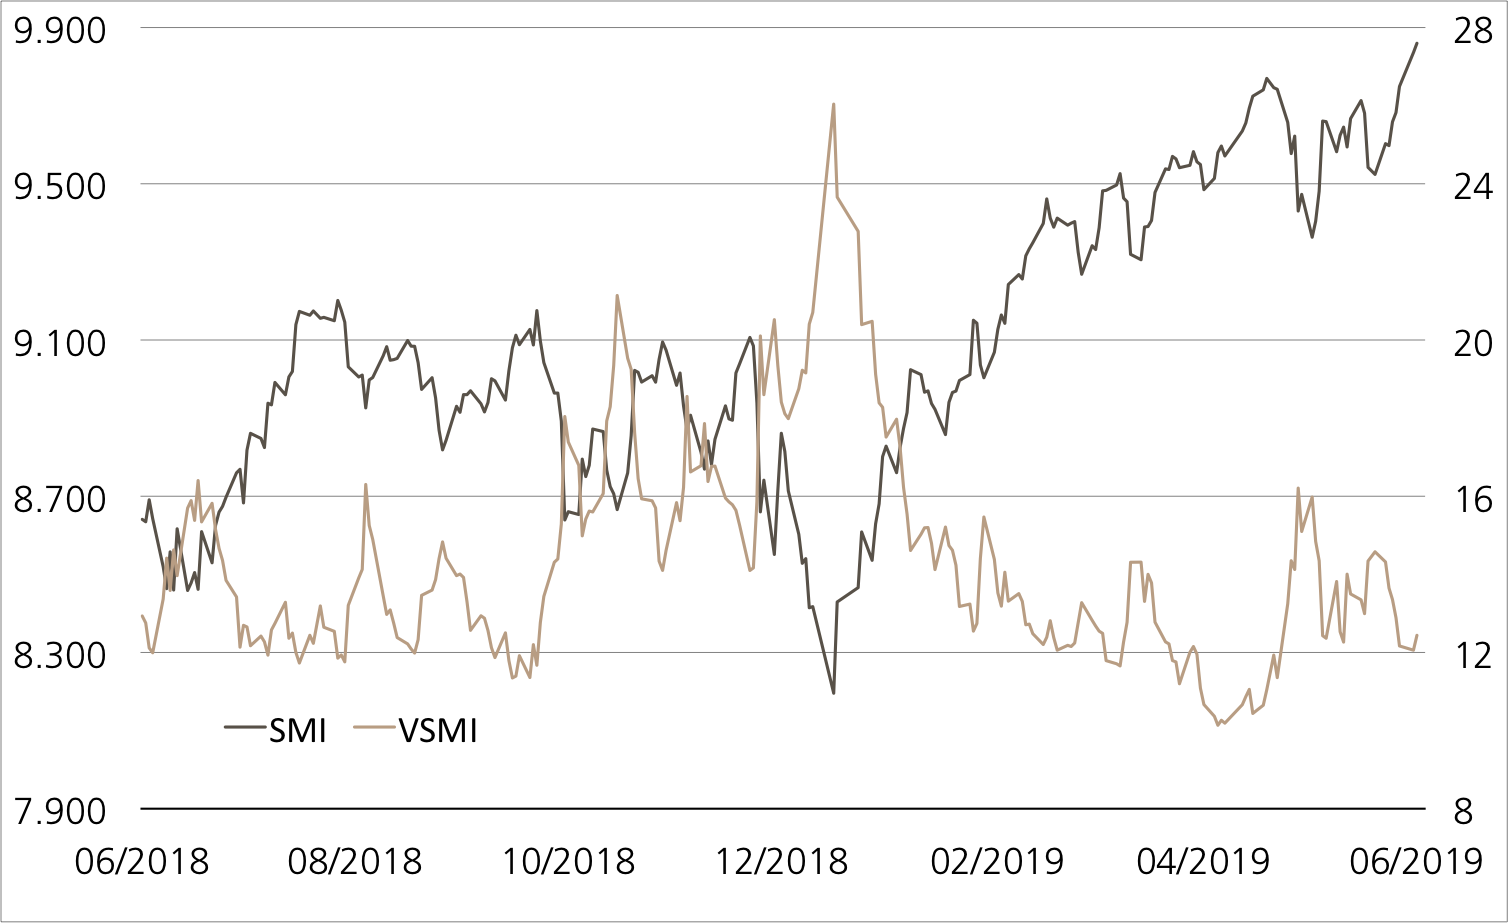
SMI™ vs. VSMI™ 1 year

smi vs vsmi

The VSMI™ Index is calculated since 2005. It shows the volatility of the stocks within the SMI™ index. A portfolio which reacts only to changes in volatility instead of volatility itself is relevant for the calculation. Thereby, the VSMI™ methodology uses the squared volatility, known as variance, of the SMI options with remaining time to expiry of 30 days traded at the Eurex.

Source: UBS AG, Bloomberg

As of: 14.11.2018

General Motors / Ford
Car manufacturers with strong figures

In the car world, off-road vehicles are currently all the rage. This can also be seen in the US registration figures for October. Let’s take Ford as an example – while sales of sedans seemed to be reversing out of the parking lot, SUVs recorded double-digit sales growth and over 70,000 F-Series vehicles were sold for the eighth month in a row. Business at General Motors (GM) is also flourishing thanks to SUVs. In the third quarter, the high-priced models caused operating profits to jump by 25%. Stock exchange speculators are clapping their hands with glee at the moment, as both shares have achieved double-digit percentage growth in the past four weeks.¹ The new Worst of Kick-In GOAL (symbol: KCVNDU) on the two automotive companies does not require the growth in share prices to pick up any further. The product offers an annual coupon of 10% and a risk buffer of 40% should the prices move sideways.

Not only did GM record greater earnings than expected in the third quarter, but the car manufacturer also narrowed its annual targets. The upper end of the USD 5.80 to 6.20 range for adjusted pre-tax earnings per share is now expected to be achieved in 2018. To ensure that the Group can continue making such high profits in the future, cuts are being made, with 18,000 of the 50,000 employees in North America having recently received a severance offer. As revealed in Ford’s latest quarterly report, the car manufacturer has also outperformed market forecasts. The company is still in the midst of a corporate restructuring, but this should pay off soon. Chief Financial Officer Bob Shanks confirmed the pre-tax margin target of 8% when presenting the quarterly figures. However, this will probably not be possible by 2020 as was announced. In addition, the company is investigating the opportunities presented by “the car of the future”. According to a media report, Ford is currently in discussions with VW to work together on the costly development of autonomous driving technology and electric cars. Although nothing has yet been decided, a Ford spokesman stated that the US group’s letter of intent with VW included discussions on potential collaborations in a number of areas. (Source: Thomson Reuters media report, October 31, 2018).

Opportunities: In order to generate a profit with the Worst of Kick-In GOAL (Symbol: KCVNDU), the share prices of Ford and GM only need to trend sideways. The product in subscription pays an annual coupon of 10% regardless of price performance. The repayment of the nominal is, however, linked to the underlyings. If none of the shares fall level with or below the barrier of 60% of the initial fixings, investors will remain safe from losses.

Risks: Worst-of Kick-In GOALs do not have capital protection. If the underlyings of the Kick-In GOAL touch or fall below the respective Kick-In Level (barrier), the amount repaid on the maturity date is reflecting the worst performance of the underlyings (but not more than notional value plus coupon). In this case, it is likely that losses will be incurred. Investors in structured products are also exposed to issuer risk, which means that the capital invested may be lost if UBS AG becomes insolvent, regardless of the performance of the underlying.

More UBS products and further information on the risks and opportunities are available at ubs.com/keyinvest.

General Motors vs. Ford Motor 5 years¹

Source: UBS AG, Bloomberg

As of: 14.11.2018

10.00% p.a. Worst of Kick-In GOAL on General Motors / Ford

Symbol KCVNDU
SVSP Name Barrier Reverse Convertible
SPVSP Code 1230
Underlyings General Motors / Ford
Currency USD
Coupon 10.00% p.a.
Kick-In Level 60.00%
Expiry 21.11.2019
Issuer UBS AG, London
Subscription until 21.11.2018, 15:00 h
 

More UBS products and further information on the risks and opportunities are available at ubs.com/keyinvest.

Source: UBS AG, Bloomberg

As of: 14.11.2018

¹) Please be aware that past performance does not indicate future results.
²) The conditions of ETTs are reviewed on a yearly basis and can be adjusted with a deadline of 13 months after the announcement.

This material has been prepared by UBS AG or one of its affiliates («UBS»). This material is for distribution only as permitted by law. It is not prepared for the needs of any specific recipient. It is published solely for information and is not a solicitation or offer to buy or sell any securities or related financial instruments (“Instruments”). UBS makes no representation or warranty, either express or implied, on the completeness or reliability of the information contained in this document (“Information”) except that concerning UBS AG and its affiliates. The Information should not be regarded by recipients as a substitute for using their own judgment. Any opinions expressed in this material may change without notice and may be contrary to opinions expressed by other business areas of UBS as a result of using different assumptions or criteria. UBS is under no obligation to update the Information. UBS, its officers, employees or clients may have or have had an interest in the Instruments and may at any time transact in them. UBS may have or have had a relationship with entities referred to in the Information. Neither UBS nor any of its affiliates, or their officers or employees, accepts any liability for any loss arising from use of the Information. This presentation is not a basis for entering into a transaction. Any transaction between you and UBS will be subject to the detailed provisions of the term sheet, confirmation or electronic matching systems relating to that transaction. Clients wishing to effect transactions should contact their local sales representative.
This information is communicated by UBS AG and/or its affiliates («UBS»). * (see below) UBS may from time to time, as principal or agent, have positions in, or may buy or sell, or make a market in any securities, currencies, financial instruments or other assets underlying the product to which this website relates (the «Structured Product»). UBS may provide investment banking and other services to and/or have officers who serve as directors of the companies referred to in this website. UBS’s trading and/or hedging activities related to the Structured Product may have an impact on the price of the underlying asset and may affect the likelihood that any relevant barrier or relevant trigger event is crossed or triggered. UBS has policies and procedures designed to minimise the risk that officers and employees are influenced by any conflicting interest or duty and that confidential information is improperly disclosed or made available. UBS may pay or receive brokerage or retrocession fees in connection with the Structured Product described herein. In respect of any Structured Product that is a security, UBS may, in certain circumstances, sell the Structured Product to dealers and other financial institutions at a discount to the issue price or rebate to them for their own account some proportion of the issue price. Further information is available on request. Structured Products are complex and may involve a high risk of loss. Prior to purchasing the Structured Product you should consult with your own legal, regulatory, tax, financial and accounting advisors to the extent you consider it necessary, and make your own investment, hedging and trading decisions (including decisions regarding the suitability of the Structured Product) based upon your own judgement and advice from those advisers you consider necessary. Save as otherwise expressly agreed in writing, UBS is not acting as your financial adviser or fiduciary in relation to the Product. UBS generally hedges its exposure to Structured Products, although it may elect not to hedge or to partially hedge any Structured Product. UBS’s hedging activity may be conducted through transactions in the underlying asset, index or instrument or in options, futures or other derivatives related to the underlying asset, index or instrument on publicly traded markets or otherwise, and may have an impact on the price of the under-lying asset. If a transaction is cash settled, UBS will generally unwind or offset any hedge it has for such Structured Product in close proximity to the relevant valuation time or period. In some cases, this activity may affect the value of the Structured Product. Unless stated otherwise in this document, (i) this document is for information purposes only and should not be construed as an offer, personal recommendation or solicitation to purchase the Structured Product and should not be treated as giving investment advice, and (ii) the terms of any investment in the Structured Product will be exclusively subject to the detailed provisions, including risk considerations, contained in the more detailed legal documentation that relates to the Structured Product (being the confirmation, information memorandum, prospectus or other issuer documentation as relevant). UBS makes no representation or warranty relating to any information herein which is derived from independent sources. This document shall not be copied or reproduced without UBS’s prior written permission. In respect of any Structured Product that is a security, no action has been or will be taken in any jurisdiction that would permit a public offering of the Product, save where explicitly stated in the issuer documentation. The Structured Product must be sold in accordance with all applicable selling restrictions in the jurisdictions in which it is sold.
© UBS 2018. All rights reserved. UBS prohibits the forwarding of this information without the approval of UBS.
Weekly-Hits edition of 16.11.20182018-11-16T09:00:48+01:00

Weekly-Hits édition de 09.11.2018

KeyInvest Weekly Hits

Vendredi, 09.11.2018

  • Thème 1: Titres industriels européens - Un secteur aux multiples facettes
  • Thème 2: Henkel / Beiersdorf / L’Oréal - Au pouls des consommateurs

Titres industriels européens
Un secteur aux multiples facettes

UBS CIO GWM estime que les facteurs d’insécurité géopolitiques sont les principaux responsables de la faiblesse actuelle de l’évolution sur les marchés d’actions de l’Union monétaire européenne (UME). Considérant l’avenir, les experts conseillent une pondération neutre au sein des pays de la zone euro. S’agissant de l’allocation sectorielle, les actions industrielles sont surpondérées. L’ETT (symbole : ETIND) sur le STOXX™ Europe 600 Industrial Goods & Services permet l’orientation correspondante. Ce produit Open End participe intégralement à l’évolution de l’indice des secteurs. En revanche, l’Early Redemption (ER) Worst of Kick-In GOAL (symbole : KCUGDU) vise une évolution relativement stable d’Alstom, Siemens et thyssenkrupp. Tant qu’aucune des trois valeurs industrielles n’atteindra ou ne passera en-dessous de la barrière de 59% des cours initiaux, les investisseurs toucheront un rendement maximal de 7.00% p.a. à l’échéance.

Bert Jansen, stratège chez UBS CIO GWM, constate que le dynamisme sectoriel a toujours, par le passé, été le principal moteur des marchés d’actions de la zone euro. Il aurait été plus important que les facteurs nationaux. Bert Jansen souligne que l’Italie fait exception à cette règle. A en croire le stratège, le marché d’actions de ce pays du sud de l’Europe est fortement orienté sur le secteur financier. En conséquence, le retour à une discipline budgétaire relativement laxiste pèse sur les cours. Dans la mesure où, désormais, beaucoup de l’ambiance négative a été intégré dans les cours, l’Italie se voit pondérer de manière neutre, tout comme les autres membres de l’euro dans l’allocation des pays. S’agissant des secteurs CIP GWM maintient pour la zone euro un mélange équilibré entre les secteurs cycliques et non cycliques. Les secteurs de l’énergie et de l’industrie sont surpondérés. (Source : UBS CIO GWM, UBS House View Weekly, Regional View Europe, 29.10.2018)

Bien naturellement, le secteur de l’industrie est particulièrement exposé au conflit commercial, facteur d’insécurité central dans l’année boursière 2018. Cela ne surprend donc pas que l’indice STOXX™ Europe 600 Industrial Goods & Services ait subi la vague de ventes en octobre. En revanche, fondamentalement, le secteur est encore sur le cours de la croissance. En dépit d’une tendance faiblissante, l’indice des directeurs d’achat établi par Markit par exemple s’est maintenu au-dessus du seuil d’expansion de 50 pour l’industrie en septembre. Outre la conjoncture mondiale solide, des mégatendances telles que la robotique et l’automatisation, l’efficience énergétique ou l’augmentation du trafic aérien devraient avantager le secteur.

Opportunités: avec l’Exchange Traded Tracker (ETT) (symbole : ETIND), les investisseurs peuvent se positionner de manière diversifiée. L’indice STOXX™ Europe 600 Industrial Goods & Services sous-jacent contient actuellement 100 entreprises. Pour la pondération, Siemens est en tête. Outre le groupe allemand, on trouve aussi Alstom sur la liste des « Most-Preferred » de CIO GWM pour les actions européennes. Avec thyssenkrupp, le duo constitue la base d’un nouveau ER Worst of Kick-In GOAL (symbole : KCUGDU). Les investisseurs peuvent compter sur un coupon ferme de 7.00% p.a. pour cette émission. L’opportunité de rendement est couplée à une marge de sécurité de 41%. Avec la fonction Early Redemption, les sous-jacents seront examinés pour la première fois le 14 novembre 2019. Si à cette date ou à l’un des autres jours d’observation trimestriels fixés le trio atteint ou dépasse la cours initial, les investisseurs se verront rembourser le nominal et le coupon correspondant par anticipation.

Risques: il n’existe aucune protection du capital pour les produits présentés. Une évolution négative de la valeur de base génère des pertes correspondantes pour l’ETT. Si, pendant la durée de l’investissement, un des sous-jacents du Worst of Kick-In GOAL atteint une seule fois sa barrière respective («Kick-In Level») ou est inférieur à celle-ci, et que la fonction de remboursement anticipé ne s’applique pas, le montant remboursé en espèces à maturité par amortissement est basé sur la performance la plus faible (base Strike) du trio (au maximum toutefois à la valeur nominale majorée du coupon). Dans un tel cas, des pertes sont probables. Par ailleurs, avec les produits structurés, l’investisseur supporte le risque d’émetteur. Cela signifie qu’en cas d’insolvabilité d’UBS SA, le capital investi peut être perdu, indépendamment de l’évolution du sous-jacent.

Vous trouverez davantage de produits UBS et des informations sur les opportunités et les risques à l’adresse ubs.com/keyinvest.

STOXX™ Europe 600 Industrial Goods & Services Index vs. STOXX™ Europe 600 Index 5 ans¹

Après le récent recul, les actions industrielles européennes ont tout d’abord échoué à reprendre une hausse depuis leur évolution latérale. Toutefois, par rapport au marché en général, le secteur garde une longueur d’avance.

Source: UBS AG, Bloomberg

Valeurs du: 08.11.2018

Alstom vs. Siemens vs. thyssenkrupp 5 ans¹

Alstom défie l’environnement boursier difficile. Grâce à sa récente surperformance, le titre industriel français a dépassé (évaluation sur cinq ans) les deux large caps allemandes Siemens et thyssenkrupp.

Source: UBS AG, Bloomberg

Valeurs du: 08.11.2018

¹) La performance passée n’indique pas les résultats futures.
²) Les condition des ETTs sont vérifiés annuellement et peuvent être ajustées avec un délai de 13 mois après la publication.

ETT sur STOXX™ Europe 600 Industrial Goods & Services NR Index

Symbol ETIND
SVSP Name Tracker Certifikat
SPVSP Code 1300
Sous-jacent STOXX™ Europe 600 Industrial Goods & Services Net Return Index
Devise EUR
Rapport de souscription 1:1
Frais de gestion 0.00% p.a.²
Participation 100%
Echéance Open End
Émetteur UBS AG, London
Bid/Ask EUR 922.50 / 927.50
 

7.00% p.a. ER Worst of Kick-In GOAL sur Alstom / Siemens / thyssenkrupp

Symbol KCUGDU)
SVSP Name Barrier Reverse Convertible
SPVSP Code 1230 (Auto-Callable)
Sous-jacent Alstom / Siemens / thyssenkrupp
Devise EUR
Coupon 7.00% p.a.
Kick-In Level 59.00%
Echéance 15.05.2020
Émetteur UBS AG, London
Date de fixation du prix 14.11.2018, 15:00 h
 

Vous trouverez davantage de produits UBS et des informations sur les opportunités et les risques à l’adresse ubs.com/keyinvest.

Source: UBS AG, Bloomberg

Valeurs du: 08.11.2018

Apérçu du marché

Index Citation Semaine¹
SMI™ 9’050.53 0.3%
SLI™ 1’425.81 0.4%
S&P 500™ 2’813.89 3.8%
Euro STOXX 50™ 3’246.66 1.5%
S&P™ BRIC 40 3’954.66 4.4%
CMCI™ Compos. 928.33 0.0%
Gold (once troy) 1’228.70 USD 1.1%

¹ Changement basé sur le cours de clôture du jour précédent par rapport au cours de clôture de la semaine dernière.

SMI™ vs. VSMI™ 1 année

L’index VSMI™ est calculé depuis 2005. Il affiche la volatilité des actions inclus dans le SMI™ index. Pour la calculation, un portefeuille est utilisé qui ne réagit qu’au variations de la volatilité au lieu des variations des prix. En le faisant, la méthodologie du VSMI™ utilise la volatilité carré, connu sous le terme variance, des options sur le SMI avec 30 jours jusqu’à l’échéance négociées à la Bourse Eurex.

Source: UBS AG, Bloomberg

Valeurs du: 08.11.2018

Henkel / Beiersdorf / L’Oréal
Au pouls des consommateurs

Quelques semaines à peine avant les ventes de Noël, les consommateurs du monde entier affichent des envies d’achat. Aux Etats-Unis, le moral des consommateurs a même atteint récemment son niveau le plus haut depuis le changement de siècle. Les indicateurs actuels devraient parfaitement convenir à Henkel, Beiersdorf et L’Oréal. UBS réunit ces trois fabricants renommés de biens de consommation comme sous-jacents pour une nouvelle émission. Le Callable Worst of Kick-In GOAL (symbole : KCUDDU) est doté d’un coupon de 6.00% p.a., alors que les barrières sont fixées à 60% des cours initiaux.

Les récents résultats de l’Oréal montrent qu’actuellement l’Asie est tout à fait en mode achat. Au deuxième trimestre 2018, le fabricant français de cosmétiques a enregistré une croissance similaire des chiffres d’affaires de 7.5%. L’entreprise a ainsi dépassé les attentes moyennes des analystes. En Asie, la demande a porté surtout sur des produits pour la peau, par exemple des crèmes anti-âge. Selon Jean-Paul Agon, CEO, le groupe connaît une rapide croissance, en particulier en Chine. Au Royaume de Milieu, le boom des produits de luxe se poursuit. L’Oréal est représenté dans cet important segment, notamment avec les produits de maquillage d’Yves Saint Laurent.

Le même jour que le Français, Beiersdorf a publié son rapport intermédiaire. Le groupe cosmétique a augmenté son chiffre d’affaires organique de 6% au cours des neuf premiers mois de l’année. Pour l’Allemand du nord également, le segment du luxe a été florissant, les chiffres de la marque La Prairie ont connu une poussée de 46,7% à la hausse. De plus, Beiersdorf a connu une nette croissance dans le secteur des adhésifs de la marque tesa. (Sources: Thomson Reuters, rapports de presse, 30.10.2018) Les produits adhésifs et d’étanchement font également partie des compétences clé de Henkel. En outre, cette entreprise du DAX™ est aussi active dans le domaine des soins corporels ainsi que des produits de lessive et de nettoyage. Les investisseurs découvriront le 15 novembre l’évolution des affaires de Henkel.

Opportunités: une évolution de cours globalement stable pour Henkel, Beiersdorf et L’Oréal suffit pour que le calcul d’investissement du Callable Worst of Kick-In GOAL (symbole : KCUDDU) fonctionne. Il est déterminant qu’aucune action du trio ne tombe au niveau de la barrière (basse) de 60% du cours initial ou ne passe en-dessous. Dans la mesure où le coupon de 6.00% p.a. sera versé quelle que soit la situation, à l’échéance, le rendement maximum sera alors atteint. Nous attirons votre attention sur le fait que l’émettrice dispose d’un droit de résiliation. Si elle en fait usage à l’une des dates prévues à cet effet, outre le nominal, le coupon au pro rata sera remboursé par anticipation.

Risques: les Worst of Kick-In GOALS ne bénéficient d’aucune protection du capital. Si, pendant la durée de l’investissement, l’un des sous-jacents atteint une seule fois la barrière respective («Kick-In Level») ou est inférieur à celle-ci, et que la fonction de Callable ne s’applique pas, le remboursement à l’échéance par remboursement en espèces est basé sur la performance la plus faible (base Strike) du trio (au maximum toutefois à la valeur nominale majorée du coupon). Dans un tel cas, des pertes sont probables. Par ailleurs, avec les produits structurés, l’investisseur supporte le risque d’émetteur. Cela signifie qu’en cas d’insolvabilité d’UBS SA, le capital investi peut être perdu, indépendamment de l’évolution des sous-jacents.

Vous trouverez davantage de produits UBS et des informations sur les opportunités et les risques à l’adresse ubs.com/keyinvest.

Henkel vs. Beiersdorf vs. Loréal 5 ans¹

Source: UBS AG, Bloomberg

Valeurs du: 08.11.2018

6.00% p.a. Callable Worst of Kick-In GOAL sur Henkel / Beiersdorf / L’Oréal

Symbol KCUDDU
SVSP Name Barrier Reverse Convertible
SPVSP Code 1230 (Callable)
Sous-jacent Henkel / Beiersdorf / L’Oréal
Devise EUR
Coupon 6.00% p.a.
Kick-In Level 60.00%
Echéance 16.11.2020
Émetteur UBS AG, London
Date de fixation du prix 14.11.2018, 15:00 h
 

Vous trouverez davantage de produits UBS et des informations sur les opportunités et les risques à l’adresse ubs.com/keyinvest.

Source: UBS AG, Bloomberg

Valeurs du: 08.11.2018

¹) La performance passée n’indique pas les résultats futures.
²) Les condition des ETTs sont vérifiés annuellement et peuvent être ajustées avec un délai de 13 mois après la publication.

This material has been prepared by UBS AG or one of its affiliates («UBS»). This material is for distribution only as permitted by law. It is not prepared for the needs of any specific recipient. It is published solely for information and is not a solicitation or offer to buy or sell any securities or related financial instruments (“Instruments”). UBS makes no representation or warranty, either express or implied, on the completeness or reliability of the information contained in this document (“Information”) except that concerning UBS AG and its affiliates. The Information should not be regarded by recipients as a substitute for using their own judgment. Any opinions expressed in this material may change without notice and may be contrary to opinions expressed by other business areas of UBS as a result of using different assumptions or criteria. UBS is under no obligation to update the Information. UBS, its officers, employees or clients may have or have had an interest in the Instruments and may at any time transact in them. UBS may have or have had a relationship with entities referred to in the Information. Neither UBS nor any of its affiliates, or their officers or employees, accepts any liability for any loss arising from use of the Information. This presentation is not a basis for entering into a transaction. Any transaction between you and UBS will be subject to the detailed provisions of the term sheet, confirmation or electronic matching systems relating to that transaction. Clients wishing to effect transactions should contact their local sales representative.
This information is communicated by UBS AG and/or its affiliates («UBS»). * (see below) UBS may from time to time, as principal or agent, have positions in, or may buy or sell, or make a market in any securities, currencies, financial instruments or other assets underlying the product to which this website relates (the «Structured Product»). UBS may provide investment banking and other services to and/or have officers who serve as directors of the companies referred to in this website. UBS’s trading and/or hedging activities related to the Structured Product may have an impact on the price of the underlying asset and may affect the likelihood that any relevant barrier or relevant trigger event is crossed or triggered. UBS has policies and procedures designed to minimise the risk that officers and employees are influenced by any conflicting interest or duty and that confidential information is improperly disclosed or made available. UBS may pay or receive brokerage or retrocession fees in connection with the Structured Product described herein. In respect of any Structured Product that is a security, UBS may, in certain circumstances, sell the Structured Product to dealers and other financial institutions at a discount to the issue price or rebate to them for their own account some proportion of the issue price. Further information is available on request. Structured Products are complex and may involve a high risk of loss. Prior to purchasing the Structured Product you should consult with your own legal, regulatory, tax, financial and accounting advisors to the extent you consider it necessary, and make your own investment, hedging and trading decisions (including decisions regarding the suitability of the Structured Product) based upon your own judgement and advice from those advisers you consider necessary. Save as otherwise expressly agreed in writing, UBS is not acting as your financial adviser or fiduciary in relation to the Product. UBS generally hedges its exposure to Structured Products, although it may elect not to hedge or to partially hedge any Structured Product. UBS’s hedging activity may be conducted through transactions in the underlying asset, index or instrument or in options, futures or other derivatives related to the underlying asset, index or instrument on publicly traded markets or otherwise, and may have an impact on the price of the under-lying asset. If a transaction is cash settled, UBS will generally unwind or offset any hedge it has for such Structured Product in close proximity to the relevant valuation time or period. In some cases, this activity may affect the value of the Structured Product. Unless stated otherwise in this document, (i) this document is for information purposes only and should not be construed as an offer, personal recommendation or solicitation to purchase the Structured Product and should not be treated as giving investment advice, and (ii) the terms of any investment in the Structured Product will be exclusively subject to the detailed provisions, including risk considerations, contained in the more detailed legal documentation that relates to the Structured Product (being the confirmation, information memorandum, prospectus or other issuer documentation as relevant). UBS makes no representation or warranty relating to any information herein which is derived from independent sources. This document shall not be copied or reproduced without UBS’s prior written permission. In respect of any Structured Product that is a security, no action has been or will be taken in any jurisdiction that would permit a public offering of the Product, save where explicitly stated in the issuer documentation. The Structured Product must be sold in accordance with all applicable selling restrictions in the jurisdictions in which it is sold.
© UBS 2018. All rights reserved. UBS prohibits the forwarding of this information without the approval of UBS.
Weekly-Hits édition de 09.11.20182018-11-09T13:49:36+01:00

Weekly-Hits edition of 09.11.2018

KeyInvest Weekly Hits

Friday, 09.11.2018

  • Topic 1: European industrials - A multifaceted sector
  • Topic 2: Henkel/Beiersdorf/L’Oréal - Staying in step with consumers

European industrials
A multifaceted sector

UBS CIO GWM identifies the geopolitical uncertainty factors mainly responsible for the current weak performance of the stock markets in the European Monetary Union (EMU). Looking to the future, experts recommend a neutral weighting within the eurozone countries. Industrial equities are overweight in terms of sector allocation. The ETT (symbol: ETIND) on the STOXX™ Europe 600 Industrial Goods & Services Index allows for a corresponding weighting, as the open end product tracks the performance of the industry benchmark. In contrast, the Early Redemption (ER) Worst of Kick-In GOAL (symbol: KCUGDU) is geared towards the Alstom, Siemens and thyssenkrupp equities delivering a relatively stable performance. Provided none of the industrials touch or fall below the barrier of 59% of their respective initial prices, investors will receive a maximum return of 7% upon maturity.

Bert Jansen, Strategist at UBS CIO GWM, notes that sector momentum has always been the main driver for eurozone equity markets in the past. He attests that it has always been more important than country-specific factors. According to Jansen, however, an exception to this rule is Italy, as the equity market in the southern European country is strongly geared to the financial sector. The country’s rather lax budgetary discipline is negatively impacting share prices accordingly. Since a large part of the negative sentiment is now likely to be priced in, Italy – like other EU members – will receive a neutral weighting in the country allocation. In terms of sectors, CIO GWM is pursuing a largely balanced mix of cyclical and non-cyclical sectors for the eurozone. An overweight is being maintained in the energy and industry sectors. (Source: UBS CIO GWM, UBS House View Weekly, Regional View Europe, October 29, 2018)

Naturally, the second sector has been particularly exposed to the trade dispute that has prevailed as one of the main factors for market uncertainty in 2018. It is therefore not surprising that the STOXX™ Europe 600 Industrial Goods & Services Index was included in the wave of sales in October. Fundamentally, however, the sector continues to grow. Despite a downward trend, the Purchasing Managers› Index for industry calculated by Markit, for example, remained above the expansionary threshold of 50 in September. In addition to the robust global economy, megatrends such as robotics and automation, energy efficiency and growing air traffic should play into the hands of the sector.

Opportunities: The Exchange Traded Tracker (ETT) (symbol: ETIND) allows investors to diversify their positions. The underlying STOXX™ Europe 600 Industrial Goods & Services Index currently comprises 100 companies. In terms of weighting, Siemens leads the way. Besides the German group, Alstom is also on CIO GWM’s current most preferred list for European industrials. Together with thyssenkrupp, the duo forms the basis for a new ER Worst of Kick-In GOAL (symbol: KCUGDU). Investors can expect a fixed coupon payment of 7% p.a. with this issue. This return opportunity comes with a 41% safety buffer. As part of the early redemption function, the underlyings will be put to the test for the first time on November 14, 2019. Should the three shares close at or above their respective initial prices on this date or one of the other quarterly observation days, investors will receive the nominal amount plus the pro rata coupon early.

Risks: The aforementioned products do not have capital protection. Should the underlying assets deliver a negative performance, the ETT will incur commensurate losses. If the underlyings of the Kick-In GOAL touch or fall below the respective Kick-In Level (barrier) and the early redemption feature does not apply, the amount repaid on the maturity date is reflecting the worst performance of the underlyings (but not more than notional value plus coupon). In this case, it is likely that losses will be incurred. Investors in structured products are also exposed to issuer risk, which means that the capital invested may be lost if UBS AG becomes insolvent, regardless of the performance of the underlying.

More UBS products and further information on the risks and opportunities are available at ubs.com/keyinvest.

STOXX™ Europe 600 Industrial Goods & Services Index vs. STOXX™ Europe 600 Index 5 years¹

After the recent setback, Europe’s industrials have been unable to break out of their current sideways trend. However, the sector is still ahead of the general market.

Source: UBS AG, Bloomberg

As of 08.11.2018

Alstom vs. Siemens vs. thyssenkrupp 5 years¹

Alstom is defying the difficult market environment. Thanks to its recent outperformance, the French industrial rocketed past the German large caps Siemens and thyssenkrupp in the five-year ranking.

Source: UBS AG, Bloomberg

As of: 08.11.2018

¹) Please be aware that past performance does not indicate future results.
²) The conditions of ETTs are reviewed on a yearly basis and can be adjusted with a deadline of 13 months after the announcement.

ETT on STOXX™ Europe 600 Industrial Goods & Services NR Index

Symbol ETIND
SVSP Name Tracker Certifikat
SPVSP Code 1300
Underlying STOXX™ Europe 600 Industrial Goods & Services Net Return Index
Currency EUR
Ratio 1:1
Administration fee 0.00% p.a.²
Participation 100%
Expiry Open End
Issuer UBS AG, London
Bid/Ask EUR 922.50 / 927.50
 

7.00% p.a. ER Worst of Kick-In GOAL on Alstom / Siemens / thyssenkrupp

Symbol KCUGDU
SVSP Name Barrier Reverse Convertible
SPVSP Code 1230 (Auto-Callable)
Underlying Alstom / Siemens / thyssenkrupp
Currency EUR
Coupon 7.00% p.a.
Kick-In Level 59.00%
Expiry 15.05.2020
Issuer UBS AG, London
Subscription until 14.11.2018, 15:00 h
 

More UBS products and further information on the risks and opportunities are available at ubs.com/keyinvest.

Source: UBS AG, Bloomberg

As of: 08.11.2018

Market overview

Index Quotation Week¹
SMI™ 9’050.53 0.3%
SLI™ 1’425.81 0.4%
S&P 500™ 2’813.89 3.8%
Euro STOXX 50™ 3’246.66 1.5%
S&P™ BRIC 40 3’954.66 4.4%
CMCI™ Compos. 928.33 0.0%
Gold (troy ounce) 1’228.70 USD 1.1%

¹ Change based on the closing price of the previous day compared to the closing price a week ago.

SMI™ vs. VSMI™ 1 year

smi vs vsmi

The VSMI™ Index is calculated since 2005. It shows the volatility of the stocks within the SMI™ index. A portfolio which reacts only to changes in volatility instead of volatility itself is relevant for the calculation. Thereby, the VSMI™ methodology uses the squared volatility, known as variance, of the SMI options with remaining time to expiry of 30 days traded at the Eurex.

Source: UBS AG, Bloomberg

As of: 08.11.2018

Henkel/Beiersdorf/L’Oréal
Staying in step with consumers

With just a few weeks to go before Christmas, consumers around the globe are in a spending mood – in the US, consumer sentiment has recently reached its highest level since the turn of the millennium. The current indicators are likely to delight Henkel, Beiersdorf and L’Oréal. UBS is using the shares of the three leading consumer goods manufacturers as the underlyings for a new issue. The Callable Worst of Kick-In GOAL (symbol: KCUDDU) has a 6% annual coupon, while the barriers are set at 60% of each of the initial share prices.

The latest figures from L’Oréal show that consumers in Asia are also really in the mood to buy. In the second quarter of 2018, the French cosmetics manufacturer recorded sales growth of 7.5% on a comparable basis, which resulted in the company exceeding the average analysts› expectations. In Asia, demand was particularly strong for skincare products such as anti-aging creams. According to CEO Jean-Paul Agon, the group is growing rapidly, especially in China where the boom in luxury products persists. In this key segment, L’Oréal is represented by Yves Saint Laurent’s make-up products, among other items.

Beiersdorf published its quarterly figures on the same day as the French company. The cosmetics group increased sales organically 6% over the first nine months of 2018. The North Germans also enjoyed flourishing growth in the luxury segment, with sales of the La Prairie brand skyrocketing by 46.7%. Beiersdorf also recorded significant growth in the adhesives segment with the Tesa brand. (Source: Thomson Reuters media reports, October 30, 2018) Adhesives and sealants are also among Henkel’s core competencies. The DAX™ company is also active in the body care segment, as well as in detergents and cleaning agents. On November 15, investors can find out how Henkel has performed recently.

Opportunities: Should the Henkel, Beiersdorf and L’Oréal share prices largely remain stable, this should prove sufficient for the investment in the Callable Worst of Kick-In GOAL (symbol: KCUDDU) to pay off. All that is required is that none of the three shares touch or fall below the low barrier of 60% of the respective initial prices. Since the annual coupon of 6% is paid out in any case, the corresponding maximum return would then be achieved upon maturity. Please note that the issuer has a call option. If it makes use of this call option on one of the dates provided for this purpose, the pro rata coupon will be repaid early in addition to the nominal value.

Risks: Worst-of Kick-In GOALs do not have capital protection. If the underlyings of the Kick-In GOAL touch or fall below the respective Kick-In Level (barrier) and the callable feature does not apply, the amount repaid on the maturity date is reflecting the worst performance of the underlyings (but not more than notional value plus coupon). In this case, it is likely that losses will be incurred. Investors in structured products are also exposed to issuer risk, which means that the capital invested may be lost if UBS AG becomes insolvent, regardless of the performance of the underlying.

More UBS products and further information on the risks and opportunities are available at ubs.com/keyinvest.

Henkel vs. Beiersdorf vs. Loréal five years¹

Source: UBS AG, Bloomberg

As of: 08.11.2018

6.00% p.a. Callable Worst of Kick-In GOAL on Henkel / Beiersdorf / L’Oréal

Symbol KCUDDU
SVSP Name Barrier Reverse Convertible
SPVSP Code 1230 (Callable)
Underlyings Henkel / Beiersdorf / L’Oréal
Currency EUR
Coupon 6.00% p.a.
Kick-In Level 60.00%
Expiry 16.11.2020
Issuer UBS AG, London
Subscription until 14.11.2018, 15:00 h
 

More UBS products and further information on the risks and opportunities are available at ubs.com/keyinvest.

Source: UBS AG, Bloomberg

As of: 08.11.2018

¹) Please be aware that past performance does not indicate future results.
²) The conditions of ETTs are reviewed on a yearly basis and can be adjusted with a deadline of 13 months after the announcement.

This material has been prepared by UBS AG or one of its affiliates («UBS»). This material is for distribution only as permitted by law. It is not prepared for the needs of any specific recipient. It is published solely for information and is not a solicitation or offer to buy or sell any securities or related financial instruments (“Instruments”). UBS makes no representation or warranty, either express or implied, on the completeness or reliability of the information contained in this document (“Information”) except that concerning UBS AG and its affiliates. The Information should not be regarded by recipients as a substitute for using their own judgment. Any opinions expressed in this material may change without notice and may be contrary to opinions expressed by other business areas of UBS as a result of using different assumptions or criteria. UBS is under no obligation to update the Information. UBS, its officers, employees or clients may have or have had an interest in the Instruments and may at any time transact in them. UBS may have or have had a relationship with entities referred to in the Information. Neither UBS nor any of its affiliates, or their officers or employees, accepts any liability for any loss arising from use of the Information. This presentation is not a basis for entering into a transaction. Any transaction between you and UBS will be subject to the detailed provisions of the term sheet, confirmation or electronic matching systems relating to that transaction. Clients wishing to effect transactions should contact their local sales representative.
This information is communicated by UBS AG and/or its affiliates («UBS»). * (see below) UBS may from time to time, as principal or agent, have positions in, or may buy or sell, or make a market in any securities, currencies, financial instruments or other assets underlying the product to which this website relates (the «Structured Product»). UBS may provide investment banking and other services to and/or have officers who serve as directors of the companies referred to in this website. UBS’s trading and/or hedging activities related to the Structured Product may have an impact on the price of the underlying asset and may affect the likelihood that any relevant barrier or relevant trigger event is crossed or triggered. UBS has policies and procedures designed to minimise the risk that officers and employees are influenced by any conflicting interest or duty and that confidential information is improperly disclosed or made available. UBS may pay or receive brokerage or retrocession fees in connection with the Structured Product described herein. In respect of any Structured Product that is a security, UBS may, in certain circumstances, sell the Structured Product to dealers and other financial institutions at a discount to the issue price or rebate to them for their own account some proportion of the issue price. Further information is available on request. Structured Products are complex and may involve a high risk of loss. Prior to purchasing the Structured Product you should consult with your own legal, regulatory, tax, financial and accounting advisors to the extent you consider it necessary, and make your own investment, hedging and trading decisions (including decisions regarding the suitability of the Structured Product) based upon your own judgement and advice from those advisers you consider necessary. Save as otherwise expressly agreed in writing, UBS is not acting as your financial adviser or fiduciary in relation to the Product. UBS generally hedges its exposure to Structured Products, although it may elect not to hedge or to partially hedge any Structured Product. UBS’s hedging activity may be conducted through transactions in the underlying asset, index or instrument or in options, futures or other derivatives related to the underlying asset, index or instrument on publicly traded markets or otherwise, and may have an impact on the price of the under-lying asset. If a transaction is cash settled, UBS will generally unwind or offset any hedge it has for such Structured Product in close proximity to the relevant valuation time or period. In some cases, this activity may affect the value of the Structured Product. Unless stated otherwise in this document, (i) this document is for information purposes only and should not be construed as an offer, personal recommendation or solicitation to purchase the Structured Product and should not be treated as giving investment advice, and (ii) the terms of any investment in the Structured Product will be exclusively subject to the detailed provisions, including risk considerations, contained in the more detailed legal documentation that relates to the Structured Product (being the confirmation, information memorandum, prospectus or other issuer documentation as relevant). UBS makes no representation or warranty relating to any information herein which is derived from independent sources. This document shall not be copied or reproduced without UBS’s prior written permission. In respect of any Structured Product that is a security, no action has been or will be taken in any jurisdiction that would permit a public offering of the Product, save where explicitly stated in the issuer documentation. The Structured Product must be sold in accordance with all applicable selling restrictions in the jurisdictions in which it is sold.
© UBS 2018. All rights reserved. UBS prohibits the forwarding of this information without the approval of UBS.
Weekly-Hits edition of 09.11.20182018-11-09T13:21:10+01:00

Weekly-Hits édition de 02.11.2018

KeyInvest Weekly Hits

Vendredi, 02.11.2018

  • Thème 1: US-Information Technology - L’heure de vérité
  • Thème 2: Métaux industriels - Un trio d’acier

US-Information Technology
L’heure de vérité

Traduction du 1 Novembre 2018: La saison sous revue bat son plein à Wall Street. Hier, le rapport intermédiaire d’Apple (après la clôture boursière US) constitue le paroxysme du flux de chiffres courant. Même si les résultats déjà disponibles pour le secteur technologique US ont pour la plupart dépassé les attentes, les cours ont récemment subi des pressions. Par rapport aux sommets absolus atteints en début de mois, l’indice S&P 500™ Information Technology a cédé 10.9%.¹ Les investisseurs qui voient dans ce recul une opportunité d’entrer peuvent choisir un ETT (symbole : ETINFU). Ce produit de participation reproduit l’indice S&P 500™ Information Technology sans limitation de durée et sans commissions de gestion². L’Early Redemption (ER) Worst of Kick-In GOAL sur Alphabet, Microsoft et Apple offre une alternative à l’investissement 1:1 dans le secteur US IT. Le produit en souscription est doté d’un coupon de 9,50% p.a. Les barrières sont basses, 60% du cours initial du trio sectoriel.

Peu de temps après que la cloche a sonné ce soir la fin de l’activité à Wall Street, un communiqué d’Apple passera dans les téléscripteurs. Le plus grand groupe boursier du monde publiera ses résultats du quatrième trimestre de l’exercice 2017/18 (au 30 septembre). De plus, la direction réunie autour du CEO Tim Cook tiendra dès 22h00 (Europe centrale) une téléconférence où elle prendra position de manière détaillée sur la récente marche des affaires et fera connaître ses prévisions pour l’important trimestre de Noël. Ne serait-ce qu’à cause de la taille du fabricant d’iPhones, le rapport intermédiaire est d’une importance extrême pour Wall Street.

Selon Factset, les bénéfices présentés jusqu’à présent par les entreprises informatiques étaient en moyenne supérieurs de 10% aux prévisions moyennes des analystes. La technologie de l’information se classe donc, parmi tous les secteurs US, deuxième en ce qui concerne l’écart vers le haut. Lors de la semaine d’échanges qui s’est achevée le 26 octobre, le groupe a relevé la croissance des bénéfices prévue pour le troisième trimestre de 17.0 à 21.9%. Microsoft et Intel ont fortement influencé cette révision à la hausse. Le résultat par action annoncé par les deux groupes pour le trimestre écoulé était de 18.8 respectivement 21.7% supérieur aux attentes. (Source : Factest, « Earnings Insight », 26.10.2018)

Opportunités: l’Exchange Traded Tracker (ETT) (symbole : ETINFU) reproduit l’indice S&P 500™ Information Technology composé de 65 actions au total de manière passive. Avec ce produit liquide, les investisseurs peuvent miser sur un rebond de l’indice sectoriel. Une stratégie « Buy-and-Hold » à plus long terme est également possible. Avec Apple et Microsoft, Alphabet fonctionne comme sous-jacent pour un nouveau ER Worst of Kick-In GOAL (symbole : KCTKDU). Dans le cadre d’une réforme de l’indice, la mère de Google a récemment été retirée du secteur IT et attribuée au domaine « Communication Services ». Ceci ne modifie pas les opportunités du produit en souscription : tant qu’aucun sous-jacent n’atteint ou ne passe en-dessous de la barrière de 60%, l’investissement produira un rendement de 9.50% p.a. Avec la fonction «Early Redemption», un remboursement anticipé avec coupon au pro rata est possible. Condition : Alphabet, Apple et Microsoft atteignent ou dépassent ensemble le cours initial à l’un des jours d’observation trimestriel (première date : 7.11.2019)

Risques: il n’existe aucune protection du capital pour les produits présentés. Une évolution négative de la valeur de base génère des pertes correspondantes pour l’ETT. Si, pendant la durée de l’investissement, l’un des sous-jacents du Worst of Kick-In GOAL atteint une seule fois la barrière respective («Kick-In Level») ou est inférieur à celle-ci, et si de plus la fonction Early Redemtion ne s’applique pas, le remboursement par amortissement en espèces à l’échéance est basé sur la performance la plus faible (base Strike) du trio (au maximum toutefois à la valeur nominale majorée du coupon). Dans un tel cas, des pertes sont probables. Par ailleurs, avec les produits structurés, l’investisseur supporte le risque d’émetteur. Cela signifie qu’en cas d’insolvabilité d’UBS SA, le capital investi peut être perdu, indépendamment de l’évolution du sous-jacent.

Vous trouverez davantage de produits UBS et des informations sur les opportunités et les risques à l’adresse ubs.com/keyinvest.

S&P 500™ Information Technology Index vs. S&P 500™ Index 5 ans¹

Le secteur informatique a laissé derrière lui le marché d’actions américain général au cours des cinq dernières années. Le récent recul n’a pas changé grand chose à l’énorme surperformance.

Source: UBS AG, Bloomberg

Valeurs du: 01.11.2018

Alphabet A vs. Microsoft vs. Apple 5 ans¹

Microsoft suit son cours : dans le classement sur cinq ans, l’action logicielle s’en sort même mieux que celle d’Apple. La société Alphabet, mère de Google, n’arrive plus à suivre ce duo.

Source: UBS AG, Bloomberg

Valeurs du: 01.11.2018

¹) La performance passée n’indique pas les résultats futures.
²) Les condition des ETTs sont vérifiés annuellement et peuvent être ajustées avec un délai de 13 mois après la publication.

ETT sur S&P 500™ Information Technology Index

Symbol ETINFU
SVSP Name Tracker Certifikat
SPVSP Code 1300
Sous-jacent S&P 500™ Information Technology Index
Devise USD
Rapport de souscription 1:1
Frais de gestion 0.00% p.a.²
Participation 100%
Echéance Open End
Émetteur UBS AG, London
Bid/Ask USD 1’213.00 / 1’215.00
 

9.50% p.a. ER Worst of Kick-In GOAL sur Alphabet / Microsoft / Apple

Symbol KCTKDU
SVSP Name Barrier Reverse Convertible
SPVSP Code 1230 (Auto-Callable)
Sous-jacent Alphabet A / Microsoft / Apple 
Devise USD
Coupon 9.50% p.a.
Kick-In Level 60.00%
Echéance 23.10.2020
Émetteur UBS AG, London
Date de fixation du prix 07.11.2018, 15:00 h
 

Vous trouverez davantage de produits UBS et des informations sur les opportunités et les risques à l’adresse ubs.com/keyinvest.

Source: UBS AG, Bloomberg

Valeurs du: 01.11.2018

Apérçu du marché

Index Citation Semaine¹
SMI™ 9’022.16 3.4%
SLI™ 1’420.48 4.6%
S&P 500™ 2’711.74 2.1%
Euro STOXX 50™ 3’197.51 2.1%
S&P™ BRIC 40 3’787.34 1.1%
CMCI™ Compos. 928.22 -2.2%
Gold (once troy) 1’215.00 USD -1.3%

¹ Changement basé sur le cours de clôture du jour précédent par rapport au cours de clôture de la semaine dernière.

SMI™ vs. VSMI™ 1 année

L’index VSMI™ est calculé depuis 2005. Il affiche la volatilité des actions inclus dans le SMI™ index. Pour la calculation, un portefeuille est utilisé qui ne réagit qu’au variations de la volatilité au lieu des variations des prix. En le faisant, la méthodologie du VSMI™ utilise la volatilité carré, connu sous le terme variance, des options sur le SMI avec 30 jours jusqu’à l’échéance négociées à la Bourse Eurex.

Source: UBS AG, Bloomberg

Valeurs du: 01.11.2018

Métaux industriels
Un trio d’acier

Si, en tant que tout, le marchés des matières premières a connu un développement stable en 2018 jusqu’à ce jour, les signes précurseurs d’alerte dominent pour les métaux industriels. En particulier les inquiétudes au sujet d’un ralentissement conjoncturel, qui vont de pair avec le renforcement du conflit commercial pèsent sur le segment. Même si la demande de métal en soi reste robuste, les actions du secteur sont sous pression. Avec US Steel, ArcelorMittal et Rio Tinto, UBS réunit désormais trois représentants du secteur pour un Callable Worst of Kick-In GOAL (symbole : KCTUDU). Nonobstant l’évolution à venir des cours, le produit verse un coupon de 11.00% p.a. Cette opportunité est couplée à une marge de sécurité de 46%.

Le 16 octobre, la Worldsteel Association a publié ses perspectives de marché à court terme. L’association de banque y prévoit que la demande mondiale d’acier pour l’année en cours augmentera de 3.9% à 1 657,9 millions de tonnes. En 2019, le marché devrait progresser de 1.4 tonnes supplémentaires à 1 681.2 millions de tonnes. De manière peu surprenante, les perspectives prévoient la plus forte hausse de la demande pour 2018 dans les marchés émergents. La hausse attendue s’établit à 5.0% dans la région d’Asie-Océanie, plus forte demandeuse en raison des acquisitions de la Chine. Toutefois, la Worldsteel Association souligne aussi l’augmentation des risques. Outre les tensions commerciales renforcées, les experts évoquent aussi la volatilité des cours de change. (Source : Worldsteel Association, communiqué de presse, 16 octobre 2018)

Et ce sont ces facteurs qui freinent le secteur sur les places boursières. Exemple ArcelorMittal : le plus grand producteur mondial d’acier a perdu sur un mois 20% de sa capitalisation. Dans ce contexte, les analystes de Thomson Reuters prévoient une hausse de 22% des bénéfices du groupe pour l’année courante. On devrait savoir le 1er novembre (après clôture de la rédaction) si et dans quelle mesure cette prévision est réaliste. C’est à cette date qu’ArcelorMittal présentera ses résultats pour le troisième trimestre. Le vendredi 2 novembre, US Steel, un autre représentant important du secteur, publiera son rapport intermédiaire.

Opportunités: outre les deux producteurs d’acier, Rio Tinto a été sélectionné comme sous-jacent pour un nouveau Callable Worst of Kick-In GOAL (symbole : KCTUDU). Le groupe d’exploitation minière fournit notamment du minerai de fer, une matière première essentielle à la fabrication de l’acier. Tant qu’aucune des trois actions n’atteindra ou ne passeras en-dessous de la barrière (basse) de 54% des cours initiaux, le produit structuré produira à l’échéance le rendement maximal correspondant au coupon de 11% p.a. Important : l’émetteur dispose d’un droit de résiliation. S’il utilise la fonction Callable à l’une des deux dates possibles, les propriétaires du produit se verront rembourser le nominal avec le coupon au pro rata par anticipation.

Risques: les Worst of Kick-In GOALS ne bénéficient d’aucune protection du capital. Si, pendant la durée de l’investissement, l’un des sous-jacents atteint une seule fois la barrière respective (« Kick-In Level ») ou est inférieur à celle-ci, et que la fonction de Callable ne s’applique pas, le remboursement à l’échéance par remboursement en espèces est basé sur la performance la plus faible (base Strike) du quatuor (au maximum toutefois à la valeur nominale majorée du coupon). Dans un tel cas, des pertes sont probables. De plus, avec les produits structurés, l’investisseur supporte le risque d’émetteur. Cela signifie qu’en cas d’insolvabilité d’UBS SA, le capital investi peut être perdu, indépendamment de l’évolution des sous-jacents.

Vous trouverez davantage de produits UBS et des informations sur les opportunités et les risques à l’adresse ubs.com/keyinvest.

US Steel vs. ArcelorMittal vs. Rio Tinto 5 ans¹

Source: UBS AG, Bloomberg

Valeurs du: 01.11.2018

11.00% p.a. Callable Worst of Kick-In GOAL sur US Steel / ArcelorMittal / Rio Tinto

Symbol KCTUDU
SVSP Name Barrier Reverse Convertible
SPVSP Code 1230 (Callable)
Sous-jacent US Steel / ArcelorMittal / Rio Tinto
Devise EUR (Quanto)
Coupon 11.00% p.a.
Kick-In Level 54.00%
Echéance 31.10.2019
Émetteur UBS AG, London
Date de fixation du prix 07.11.2018, 15:00 h
 

Vous trouverez davantage de produits UBS et des informations sur les opportunités et les risques à l’adresse ubs.com/keyinvest.

Source: UBS AG, Bloomberg

Valeurs du: 01.11.2018

¹) La performance passée n’indique pas les résultats futures.
²) Les condition des ETTs sont vérifiés annuellement et peuvent être ajustées avec un délai de 13 mois après la publication.

This material has been prepared by UBS AG or one of its affiliates («UBS»). This material is for distribution only as permitted by law. It is not prepared for the needs of any specific recipient. It is published solely for information and is not a solicitation or offer to buy or sell any securities or related financial instruments (“Instruments”). UBS makes no representation or warranty, either express or implied, on the completeness or reliability of the information contained in this document (“Information”) except that concerning UBS AG and its affiliates. The Information should not be regarded by recipients as a substitute for using their own judgment. Any opinions expressed in this material may change without notice and may be contrary to opinions expressed by other business areas of UBS as a result of using different assumptions or criteria. UBS is under no obligation to update the Information. UBS, its officers, employees or clients may have or have had an interest in the Instruments and may at any time transact in them. UBS may have or have had a relationship with entities referred to in the Information. Neither UBS nor any of its affiliates, or their officers or employees, accepts any liability for any loss arising from use of the Information. This presentation is not a basis for entering into a transaction. Any transaction between you and UBS will be subject to the detailed provisions of the term sheet, confirmation or electronic matching systems relating to that transaction. Clients wishing to effect transactions should contact their local sales representative.
This information is communicated by UBS AG and/or its affiliates («UBS»). * (see below) UBS may from time to time, as principal or agent, have positions in, or may buy or sell, or make a market in any securities, currencies, financial instruments or other assets underlying the product to which this website relates (the «Structured Product»). UBS may provide investment banking and other services to and/or have officers who serve as directors of the companies referred to in this website. UBS’s trading and/or hedging activities related to the Structured Product may have an impact on the price of the underlying asset and may affect the likelihood that any relevant barrier or relevant trigger event is crossed or triggered. UBS has policies and procedures designed to minimise the risk that officers and employees are influenced by any conflicting interest or duty and that confidential information is improperly disclosed or made available. UBS may pay or receive brokerage or retrocession fees in connection with the Structured Product described herein. In respect of any Structured Product that is a security, UBS may, in certain circumstances, sell the Structured Product to dealers and other financial institutions at a discount to the issue price or rebate to them for their own account some proportion of the issue price. Further information is available on request. Structured Products are complex and may involve a high risk of loss. Prior to purchasing the Structured Product you should consult with your own legal, regulatory, tax, financial and accounting advisors to the extent you consider it necessary, and make your own investment, hedging and trading decisions (including decisions regarding the suitability of the Structured Product) based upon your own judgement and advice from those advisers you consider necessary. Save as otherwise expressly agreed in writing, UBS is not acting as your financial adviser or fiduciary in relation to the Product. UBS generally hedges its exposure to Structured Products, although it may elect not to hedge or to partially hedge any Structured Product. UBS’s hedging activity may be conducted through transactions in the underlying asset, index or instrument or in options, futures or other derivatives related to the underlying asset, index or instrument on publicly traded markets or otherwise, and may have an impact on the price of the under-lying asset. If a transaction is cash settled, UBS will generally unwind or offset any hedge it has for such Structured Product in close proximity to the relevant valuation time or period. In some cases, this activity may affect the value of the Structured Product. Unless stated otherwise in this document, (i) this document is for information purposes only and should not be construed as an offer, personal recommendation or solicitation to purchase the Structured Product and should not be treated as giving investment advice, and (ii) the terms of any investment in the Structured Product will be exclusively subject to the detailed provisions, including risk considerations, contained in the more detailed legal documentation that relates to the Structured Product (being the confirmation, information memorandum, prospectus or other issuer documentation as relevant). UBS makes no representation or warranty relating to any information herein which is derived from independent sources. This document shall not be copied or reproduced without UBS’s prior written permission. In respect of any Structured Product that is a security, no action has been or will be taken in any jurisdiction that would permit a public offering of the Product, save where explicitly stated in the issuer documentation. The Structured Product must be sold in accordance with all applicable selling restrictions in the jurisdictions in which it is sold.
© UBS 2018. All rights reserved. UBS prohibits the forwarding of this information without the approval of UBS.
Weekly-Hits édition de 02.11.20182018-11-02T10:38:50+01:00

Weekly-Hits edition of 02.11.2018

KeyInvest Weekly Hits

Friday, 02.11.2018

  • Topic 1: US Information Technology - The Moment of Truth
  • Topic 2: Industrial metals - A steely trio

US Information Technology
The Moment of Truth

The reporting season on Wall Street is in full swing. Quarterly results from Apple out this Thursday (after the US market closes) mark the high point of the current slew of numbers. Even though the figures we have already seen from the US tech sector have mostly been ahead of expectations, prices have been under pressure recently. The S&P 500™ Information Technology Index has fallen by 10.9% from all its all-time high at the start of the month.1 Investors who see this setback as a chance to get on board can use an ETT (symbol: ETINFU). The participation product replicates the S&P 500™ Information Technology Index with no time limitation and no management fees.2 An alternative to a 1:1 investment in the US IT sector is the Early Redemption (ER) Worst of Kick-In GOAL on Alphabet, Microsoft and Apple. The subscription product has a 9.5% annual coupon. The barriers are set at a low 60% of the initial prices of the sector trio.

Soon after the closing bell on Wall Street, on Thursday evening (after editorial deadline) a release from Apple will come over the ticker. The world’s largest listed company is announcing its results for the fourth quarter of its fiscal year 2017/2018 (to 30 September). CEO Tim Cook and his management team will also be holding a conference call at 10:00pm CET to talk in detail about recent business performance and the outlook for the key Christmas quarter. The sheer size alone of the iPhone manufacturer means the quarterly numbers are hugely important for Wall Street.

According to FactSet, profit announcements from IT companies in the earnings season so far have in general been one-tenth ahead of average analyst expectations. Of all sectors in the US, information technology has shown the second-largest beats. In the trading week to 26 October, consensus forecast earnings growth for the third quarter rose from 17.0% to 21.9%. Microsoft and Intel had a major influence on the upgrade. The two groups reported earnings per share for the past quarter 18.8% and 21.7% ahead of expectations respectively. (Source: FactSet, Earnings Insight, 26 October 2018.)

Opportunities: The exchange traded tracker (ETT) (symbol: ETINFU) passively replicates the 65 stocks in the S&P 500™ Information Technology Index. Investors can use the liquid product to anticipate a rebound in the sector benchmark. A longer-term buy and hold strategy is also possible. Alphabet, along with Apple and Microsoft, is one of the underlyings for a new ER Worst of Kick-In GOAL (symbol: KCTKDU). An index reshuffle recently removed the Google parent company from the IT sector and put it in communication services. This has no impact on the opportunities for the subscription product: as long as none of the underlyings touch or fall below the 60% barrier, the investment ends with an annual return of 9.50%. The early redemption feature means early repayment with pro rata coupon is possible. This is conditional on all of Alphabet, Apple and Microsoft closing at or above the starting level on one of the quarterly observation days (first date: 7 November 2019).

Risks: The aforementioned products do not have capital protection. Should the underlying assets deliver a negative performance; the ETT will incur commensurate losses. If the underlyings on the Kick-In GOAL touch or fall below the respective Kick-In Level (barrier) and the early redemption feature does not apply, the amount repaid on the maturity date is reflecting the worst performance of the underlyings (but not more than notional value plus coupon). In this case, it is likely that losses will be incurred. Investors in structured products are also exposed to issuer risk, which means that the capital invested may be lost if UBS AG becomes insolvent, regardless of the performance of the underlying.

More UBS products and further information on the risks and opportunities are available at ubs.com/keyinvest.

S&P 500™ Information Technology Index vs. S&P 500™ Index five years¹

Over the last five year, the IT sector has outperformed the broad US equity market by a considerable distance. The most recent correction has done little to reduce this massive differential.

Source: UBS AG, Bloomberg

As of 01.11.2018

Alphabet A vs. Microsoft vs. Apple five years¹

Microsoft enjoys a run: over five years the software stock has even done slightly better than Apple. Google
parent company Alphabet can no longer keep up with those two.

Source: UBS AG, Bloomberg

As of: 01.11.2018

¹) Please be aware that past performance does not indicate future results.
²) The conditions of ETTs are reviewed on a yearly basis and can be adjusted with a deadline of 13 months after the announcement.

ETT on S&P 500™ Information Technology Index

Symbol ETINFU
SVSP Name Tracker Certifikat
SPVSP Code 1300
Underlying S&P 500™ Information Technology Index
Currency USD
Ratio 1:1
Administration fee 0.00% p.a.²
Participation 100%
Expiry Open End
Issuer UBS AG, London
Bid/Ask USD 1’213.00 / 1’215.00
 

9.50% p.a. ER Worst of Kick-In GOAL auf Alphabet / Microsoft / Apple

Symbol KCTKDU
SVSP Name Barrier Reverse Convertible
SPVSP Code 1230 (Auto-Callable)
Underlying Alphabet A / Microsoft / Apple 
Currency USD
Coupon 9.50% p.a.
Kick-In Level 60.00%
Expiry 23.10.2020
Issuer UBS AG, London
Subscription until 07.11.2018, 15:00 h
 

More UBS products and further information on the risks and opportunities are available at ubs.com/keyinvest.

Source: UBS AG, Bloomberg

As of: 01.11.2018

Market overview

Index Quotation Week¹
SMI™ 9’022.16 3.4%
SLI™ 1’420.48 4.6%
S&P 500™ 2’711.74 2.1%
Euro STOXX 50™ 3197.51 2.1%
S&P™ BRIC 40 3’787.34 1.1%
CMCI™ Compos. 928.22 -2.2%
Gold (troy ounce) 1’215.00 USD -1.3%

¹ Change based on the closing price of the previous day compared to the closing price a week ago.

SMI™ vs. VSMI™ 1 year

smi vs vsmi

The VSMI™ Index is calculated since 2005. It shows the volatility of the stocks within the SMI™ index. A portfolio which reacts only to changes in volatility instead of volatility itself is relevant for the calculation. Thereby, the VSMI™ methodology uses the squared volatility, known as variance, of the SMI options with remaining time to expiry of 30 days traded at the Eurex.

Source: UBS AG, Bloomberg

As of: 01.11.2018

Industrial metals
A steely trio

The commodity market overall has been stable year to date, but industrial metals stocks are mostly down. The segment has been hit by concerns about an economic slowdown as a result of the burgeoning trade dispute. Although actual demand for metal continues to be robust, stocks in the sector are under pressure. UBS has combined three sector representatives (US Steel, ArcelorMittal and Rio Tinto) in a Callable Worst of Kick-In GOAL (symbol: KCTUDU). The product pays an annual coupon of 11.00% regardless of price performance. This opportunity comes with a 46% safety buffer.

On 16 October, the World Steel Association published its short-term market outlook. They assume that global demand for steel will rise by 3.9% to 1,657.9 million tonnes this year. In 2019, the market will grow a further 1.4% to 1,681.2 million tonnes. Not surprisingly, the 2018 forecast sees the largest increase in demand in emerging markets. Growth in Asia-Oceania, the largest market for sales due to Chinese demand, is expected to be 5.0%. However, the association also points out that risks have risen too, mentioning rising trade tensions and volatile exchange rates. (Source: World Steel Association, press release, 16 October 2018)

These are precisely the factors holding the sector back on the stock market. Take ArcelorMittal: the world’s largest steel producer lost 20% of its capitalization in a month. According to Thomson Reuters, analysts expect the group to boost profit by 22% this year. Whether and to what extent this is realistic will become clearer on 1 November (after our publication deadline). That is when the company releases its third quarter figures. On Friday 2 November US Steel, another major sector player, announces its quarterly earnings.

Opportunities: The two steel producers and Rio Tinto have been selected as the underlyings for a new Callable Worst of Kick-In GOAL (symbol: KCTUDU). One of the miner’s products is iron ore, a key input for making steel. Provided none of the three stocks touch or fall below the barrier at a low 54% of the initial prices, the structured product pays a maximal return in line with the 11.00% annual coupon on maturity. Important: The issuer has a call option. If it exercises the callable function on one of two possible dates, holders receive nominal plus the pro rata coupon.

Risks: Kick-In GOALs do not have capital protection. If the underlyings touch or fall below the respective Kick-In Level (barrier) and the callable feature does not apply, the amount repaid on the maturity date is reflecting the worst performance of the underlyings (but not more than notional value plus coupon). In this case, it is likely that losses will be incurred. Investors in structured products are also exposed to issuer risk, which means that the capital invested may be lost if UBS AG becomes insolvent, regardless of the performance of the underlying.

More UBS products and further information on the risks and opportunities are available at ubs.com/keyinvest.

US Steel vs. ArcelorMittal vs. Rio Tinto 5 years¹

Source: UBS AG, Bloomberg

As of: 01.11.2018

11.00% p.a. Callable Worst of Kick-In GOAL on US Steel / ArcelorMittal / Rio Tinto

Symbol KCTUDU
SVSP Name Barrier Reverse Convertible
SPVSP Code 1230 (Callable)
Underlyings US Steel / ArcelorMittal / Rio Tinto
Currency EUR (Quanto)
Coupon 11.00% p.a.
Kick-In Level 54.00%
Expiry 31.10.2019
Issuer UBS AG, London
Subscription until 07.11.2018, 15:00 h
 

More UBS products and further information on the risks and opportunities are available at ubs.com/keyinvest.

Source: UBS AG, Bloomberg

As of: 01.11.2018

¹) Please be aware that past performance does not indicate future results.
²) The conditions of ETTs are reviewed on a yearly basis and can be adjusted with a deadline of 13 months after the announcement.

This material has been prepared by UBS AG or one of its affiliates («UBS»). This material is for distribution only as permitted by law. It is not prepared for the needs of any specific recipient. It is published solely for information and is not a solicitation or offer to buy or sell any securities or related financial instruments (“Instruments”). UBS makes no representation or warranty, either express or implied, on the completeness or reliability of the information contained in this document (“Information”) except that concerning UBS AG and its affiliates. The Information should not be regarded by recipients as a substitute for using their own judgment. Any opinions expressed in this material may change without notice and may be contrary to opinions expressed by other business areas of UBS as a result of using different assumptions or criteria. UBS is under no obligation to update the Information. UBS, its officers, employees or clients may have or have had an interest in the Instruments and may at any time transact in them. UBS may have or have had a relationship with entities referred to in the Information. Neither UBS nor any of its affiliates, or their officers or employees, accepts any liability for any loss arising from use of the Information. This presentation is not a basis for entering into a transaction. Any transaction between you and UBS will be subject to the detailed provisions of the term sheet, confirmation or electronic matching systems relating to that transaction. Clients wishing to effect transactions should contact their local sales representative.
This information is communicated by UBS AG and/or its affiliates («UBS»). * (see below) UBS may from time to time, as principal or agent, have positions in, or may buy or sell, or make a market in any securities, currencies, financial instruments or other assets underlying the product to which this website relates (the «Structured Product»). UBS may provide investment banking and other services to and/or have officers who serve as directors of the companies referred to in this website. UBS’s trading and/or hedging activities related to the Structured Product may have an impact on the price of the underlying asset and may affect the likelihood that any relevant barrier or relevant trigger event is crossed or triggered. UBS has policies and procedures designed to minimise the risk that officers and employees are influenced by any conflicting interest or duty and that confidential information is improperly disclosed or made available. UBS may pay or receive brokerage or retrocession fees in connection with the Structured Product described herein. In respect of any Structured Product that is a security, UBS may, in certain circumstances, sell the Structured Product to dealers and other financial institutions at a discount to the issue price or rebate to them for their own account some proportion of the issue price. Further information is available on request. Structured Products are complex and may involve a high risk of loss. Prior to purchasing the Structured Product you should consult with your own legal, regulatory, tax, financial and accounting advisors to the extent you consider it necessary, and make your own investment, hedging and trading decisions (including decisions regarding the suitability of the Structured Product) based upon your own judgement and advice from those advisers you consider necessary. Save as otherwise expressly agreed in writing, UBS is not acting as your financial adviser or fiduciary in relation to the Product. UBS generally hedges its exposure to Structured Products, although it may elect not to hedge or to partially hedge any Structured Product. UBS’s hedging activity may be conducted through transactions in the underlying asset, index or instrument or in options, futures or other derivatives related to the underlying asset, index or instrument on publicly traded markets or otherwise, and may have an impact on the price of the under-lying asset. If a transaction is cash settled, UBS will generally unwind or offset any hedge it has for such Structured Product in close proximity to the relevant valuation time or period. In some cases, this activity may affect the value of the Structured Product. Unless stated otherwise in this document, (i) this document is for information purposes only and should not be construed as an offer, personal recommendation or solicitation to purchase the Structured Product and should not be treated as giving investment advice, and (ii) the terms of any investment in the Structured Product will be exclusively subject to the detailed provisions, including risk considerations, contained in the more detailed legal documentation that relates to the Structured Product (being the confirmation, information memorandum, prospectus or other issuer documentation as relevant). UBS makes no representation or warranty relating to any information herein which is derived from independent sources. This document shall not be copied or reproduced without UBS’s prior written permission. In respect of any Structured Product that is a security, no action has been or will be taken in any jurisdiction that would permit a public offering of the Product, save where explicitly stated in the issuer documentation. The Structured Product must be sold in accordance with all applicable selling restrictions in the jurisdictions in which it is sold.
© UBS 2018. All rights reserved. UBS prohibits the forwarding of this information without the approval of UBS.
Weekly-Hits edition of 02.11.20182018-11-02T09:49:19+01:00

Weekly-Hits édition de 26.10.2018

KeyInvest Weekly Hits

Vendredi, 26.10.2018

  • Thème 1: Stratégie Low Vola - En finir avec les montagnes russes
  • Thème 2: Or - La monnaie de crise attire

Stratégie Low Vola
En finir avec les montagnes russes

Guerre commerciale, chaos entraîné par le Brexit et aussi projet de budget italien contesté, trois facteurs qui mènent la vie dure aux investisseurs. Dans le même temps, ils ont fait augmenter fortement la fébrilité sur les marchés d’actions mondiaux. Le ressenti collectif s’exprime dans les volatilités implicites. L’écart de fluctuation des cours intégré dans les options a fortement augmenté au début du quatrième trimestre (cf. graphique à droite). Les stratégies de placement visant des actions avec une volatilité relativement faible ont une fois de plus exploité leurs atouts dans ce contexte. Ceci vaut aussi pour l’indice K Switzerland Low Volatility NTR. Jusqu’à présent, au cours de l’année, cette valeur de base a encore développé sa surperformance de long terme par rapport au SMI™.¹ Avec un PERLES (symbole : SOLVZU), les investisseurs peuvent ajouter cet indice innovant dans leur portefeuille.

Actuellement, l’évolution sur le marché suisse des actions ressemble tout à fait à des montagnes russes. Entre juillet et septembre 2018, la valeur du SMI™ a progressé de 5.6 %. L’indice directeur indigène a ainsi enregistré son trimestre le plus fort depuis les trois premiers mois de 2013. Mais une percée vers le haut n’a pas été possible. Bien plus, au cours des dernières semaines, le SMI™ s’est fortement retourné à la baisse. Juste avant la fin du mois, le bilan d’octobre affichait une baisse de 3,5 %. ¹ Sur le long terme, on considère que de tels mouvements de hausse et de baisse pèsent sur les rendements. Des travaux scientifiques ont révélé que les portefeuilles comportant des titres relativement moins fluctuants produisent de meilleurs résultats sur la durée que le marché en général. Ils s’opposent donc à la théorie classique des marchés de capitaux. Cette théorie admet que le produit d’un portefeuille diversifié est d’autant plus important que l’investisseur accepte de prendre des risques. Dès 1972, Robert Haugen et James Heins parlaient de la « Low Volatility Anomaly » ou anomalie de faible volatilité. 20 ans après, les scientifiques américains Eugene Farma et Kenneth French publiaient un modèle à trois facteurs. Parmi les caractéristiques stimulant le rendement qui y sont esquissées, on trouve une faible volatilité.

C’est précisément sur ce point que l’indice Switzerland Low Volatility mise. Cet indice est à la base d’une méthode Smart Beta. Cela signifie que la composition de l’indice s’éloigne de la pondération traditionnelle en fonction de la capitalisation de marché des actions qu’il contient. Au contraire, le concept mise sur une stratégie de faible volatilité sur le marché suisse des actions. Dans ce contexte, les 300 entreprises ayant la capitalisation la plus importante sont candidates à l’admission. Dans cet univers, chaque mois, on choisit les 20 actions ayant la plus faible marge de volatilité des cours. La volatilité inversée est déterminante pour la pondération. Cela signifie que la part d’une action est d’autant plus importante que ses cours dépassent ceux des autres membres de l’indice. Pour éviter l’accumulation des risques, la pondération d’une composante est limitée à 10 % au maximum.
Dans la composition actuelle de l’indice K Switzerland Low Volatility, on retrouve toute la fourchette du marché national des actions. Outre neuf membres du SMI™, onze entreprises de la deuxième et de la troisième série sont comprises dans l’indice. On y trouve aussi plusieurs actions pour lesquelles les récentes turbulences du marché n’ont pas eu d’importantes conséquences. Par exemple, Helvetia Holding, PSP Swiss Property et Lindt & Sprüngli ont progressé en valeur jusqu’à présent cette année.¹

Opportunités: le PERLES coté au SIX (symbole : SOLVZU) permet un positionnement diversifié sur les 20 titres les moins fluctuants du marché suisse des actions. Le produit reproduit l’indice K Switzerland Low Volatility pour une commission de gestion de 1.00 % p.a. D’éventuels dividendes versés par les entreprises qu’il contient sont réinvestis net dans le sous-jacent. Si la durée est limitée à sept ans au total, elle peut être prolongée de la même durée par la suite.

Risques: il n’existe aucune protection du capital pour le produit présenté. Avec un PERLES, il est possible d’essuyer des pertes en cas de baisse de l’indice sous-jacent. Par ailleurs, avec les produits structurés, l’investisseur supporte le risque d’émetteur. Cela signifie qu’en cas d’insolvabilité d’UBS SA, le capital investi peut être perdu, indépendamment de l’évolution du sous-jacent.

Vous trouverez davantage de produits UBS et des informations sur les opportunités et les risques à l’adresse ubs.com/keyinvest.

K Switzerland Low Volatility NTR Index vs. SMI™ TR Index
(5 ans, aux fins d’illustration uniquement, données en %)¹
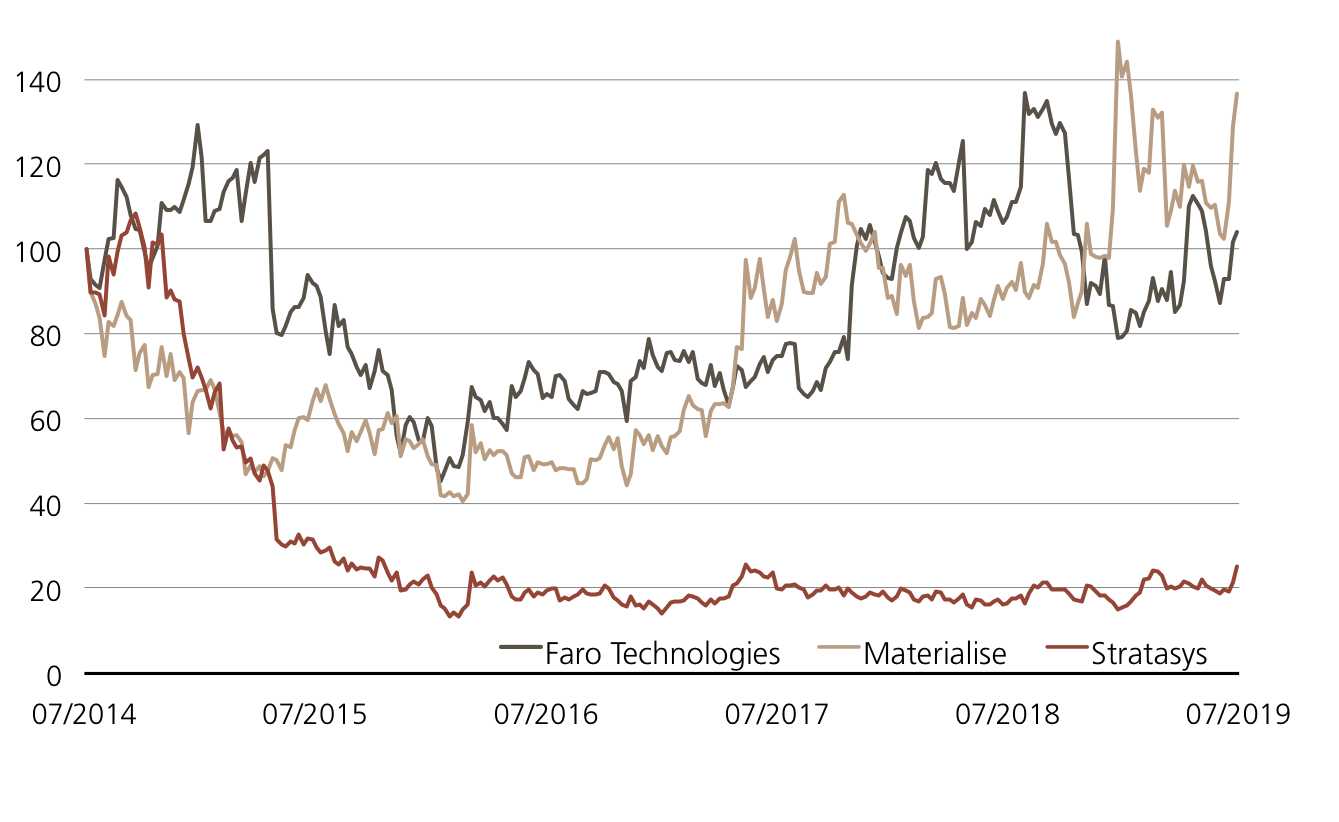
Dans le passé, le calcul du K Switzerland Low Volatily Index est tombé juste. Sur cinq ans, l’indice de référence Smart Beta a obtenu une nette surperformance par rapport au SMI™.

Source: UBS AG, Bloomberg

Valeurs du: 25.10.2018

Helvetia Holding vs. Lindt & Sprüngli vs. PSP Swiss Property
(5 ans, aux fins d’illustration uniquement, données en %)¹
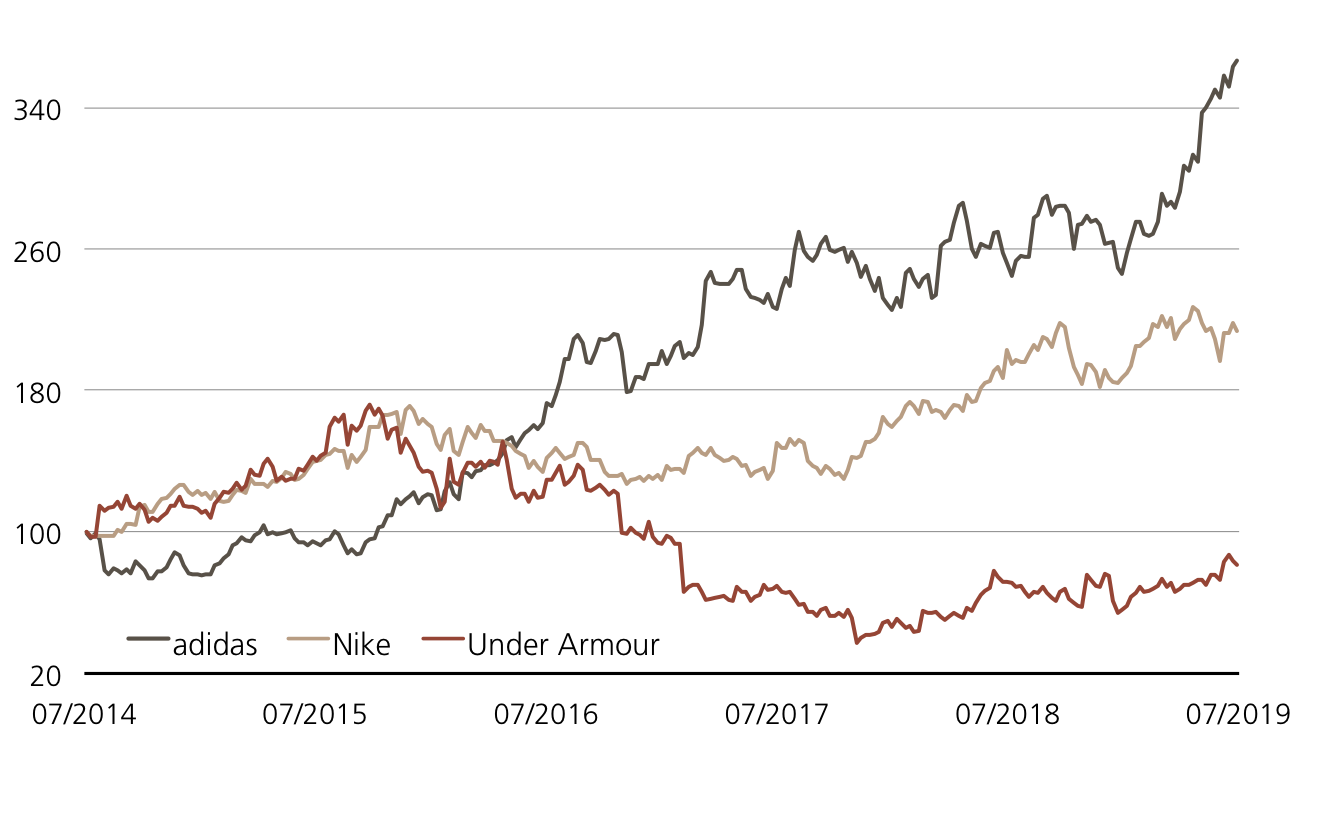
Assurance, chocolat, immeubles, les entreprises Helvetia, Lindt & Sprüngli et PSP actives dans ces trois domaines ont contribué à la récente surperformance de l’indice K Switzerland Low Volatility.

Source: UBS AG, Bloomberg

Valeurs du: 25.10.2018

¹) La performance passée n’indique pas les résultats futures.
²) Les condition des ETTs sont vérifiés annuellement et peuvent être ajustées avec un délai de 13 mois après la publication.

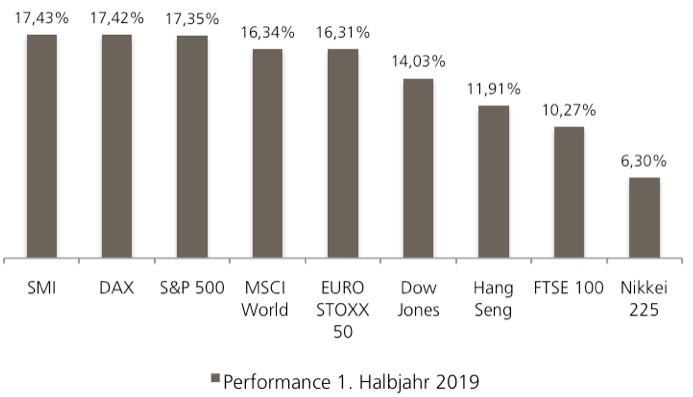
PERLES sur K Switzerland Low Volatility Index

Symbol SOLVZU
SVSP Name Tracker-Certifikat
SPVSP Code 1300
Sous-jacent K Switzerland Low Volatility Index
Rapport de souscription 1:1
Devise CHF
Frais de gestion 1.00% p.a.
Participation 100%
Echéance 17.04.2023
Émetteur UBS AG, London
Bid/Ask CHF 251.25 / 252.75
 

K Switzerland Low Volatility Index – composition au 31.08.2018

Helvetia PSP Swiss Property
Baloise Swiss Prime Site
Nestlé Swiss Re
Kuehne & Nagel Swiss LIfe
Swisscom SGS
Lindt & Sprüngli Schindler Holding
Geberit Roche Holding
Givaudan EMS Chemie
Partners Group Barry Callebaut
Zurich Insurance Pargesa Holding
 

Vous trouverez davantage de produits UBS et des informations sur les opportunités et les risques à l’adresse ubs.com/keyinvest.

Source: UBS AG, Bloomberg

Valeurs du: 25.10.2018

Apérçu du marché

Index Citation Semaine¹
SMI™ 8’724.61 -0.3%
SLI™ 1’358.59 -2.9%
S&P 500™ 2’656.10 -5.5%
Euro STOXX 50™ 3’130.33 -3.5%
S&P™ BRIC 40 3’744.33 -3.2%
CMCI™ Compos. 949.39 -1.6%
Gold (once troy) 1’231.10 USD 0.3%

¹ Changement basé sur le cours de clôture du jour précédent par rapport au cours de clôture de la semaine dernière.

SMI™ vs. VSMI™ 1 année

L’index VSMI™ est calculé depuis 2005. Il affiche la volatilité des actions inclus dans le SMI™ index. Pour la calculation, un portefeuille est utilisé qui ne réagit qu’au variations de la volatilité au lieu des variations des prix. En le faisant, la méthodologie du VSMI™ utilise la volatilité carré, connu sous le terme variance, des options sur le SMI avec 30 jours jusqu’à l’échéance négociées à la Bourse Eurex.

Source: UBS AG, Bloomberg

Valeurs du: 25.10.2018

Or
La monnaie de crise attire

Si octobre a été charmant d’un point de vue météorologique, la situation boursière a été moins sympathique. Comme nous l’avons déjà traité dans les deux pages précédentes, la correction de cours sur les marchés d’actions a généré une forte hausse de la volatilité. Dans le même temps, l’or s’est signalé. Depuis fin-septembre, la monnaie de crise a renchérit de 3,4 %. ¹ En conséquence, l’ETC (symbole : CGCCIU) sur l’indice UBS Bloomberg CMCI Gold CHF Monthly Hedged TR semble s’échapper d’une tendance baissière technique par le haut. Ce produit de participation permet un positionnement optimisé sur le métal précieux.

Jusqu’à la fin du troisième trimestre, la plupart des investisseurs ont méprisé le placement refuge or. En particulier la nette hausse des taux d’intérêt aux Etats-Unis et la force du dollar US en résultant pesaient sur le métal précieux. Même si la demande pour le billet vert reste forte (il s’agit d’une monnaie de crise) et maintient un niveau élevé, le prix de l’or a fortement augmenté ces dernières semaines. Manifestement, l’augmentation des facteurs généraux d’insécurité a mené les investisseurs à s’engager plus fortement sur le mode sans risques. En particulier la situation en Italie préoccupe les marchés financiers. Le gouvernement du parti de droite la Ligue et le mouvement populiste 5 étoiles prévoient pour 2019 un endettement dépassant nettement le niveau promis par le gouvernement précédent. La Commission européenne a rejeté le projet de Rome, fait inédit dans l’histoire de la zone euro. « Si la confiance disparaît, cela nuira à tous les Etats-membres, cela nuira à notre Union », a déclaré le vice-président de la Commission Valdis Dombrovski pour expliquer cette première. L’Italie dispose désormais de trois semaines pour réagir aux critiques et présenter un nouveau budget pour 2019 à Bruxelles. (Source : Thomson Reuters, revue de presse, 23.10.2018).

Opportunités: avec l’ETC (symbole: CGCCIU) sur l’indice UBS Bloomberg CMCI Gold CHF Monthly Hedged TR, les investisseurs peuvent diversifier simplement et à bon compte leur portefeuille. Le sous-jacent du produit est constitué par le prix de l’or, via plusieurs contrats à terme. Dans ce contexte, de manière typique pour la gamme d’indices CMCI, le positionnement s’effectue sur toute la courbe des futurs et l’ensemble des échéances liquides. Un mécanisme de sauvegarde permet de neutraliser les fluctuations entre la valeur de manière première en dollar US et la monnaie du produit (franc Suisse) sur une base mensuelle.

Risques: il n’existe aucune protection du capital pour le produit présenté. Avec un ETC, il est possible d’essuyer des pertes en cas de baisse de l’indice sous-jacent. Par ailleurs, avec les produits structurés, l’investisseur supporte le risque d’émetteur. Cela signifie qu’en cas d’insolvabilité d’UBS SA, le capital investi peut être perdu, indépendamment de l’évolution du sous-jacent.

Vous trouverez davantage de produits UBS et des informations sur les opportunités et les risques à l’adresse ubs.com/keyinvest.

Or (en dollars US par once fine) 5 ans¹

Source: UBS AG, Bloomberg

Valeurs du: 25.10.2018

ETC sur UBS Bloomberg CMCI Gold CHF Monthly Hedged TR Index

Symbol CGCCIU
SVSP Name Tracker-Certifikat
SPVSP Code 1300
Sous-jacent UBS Bloomberg CMCI Gold Monthly Hedged TR Index
Rapport de souscription 10:1
Devise CHF
Frais de gestion 0.38%
Participation 100%
Echéance Open End
Émetteur UBS AG, London
Bid/Ask CHF 74.75 / 75.10
 

Vous trouverez davantage de produits UBS et des informations sur les opportunités et les risques à l’adresse ubs.com/keyinvest.

Source: UBS AG, Bloomberg

Valeurs du: 25.10.2018

¹) La performance passée n’indique pas les résultats futures.
²) Les condition des ETTs sont vérifiés annuellement et peuvent être ajustées avec un délai de 13 mois après la publication.

This material has been prepared by UBS AG or one of its affiliates («UBS»). This material is for distribution only as permitted by law. It is not prepared for the needs of any specific recipient. It is published solely for information and is not a solicitation or offer to buy or sell any securities or related financial instruments (“Instruments”). UBS makes no representation or warranty, either express or implied, on the completeness or reliability of the information contained in this document (“Information”) except that concerning UBS AG and its affiliates. The Information should not be regarded by recipients as a substitute for using their own judgment. Any opinions expressed in this material may change without notice and may be contrary to opinions expressed by other business areas of UBS as a result of using different assumptions or criteria. UBS is under no obligation to update the Information. UBS, its officers, employees or clients may have or have had an interest in the Instruments and may at any time transact in them. UBS may have or have had a relationship with entities referred to in the Information. Neither UBS nor any of its affiliates, or their officers or employees, accepts any liability for any loss arising from use of the Information. This presentation is not a basis for entering into a transaction. Any transaction between you and UBS will be subject to the detailed provisions of the term sheet, confirmation or electronic matching systems relating to that transaction. Clients wishing to effect transactions should contact their local sales representative.
This information is communicated by UBS AG and/or its affiliates («UBS»). * (see below) UBS may from time to time, as principal or agent, have positions in, or may buy or sell, or make a market in any securities, currencies, financial instruments or other assets underlying the product to which this website relates (the «Structured Product»). UBS may provide investment banking and other services to and/or have officers who serve as directors of the companies referred to in this website. UBS’s trading and/or hedging activities related to the Structured Product may have an impact on the price of the underlying asset and may affect the likelihood that any relevant barrier or relevant trigger event is crossed or triggered. UBS has policies and procedures designed to minimise the risk that officers and employees are influenced by any conflicting interest or duty and that confidential information is improperly disclosed or made available. UBS may pay or receive brokerage or retrocession fees in connection with the Structured Product described herein. In respect of any Structured Product that is a security, UBS may, in certain circumstances, sell the Structured Product to dealers and other financial institutions at a discount to the issue price or rebate to them for their own account some proportion of the issue price. Further information is available on request. Structured Products are complex and may involve a high risk of loss. Prior to purchasing the Structured Product you should consult with your own legal, regulatory, tax, financial and accounting advisors to the extent you consider it necessary, and make your own investment, hedging and trading decisions (including decisions regarding the suitability of the Structured Product) based upon your own judgement and advice from those advisers you consider necessary. Save as otherwise expressly agreed in writing, UBS is not acting as your financial adviser or fiduciary in relation to the Product. UBS generally hedges its exposure to Structured Products, although it may elect not to hedge or to partially hedge any Structured Product. UBS’s hedging activity may be conducted through transactions in the underlying asset, index or instrument or in options, futures or other derivatives related to the underlying asset, index or instrument on publicly traded markets or otherwise, and may have an impact on the price of the under-lying asset. If a transaction is cash settled, UBS will generally unwind or offset any hedge it has for such Structured Product in close proximity to the relevant valuation time or period. In some cases, this activity may affect the value of the Structured Product. Unless stated otherwise in this document, (i) this document is for information purposes only and should not be construed as an offer, personal recommendation or solicitation to purchase the Structured Product and should not be treated as giving investment advice, and (ii) the terms of any investment in the Structured Product will be exclusively subject to the detailed provisions, including risk considerations, contained in the more detailed legal documentation that relates to the Structured Product (being the confirmation, information memorandum, prospectus or other issuer documentation as relevant). UBS makes no representation or warranty relating to any information herein which is derived from independent sources. This document shall not be copied or reproduced without UBS’s prior written permission. In respect of any Structured Product that is a security, no action has been or will be taken in any jurisdiction that would permit a public offering of the Product, save where explicitly stated in the issuer documentation. The Structured Product must be sold in accordance with all applicable selling restrictions in the jurisdictions in which it is sold.
© UBS 2018. All rights reserved. UBS prohibits the forwarding of this information without the approval of UBS.
Weekly-Hits édition de 26.10.20182018-10-26T09:21:04+02:00

Weekly-Hits edition of 26.10.2018

KeyInvest Weekly Hits

Friday, 26.10.2018

  • Topic 1: Low-volatility strategy - Get off the roller coaster
  • Topic 2: Gold - The crisis currency moves up

Low-volatility strategy
Get off the roller coaster

Trade disputes, Brexit chaos and a controversial Italian budget proposal – these three factors have been making life uncomfortable for investors recently. They have also caused the turbulence on the global equity markets to rise sharply. Collective sentiment is reflected in implied volatilities. The range of fluctuation priced into options shot up at the start of the fourth quarter (see chart). In an environment like this, investment strategies targeting stocks with relatively low volatility could come into their own once again. The same goes for the K Switzerland Low Volatility NTR Index. Year to date this underlying has extended its long-term outperformance of the SMITM.1 A PERLES (symbol: SOLVZU) can give investors exposure to this benchmark in their portfolio.

Performance on the Swiss equity market is something of a roller coaster at the moment. The SMITM gained 5.6% between July and September 2018. This was the strongest performance the domestic blue chip index had posted since the first three months of 2013. But it was not enough for a breakout to the upside. Instead, recent weeks have seen the SMITM move down smartly. Shortly before the end of October the performance for the month was down 3.5%.1 Over extended periods these ups and downs in prices reduce returns. Academic studies have demonstrated that portfolios of relatively low-volatility stocks beat the broader market in the long term. This puts them at odds with traditional capital market theory, which assumes that the more risk an investor takes, the higher the return on a diversified portfolio. Robert Haugen and James Heins documented the “low volatility anomaly” as long ago as 1972. Twenty years after that, US researchers Eugene Fama and Kenneth French published a three-factor model. One of the characteristics this featured as driving returns was low volatility.

This is the starting point for the K Switzerland Low Volatility Index. The benchmark is based on smart beta methodology. In other words, the composition of the index does not weight the constituent stocks by market capitalization in the traditional way. Instead, it implements a low-volatility strategy in the Swiss equity market. Candidates for inclusion come from the 300 companies with the largest capitalization. Every month a filter selects the 20 stocks with the lowest range of price fluctuations from this universe. Weightings are based on inverse volatility, so the less a stock price moves compared to the other index constituents, the higher its percentage. The weighting of a single component is capped at 10% to avoid cluster risk.
The current composition of the K Switzerland Low Volatility Index reflects the full range of the domestic equity market: there are nine stocks in the SMITM and 11 second and third-liners. These include several shares which have been little affected by the recent market turbulence. Helvetia Holding, PSP Swiss Property and Lindt & Sprüngli, for example, have risen year to date¹.

Opportunities: The PERLES is listed on SIX (symbol: SOLVZU) and is a way of taking a diversified position in the 20 lowest-volatility stocks on the Swiss equity market. The product replicates the K Switzerland Low Volatility Index for an annual management fee of 1.00%. Any dividends on the constituents are reinvested net in the underlying. The term is limited to a total of seven years, but this can be extended by the same period.

Risks: This product does not have capital protection. With a PERLES, losses are incurred if the underlying index falls. Investors in structured products are also exposed to issuer risk, which means that the capital invested may be lost if UBS AG becomes insolvent, regardless of the performance of the underlying.

More UBS products and further information on the risks and opportunities are available at ubs.com/keyinvest.

K Switzerland Low Volatility NTR Index vs. SMI™ TR Index
(5 years; for illustrative purposes only; figures in %)¹

The K Switzerland Low Volatility Index has risen in the past. Over a five-year period the smart beta benchmark has outperformed the SMITM considerably.

Source: UBS AG, Bloomberg

As of 25.10.2018

Helvetia Holding vs. Lindt & Sprüngli vs. PSP Swiss Property
(5 years; for illustrative purposes only; figures in %)¹

Insurance, chocolate and real estate are the industries Helvetia, Lindt & Sprüngli and PSP operate in, all of which have contributed to the recent outperformance of the K Switzerland Low Volatility Index.

Source: UBS AG, Bloomberg

As of: 25.10.2018

¹) Please be aware that past performance does not indicate future results.
²) The conditions of ETTs are reviewed on a yearly basis and can be adjusted with a deadline of 13 months after the announcement.

PERLES on the K Switzerland Low Volatility Index

Symbol SOLVZU
SVSP Name Tracker-Certifikat
SPVSP Code 1300
Underlying K Switzerland Low Volatility Index
Ratio 1:1
Currency CHF
Administration fee 1.00% p.a.
Participation 100%
Expiry 17.04.20123
Issuer UBS AG, London
Bid/Ask CHF 251.25 / 252.75
 

K Switzerland Low Volatility Index – Composition as of 31.08.2018

Helvetia PSP Swiss Property
Baloise Swiss Prime Site
Nestlé Swiss Re
Kuehne & Nagel Swiss LIfe
Swisscom SGS
Lindt & Sprüngli Schindler Holding
Geberit Roche Holding
Givaudan EMS Chemie
Partners Group Barry Callebaut
Zurich Insurance Pargesa Holding
 

More UBS products and further information on the risks and opportunities are available at ubs.com/keyinvest.

Source: UBS AG, Bloomberg

As of: 25.10.2018

Market overview

Index Quotation Week¹
SMI™ 8’724.61 -0.3%
SLI™ 1’358.59 -2.9%
S&P 500™ 2’656.10 -5.5%
Euro STOXX 50™ 3’130.33 -3.5%
S&P™ BRIC 40 3’744.33 -3.2%
CMCI™ Compos. 949.39 -1.6%
Gold (troy ounce) 1’231.10 USD 0.3%

¹ Change based on the closing price of the previous day compared to the closing price a week ago.

SMI™ vs. VSMI™ 1 year

smi vs vsmi

The VSMI™ Index is calculated since 2005. It shows the volatility of the stocks within the SMI™ index. A portfolio which reacts only to changes in volatility instead of volatility itself is relevant for the calculation. Thereby, the VSMI™ methodology uses the squared volatility, known as variance, of the SMI options with remaining time to expiry of 30 days traded at the Eurex.

Source: UBS AG, Bloomberg

As of: 25.10.2018

Gold
The crisis currency moves up

The weather may have been nice in October, but things were less agreeable on the stock market. As discussed on the preceding pages, equity market corrections pushed volatility up sharply. At the same time, gold showed signs of life. The crisis currency has risen 3.4% since the end of September.¹ Logically, the ETC (Symbol: CGCCIU) on the UBS Bloomberg CMCI Gold CHF Monthly Hedged TR Index broke out to the upside of its downward technical trend. This participation product makes it possible to take roll-optimized positions in the precious metal.

Most investor showed little interest in gold as a safe haven until the end of the third quarter. The steep increase in interest rates in the USA and the associated strength of the dollar weighed on it in particular. While the greenback itself remains in demand as a crisis currency and is holding up at a high level, the gold price has shot up in recent weeks. Clearly the rise in general uncertainty factors has driven increasing numbers of investors to switch to risk-off mode. The situation in Italy is of special concern for financial markets. The government of the right-wing Lega party and the populist Five Star movement is planning to raise far more new debt in 2019 than its predecessor had indicated. The EU Commission has rejected Rome’s draft proposal, something which has never happened before in the history of the Eurozone. “If trust is eroded, all Member States take damage, our union takes damage,” said Commission Vice-President Valdis Dombrovskis of this unprecedented step. Italy now has three weeks to react to the criticism and submit a new budget for 2019 to Brussels. (Source: Thomson Reuters media report, 23 October 2018)

Opportunities: The ETC (Symbol: CGCCIU) on the UBS Bloomberg CMCI Gold CHF Monthly Hedged TR Index allows investors to diversify their portfolios simply and cheaply. The product underlying replicates the gold price by using various futures contracts. As is typical for the CMCI index family, positions are taken across the entire forward curve and all liquid maturities. A hedging mechanism ensures that fluctuations between the US dollar (the currency gold is priced in) and the Swiss franc (the product currency) are neutralized every month.

Risks: This product does not have capital protection. With an ETC, losses are incurred if the underlying index falls. Investors in structured products are also exposed to issuer risk, which means that the capital invested may be lost if UBS AG becomes insolvent, regardless of the performance of the underlying.

More UBS products and further information on the risks and opportunities are available at ubs.com/keyinvest.

Gold (in US dollars per fine ounce) 5 years¹

Source: UBS AG, Bloomberg

As of: 25.10.2018

ETC on the UBS Bloomberg CMCI Gold CHF Monthly Hedged TR Index

Symbol CGCCIU
SVSP Name Tracker-Certifikat
SPVSP Code 1300
Underlyings UBS Bloomberg CMCI Gold Monthly Hedged TR Index
Currency CHF
Ratio 10:1
Administration fee 0.38% p.a.
Participation 100%
Expiry Open End
Issuer UBS AG, London
Bid/Ask CHF 74.75 / 75.10
 

More UBS products and further information on the risks and opportunities are available at ubs.com/keyinvest.

Source: UBS AG, Bloomberg

As of: 25.10.2018

¹) Please be aware that past performance does not indicate future results.
²) The conditions of ETTs are reviewed on a yearly basis and can be adjusted with a deadline of 13 months after the announcement.

This material has been prepared by UBS AG or one of its affiliates («UBS»). This material is for distribution only as permitted by law. It is not prepared for the needs of any specific recipient. It is published solely for information and is not a solicitation or offer to buy or sell any securities or related financial instruments (“Instruments”). UBS makes no representation or warranty, either express or implied, on the completeness or reliability of the information contained in this document (“Information”) except that concerning UBS AG and its affiliates. The Information should not be regarded by recipients as a substitute for using their own judgment. Any opinions expressed in this material may change without notice and may be contrary to opinions expressed by other business areas of UBS as a result of using different assumptions or criteria. UBS is under no obligation to update the Information. UBS, its officers, employees or clients may have or have had an interest in the Instruments and may at any time transact in them. UBS may have or have had a relationship with entities referred to in the Information. Neither UBS nor any of its affiliates, or their officers or employees, accepts any liability for any loss arising from use of the Information. This presentation is not a basis for entering into a transaction. Any transaction between you and UBS will be subject to the detailed provisions of the term sheet, confirmation or electronic matching systems relating to that transaction. Clients wishing to effect transactions should contact their local sales representative.
This information is communicated by UBS AG and/or its affiliates («UBS»). * (see below) UBS may from time to time, as principal or agent, have positions in, or may buy or sell, or make a market in any securities, currencies, financial instruments or other assets underlying the product to which this website relates (the «Structured Product»). UBS may provide investment banking and other services to and/or have officers who serve as directors of the companies referred to in this website. UBS’s trading and/or hedging activities related to the Structured Product may have an impact on the price of the underlying asset and may affect the likelihood that any relevant barrier or relevant trigger event is crossed or triggered. UBS has policies and procedures designed to minimise the risk that officers and employees are influenced by any conflicting interest or duty and that confidential information is improperly disclosed or made available. UBS may pay or receive brokerage or retrocession fees in connection with the Structured Product described herein. In respect of any Structured Product that is a security, UBS may, in certain circumstances, sell the Structured Product to dealers and other financial institutions at a discount to the issue price or rebate to them for their own account some proportion of the issue price. Further information is available on request. Structured Products are complex and may involve a high risk of loss. Prior to purchasing the Structured Product you should consult with your own legal, regulatory, tax, financial and accounting advisors to the extent you consider it necessary, and make your own investment, hedging and trading decisions (including decisions regarding the suitability of the Structured Product) based upon your own judgement and advice from those advisers you consider necessary. Save as otherwise expressly agreed in writing, UBS is not acting as your financial adviser or fiduciary in relation to the Product. UBS generally hedges its exposure to Structured Products, although it may elect not to hedge or to partially hedge any Structured Product. UBS’s hedging activity may be conducted through transactions in the underlying asset, index or instrument or in options, futures or other derivatives related to the underlying asset, index or instrument on publicly traded markets or otherwise, and may have an impact on the price of the under-lying asset. If a transaction is cash settled, UBS will generally unwind or offset any hedge it has for such Structured Product in close proximity to the relevant valuation time or period. In some cases, this activity may affect the value of the Structured Product. Unless stated otherwise in this document, (i) this document is for information purposes only and should not be construed as an offer, personal recommendation or solicitation to purchase the Structured Product and should not be treated as giving investment advice, and (ii) the terms of any investment in the Structured Product will be exclusively subject to the detailed provisions, including risk considerations, contained in the more detailed legal documentation that relates to the Structured Product (being the confirmation, information memorandum, prospectus or other issuer documentation as relevant). UBS makes no representation or warranty relating to any information herein which is derived from independent sources. This document shall not be copied or reproduced without UBS’s prior written permission. In respect of any Structured Product that is a security, no action has been or will be taken in any jurisdiction that would permit a public offering of the Product, save where explicitly stated in the issuer documentation. The Structured Product must be sold in accordance with all applicable selling restrictions in the jurisdictions in which it is sold.
© UBS 2018. All rights reserved. UBS prohibits the forwarding of this information without the approval of UBS.
Weekly-Hits edition of 26.10.20182018-10-26T09:07:07+02:00

Weekly-Hits édition de 19.10.2018

KeyInvest Weekly Hits

Vendredi, 19.10.2018

  • Thème 1: Actions du secteur des puces et semi-conducteurs - La liquidation comme opportunité d’entrée
  • Thème 2: BMW/Tesla - Un constructeur Premium au courant

Actions du secteur des puces et semi-conducteurs
La liquidation comme opportunité d’entrée

On a récemment observé une véritable liquidation pour les actions du secteur des puces et semi-conducteurs. L’indice des semi-conducteurs de la bourse de Philadelphie a plongé de plus de 4% en une semaine. Infineon, le titre du DAX, a encore souffert davantage puisqu’il a perdu environ le double sur la même période. On trouve aussi depuis un certain temps sur la liste des ventes des courtiers en valeurs mobilières AMS, le spécialiste des puces qui a même perdu, sur un mois, plus du quart de sa capitalisation de marché.¹ Après les ventes générales dans le secteur, il pourrait être tout à fait judicieux de réfléchir à une entrée, compte tenu du faible niveau des cours. Au vu des incertitudes boursières, il ne faudra toutefois pas renoncer à une protection partielle sous condition. Le Double Coupon Kick-In GOAL (symbole : KCRRDU) sur AMS, Infineon et Intel actuellement en souscription présente des conditions intéressantes. Outre une marge de sécurité de 40% et un coupon de 10% p.a., le produit offre aussi l’opportunité supplémentaire de doubler le rendement. Pour ceux qui préféreraient ne miser que sur un sous-jacent, nous recommandons de considérer l’Early Redemption Kick-In GOAL (symbole : KCSEDU) sur AMS. En seulement deux ans, une rémunération de 10.00% p.a. est ainsi possible.

Même si actuellement les entreprises de semi-conducteurs subissent de fortes fluctuations en bourse, le secteur reste sur la voie de la croissance. Selon les experts d’IC Insights, le marché mondial des puces devrait progresser de 14% à 509.1 milliards de dollars US pour l’année en cours, et dépasser ainsi pour la première fois le seuil du demi-billion de dollars US. Au vu des nouvelles tendances technologiques telles que le Big Data, l’Internet des objets (IoT) ou l’intelligence artificielle, la demande de puces devrait rester forte. IC Insights estime que la part des semi-producteurs aux produits électroniques devrait passer de 28.8% en 2017 à 31.5% en 2022. (Source : IC Insights, 18.07.2018)

Selon les analystes de CIO WM, la saine demande de semi-conducteurs se reflète déjà dans l’évolution des grands de la branche. En conséquence, les experts ont actuellement classé le secteur comme « neutre ». Ils soulignent Intel comme leur entreprise préférée. Le géant des puces participe notamment vigoureusement aux tendances d’avenir Data-Center et IoT. Ces deux segments ont progressé au deuxième trimestre de 27 et 22% ce qui vaut la peine d’être remarqué. Pour l’exercice en cours, Intel prévoit un chiffre d’affaires record pour la troisième fois consécutive.
Pour Infineon également, les signaux indiquent toujours la croissance. Suite aux récentes secousses de cours, les Allemands confirment leurs objectifs de croissance pour 2018/19 (30 septembre). « Nous ne voyons aucune raison de remettre en question les perspectives », a déclaré un porte-parole de la société (source : Thomson Reuters, communiqué de presse, 10.10.2019). Le groupe prévoit une hausse de 10% de son chiffre d’affaires. La société autrichienne AMS, connue surtout comme fournisseur d’Apple, connaît également une forte croissance, mais subit actuellement une pression sur les marges. Même si UBS IB Research considère qu’il existe des opportunités pour AMS dans la sensorique 3D, les experts classent le titre comme « neutre » avec un objectif de cours réduit à 65 francs.

Opportunités: afin d’obtenir un rendement proportionnel à deux chiffres avec l’Early Redemption Kick-In GOAL (symbole : KCSEDU) sur AMS, il faudra toutefois que l’action n’enregistre aucune avancée. Si la marge de sécurité de 40% est suffisante, le rendement maximal de 10.00% p.a. sera échu en tout juste un an. Le nouveau Double Coupon Kick-In GOAL (symbole : KCRRDU) sur AMS, Infineon et Intel offre une belle chance de gain de 20%. Si à l’échéance le trio s’établit au moins au niveau de sortie ou davantage, le coupon classique de 10% p.a. est doublé. La barrière est éloignée des cours de départ par une marge confortable de 40%.

Risques: les Kick-In GOALS ne bénéficient d’aucune protection du capital. Si, pendant la durée de l’investissement, l’un des sous-jacents atteint une seule fois la barrière respective («Kick-In Level») ou est inférieur à celle-ci, et que la fonction de remboursement anticipé ne s’applique pas, le remboursement par amortissement à l’échéance est basé sur la performance la plus faible (base Strike) du panier (au maximum toutefois à la valeur nominale majorée du coupon). Dans un tel cas, des pertes sont probables. De plus, avec les produits structurés, l’investisseur supporte le risque d’émetteur. Cela signifie qu’en cas d’insolvabilité d’UBS SA, le capital investi peut être perdu, indépendamment de l’évolution des sous-jacents.

Vous trouverez davantage de produits UBS et des informations sur les opportunités et les risques à l’adresse ubs.com/keyinvest.

AMS vs. Infineon vs. Intel (5 ans, aux fins d’illustration uniquement, données en %)¹

ams infineon

Au total, on constate de nettes augmentations sur 5 ans pour les trois actions du secteur des puces et semi-conducteurs. AMS a obtenu les meilleurs résultats. Toutefois, ce fournisseur d’Apple a enregistré récemment de nettes pertes.

Source: UBS AG, Bloomberg

Valeurs du: 19.10.2018

AMS (5 ans)¹

ams

Le fabricant autrichien de semi-conducteurs AMS a débuté il y a environ deux ans un fort mouvement haussier. Lorsque les cours ont dépassé 100 francs, une correction est intervenue.

Source: UBS AG, Bloomberg

Valeurs du: 19.10.2018

¹) La performance passée n’indique pas les résultats futures.
²) Les condition des ETTs sont vérifiés annuellement et peuvent être ajustées avec un délai de 13 mois après la publication.
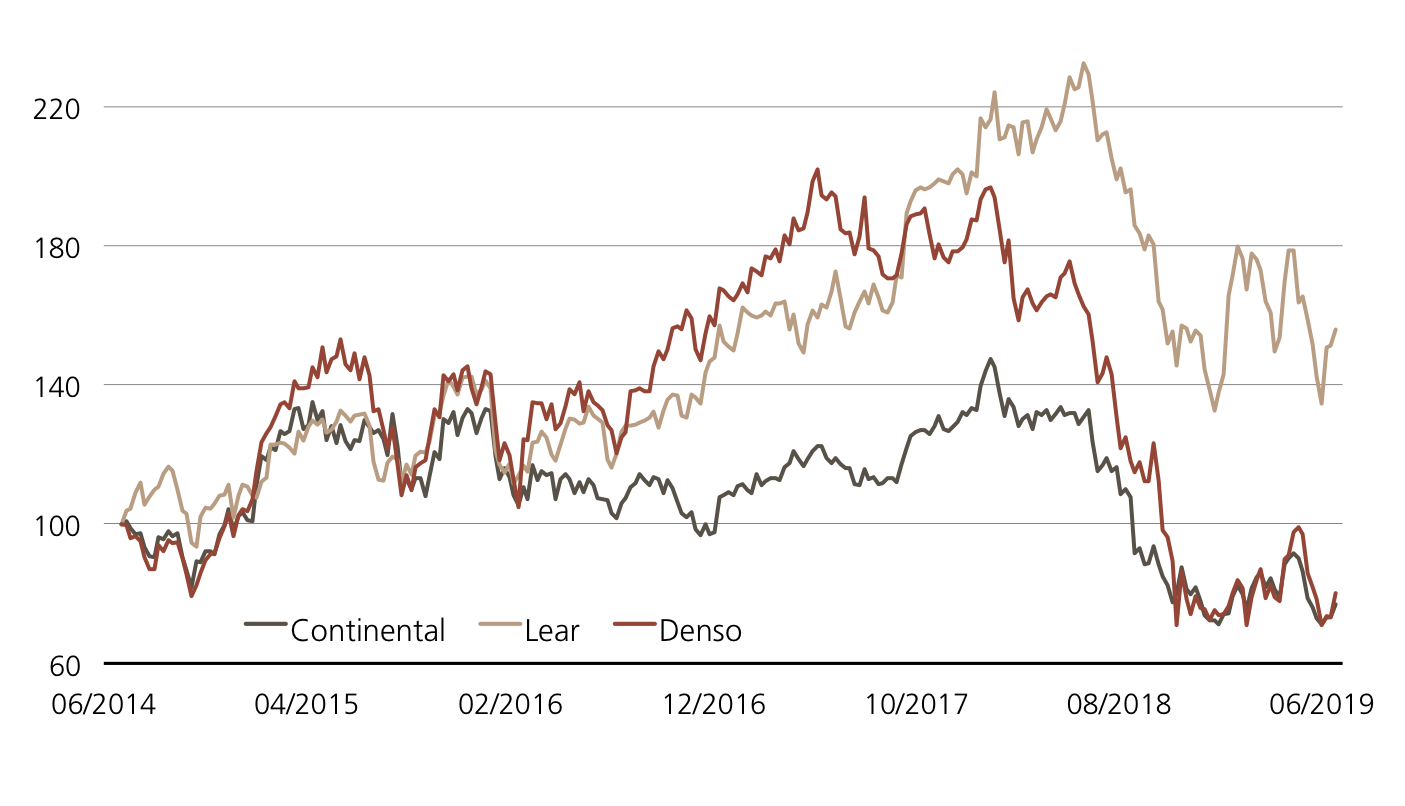
10.00% p.a. Double Coupon Worst of Kick-In GOAL sur AMS, Infineon, Intel

Symbol KCRRDU
SVSP Name Barrier Reverse Convertible
SPVSP Code 1230, Variable Coupon
Sous-jacent AMS, Infineon, Intel
Devise CHF (Quanto)
Coupon 10.00% p.a.
Double Coupon Trigger Level 100%
Kick-In Level 60%
Echéance 31.10.2019
Émetteur UBS AG, London
Date de fixation du prix 31.10.2018, 15:00 h
 

10.00% p.a. ER Kick-In GOAL sur AMS

Symbol KCSEDU
SVSP Name Barrier Reverse Convertible
SPVSP Code 1230, Auto-Callable
Sous-jacent AMS
Devise CHF
Coupon 10.00% p.a.
Strike Level 100%
Kick-In Level 60%
Echéance 02.11.2020
Émetteur UBS AG, London
Date de fixation du prix 31.10.2018, 15:00 h
 

Vous trouverez davantage de produits UBS et des informations sur les opportunités et les risques à l’adresse ubs.com/keyinvest.

Source: UBS AG, Bloomberg

Valeurs du: 19.10.2018

Apérçu du marché

Index Citation Semaine¹
SMI™ 8’750.35 -1.6%
SLI™ 1’399.69 -1.2%
S&P 500™ 2’809.21 0.8%
Euro STOXX 50™ 3’243.08 -0.7%
S&P™ BRIC 40 3’868.91 1.0%
CMCI™ Compos. 965.12 0.1%
Gold (once troy) 1’227.40 2.8%

¹ Changement basé sur le cours de clôture du jour précédent par rapport au cours de clôture de la semaine dernière.

SMI™ vs. VSMI™ 1 année

L’index VSMI™ est calculé depuis 2005. Il affiche la volatilité des actions inclus dans le SMI™ index. Pour la calculation, un portefeuille est utilisé qui ne réagit qu’au variations de la volatilité au lieu des variations des prix. En le faisant, la méthodologie du VSMI™ utilise la volatilité carré, connu sous le terme variance, des options sur le SMI avec 30 jours jusqu’à l’échéance négociées à la Bourse Eurex.

Source: UBS AG, Bloomberg

Valeurs du: 19.10.2018

BMW/Tesla
Un constructeur Premium au courant

Le secteur automobile bruisse de partout. Outre les risques internationaux générés par le conflit douanier ou le Brexit, les régulateurs exercent leur pression sur les constructeurs en mettant en place de nouvelles procédures en matière de tests antipollution. Même si les affaires quotidiennes en souffrent, les groupes ne perdent pas de vue leurs chances futures. Récemment, BMW a créé l’événement. Le constructeur allemand a été le premier étranger à acquérir la majorité dans une joint-venture chinoise. Aux Etats-Unis, c’est Tesla qui fait les grands titres avec des chiffres de production en hausse. De juillet à septembre, 53 239 véhicule du modèle 3 très porteur sont sortis des chaînes, c’est-à-dire plus du double qu’au deuxième trimestre. UBS réunit désormais ces deux constructeurs Premium dans un Callable Worst of Kick-In GOAL (symbole : KCRQDU). Les conditions sont stimulantes : la barrière est établie à 50% du cours initial, le coupon correspond à 20.00% p.a. ce qui est supérieur à la moyenne.

Le charismatique chef de Tesla, pionnier de la voiture électrique, aime les surprises. Actuellement, Elon Musc essaie de transformer l’ordinateur de bord de la Tesla en une console de jeu vidéo. Si cette lubie est loin d’être réalité, les investisseurs eux attendent avec impatience les chiffres du troisième trimestre. Après un premier semestre plutôt faible, Musc a laissé entrevoir qu’il allait désormais travailler de manière « durablement profitable ». Le 30 octobre, Tesla publiera son rapport intermédiaire. Les chiffres positifs ne posent pas de problème pour BMW, mais les Munichois ont récemment effrayé les investisseurs avec un avertissement sur les bénéfices. Toutefois, le groupe automobile ne pratique pas la politique de l’autruche et s’efforce d’avancer. BMW renforce de 25 à 75% sa participation à la joint-venture avec son partenaire chinois Brilliance, et paie à cet effet 3.6 milliards d’euros. Normalement, à partir de 2022, BMW devrait pouvoir consolider totalement Brilliance Automotive dans son bilan. « C’est une nouvelle ère qui commence pour nous », explique Harald Krüger, le PDG du groupe. (Source : Thomson Reuters, revue de presse, 11.10.2018)

Opportunités: BMW et Tesla n’auront pas à accélérer pour amener le Callable Worst of Kick-In GOAL (symbole : KCRQDU) à destination, avec profit. Au contraire : les deux actions automobiles disposent d’une marge de 50% à la baisse sans que l’opportunité de gain de 20% p.a. soit bloquée. La durée maximale d’un an peut être réduite de six mois au maximum en raison de la fonction Callable.

Risques: il n’existe aucune protection du capital pour le produit présenté. Si, pendant la durée de l’investissement, l’un des sous-jacents atteint une seule fois la barrière respective («Kick-In Level») ou est inférieur à celle-ci, et que la fonction de Callable ne s’applique pas, le remboursement à l’échéance par remboursement en espèces est basé sur la performance la plus faible (base Strike) du duo (au maximum toutefois à la valeur nominale majorée du coupon). Dans un tel cas, des pertes sont probables. Par ailleurs, avec les produits structurés, l’investisseur supporte le risque d’émetteur. Cela signifie qu’en cas d’insolvabilité d’UBS SA, le capital investi peut être perdu, indépendamment de l’évolution du sous-jacent.

Vous trouverez davantage de produits UBS et des informations sur les opportunités et les risques à l’adresse ubs.com/keyinvest.

BMW vs. Tesla
(5 ans, aux fins d’illustration uniquement, données en %)¹

bmw

Source: UBS AG, Bloomberg

Valeurs du: 19.10.2018

20.00% p.a. Callable Worst of Kick-In GOAL sur BMW et Tesla

Symbol KCRQDU
SVSP Name Barrier Reverse Convertible
SPVSP Code 1230, Callable
Sous-jacent BMW, Tesla
Devise EUR (Quanto)
Coupon 20.00% p.a.
Kick-In Level 50.00%
Echéance 24.10.2019
Émetteur UBS AG, London
Date de fixation du prix 24.10.2018
 

Vous trouverez davantage de produits UBS et des informations sur les opportunités et les risques à l’adresse ubs.com/keyinvest.

Source: UBS AG, Bloomberg

Valeurs du: 19.10.2018

¹) La performance passée n’indique pas les résultats futures.
²) Les condition des ETTs sont vérifiés annuellement et peuvent être ajustées avec un délai de 13 mois après la publication.
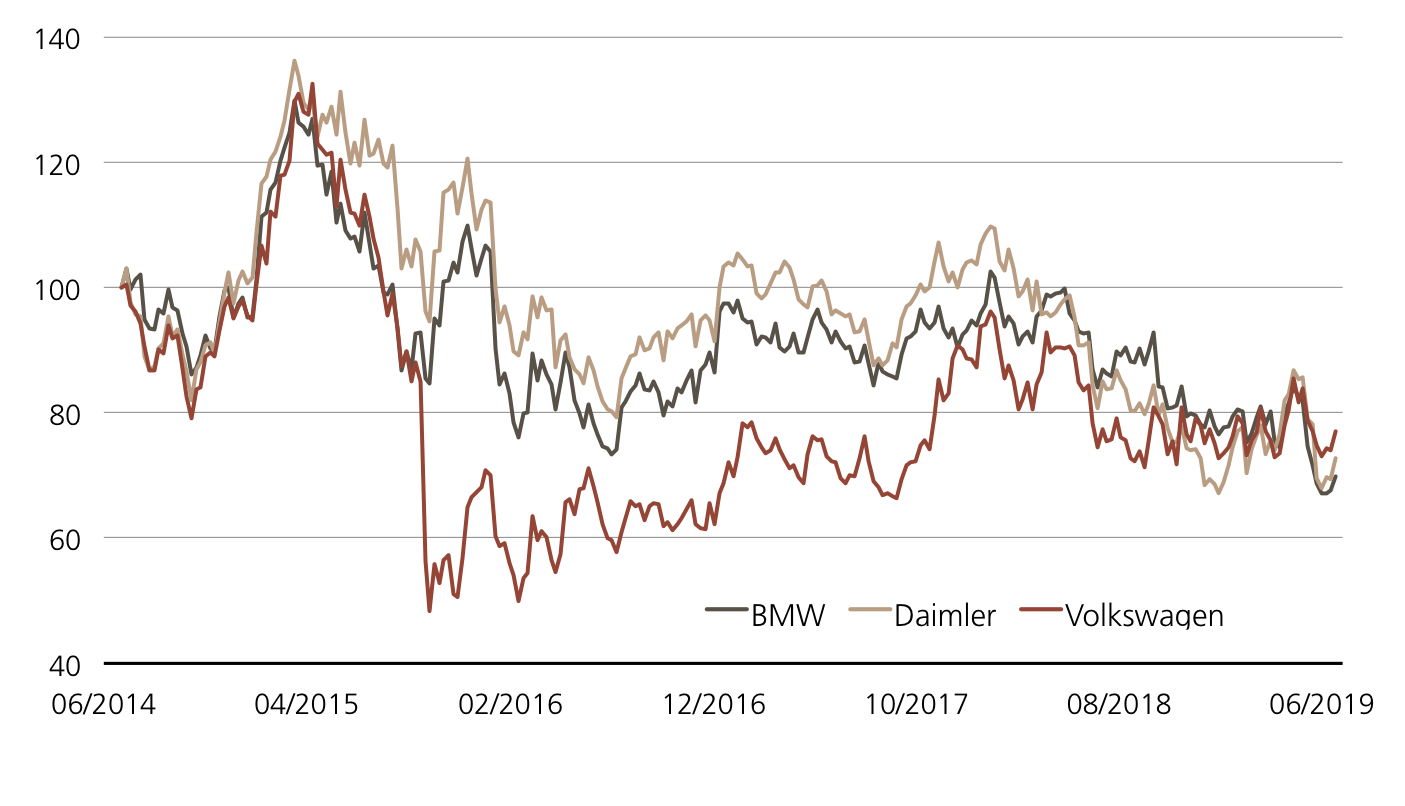
This material has been prepared by UBS AG or one of its affiliates («UBS»). This material is for distribution only as permitted by law. It is not prepared for the needs of any specific recipient. It is published solely for information and is not a solicitation or offer to buy or sell any securities or related financial instruments (“Instruments”). UBS makes no representation or warranty, either express or implied, on the completeness or reliability of the information contained in this document (“Information”) except that concerning UBS AG and its affiliates. The Information should not be regarded by recipients as a substitute for using their own judgment. Any opinions expressed in this material may change without notice and may be contrary to opinions expressed by other business areas of UBS as a result of using different assumptions or criteria. UBS is under no obligation to update the Information. UBS, its officers, employees or clients may have or have had an interest in the Instruments and may at any time transact in them. UBS may have or have had a relationship with entities referred to in the Information. Neither UBS nor any of its affiliates, or their officers or employees, accepts any liability for any loss arising from use of the Information. This presentation is not a basis for entering into a transaction. Any transaction between you and UBS will be subject to the detailed provisions of the term sheet, confirmation or electronic matching systems relating to that transaction. Clients wishing to effect transactions should contact their local sales representative.
This information is communicated by UBS AG and/or its affiliates («UBS»). * (see below) UBS may from time to time, as principal or agent, have positions in, or may buy or sell, or make a market in any securities, currencies, financial instruments or other assets underlying the product to which this website relates (the «Structured Product»). UBS may provide investment banking and other services to and/or have officers who serve as directors of the companies referred to in this website. UBS’s trading and/or hedging activities related to the Structured Product may have an impact on the price of the underlying asset and may affect the likelihood that any relevant barrier or relevant trigger event is crossed or triggered. UBS has policies and procedures designed to minimise the risk that officers and employees are influenced by any conflicting interest or duty and that confidential information is improperly disclosed or made available. UBS may pay or receive brokerage or retrocession fees in connection with the Structured Product described herein. In respect of any Structured Product that is a security, UBS may, in certain circumstances, sell the Structured Product to dealers and other financial institutions at a discount to the issue price or rebate to them for their own account some proportion of the issue price. Further information is available on request. Structured Products are complex and may involve a high risk of loss. Prior to purchasing the Structured Product you should consult with your own legal, regulatory, tax, financial and accounting advisors to the extent you consider it necessary, and make your own investment, hedging and trading decisions (including decisions regarding the suitability of the Structured Product) based upon your own judgement and advice from those advisers you consider necessary. Save as otherwise expressly agreed in writing, UBS is not acting as your financial adviser or fiduciary in relation to the Product. UBS generally hedges its exposure to Structured Products, although it may elect not to hedge or to partially hedge any Structured Product. UBS’s hedging activity may be conducted through transactions in the underlying asset, index or instrument or in options, futures or other derivatives related to the underlying asset, index or instrument on publicly traded markets or otherwise, and may have an impact on the price of the under-lying asset. If a transaction is cash settled, UBS will generally unwind or offset any hedge it has for such Structured Product in close proximity to the relevant valuation time or period. In some cases, this activity may affect the value of the Structured Product. Unless stated otherwise in this document, (i) this document is for information purposes only and should not be construed as an offer, personal recommendation or solicitation to purchase the Structured Product and should not be treated as giving investment advice, and (ii) the terms of any investment in the Structured Product will be exclusively subject to the detailed provisions, including risk considerations, contained in the more detailed legal documentation that relates to the Structured Product (being the confirmation, information memorandum, prospectus or other issuer documentation as relevant). UBS makes no representation or warranty relating to any information herein which is derived from independent sources. This document shall not be copied or reproduced without UBS’s prior written permission. In respect of any Structured Product that is a security, no action has been or will be taken in any jurisdiction that would permit a public offering of the Product, save where explicitly stated in the issuer documentation. The Structured Product must be sold in accordance with all applicable selling restrictions in the jurisdictions in which it is sold.
© UBS 2018. All rights reserved. UBS prohibits the forwarding of this information without the approval of UBS.
Weekly-Hits édition de 19.10.20182018-10-19T09:13:32+02:00

Weekly-Hits edition of 19.10.2018

KeyInvest Weekly Hits

Friday, 19.10.2018

  • Topic 1: Microchip equities - Opportunity to get involved in this sector thanks to the sell-off
  • Topic 2: BMW & Tesla - Premium manufacturers revved up

Microchip equities
Opportunity to get involved in this sector thanks to the sell-off

There was recently a wave of sales in the microchip sector. The Philadelphia Semiconductor Index fell by more than 4% within a single week. Infineon was hit even harder, with the DAX equity declining by around twice as much in the same period. AMS has also been on the “to sell” list of stock exchange speculators for some time now, and the microchip specialist has lost more than a quarter of its market capitalization in the space of a month.¹ Following the general sell-off in the sector, it might now make sense to consider entering the market at this low base. In view of the uncertain situation on the stock markets, however, conditional partial protection is a must. The Double Coupon Kick-In GOAL (symbol: KCRRDU) in subscription on AMS, Infineon and Intel has attractive conditions. In addition to a risk buffer of 40% and a coupon of 10% p.a., the product also offers the additional opportunity of being able to double the return. For those who prefer a product with only one underlying, should take a look at the Early Redemption Kick-In GOAL (symbol: KCSEDU) on AMS, with which a coupon of 10% p.a. is possible within just two years.

Although semiconductor companies are currently exposed to severe fluctuations on the stock market, the industry continues to grow. According to the experts at IC Insights, the global microchip market is expected to grow by 14% to USD 509.1 billion this year, exceeding the half trillion US dollar mark for the very first time. In light of new technology trends such as Big Data, the Internet of Things (IoT) and artificial intelligence, the demand for microchips could continue to remain high. IC Insights estimates that the percentage of electronic products being fitted with semiconductors will increase from 28.8% in 2017 to 31.5% in 2022. (Source: IC Insights, July 18, 2018)

According to analysts at CIO WM, the healthy demand for semiconductors is already being reflected in the activities of the majority of the industry’s big players. Therefore, the experts currently classify the sector as “neutral”, highlighting Intel as their preferred company. The microchip giant is also heavily involved in future trends such as data centers and IoT. In the second quarter, the two segments grew by an estimable 27% and 22%, respectively. Intel expects record sales for the current financial year, thus making it the third year in a row in which they have done so.
At Infineon, too, the signs continue to point to growth. In the wake of the recent share price fluctuation, the Germans confirmed their growth targets for 2018/19 (September 30). “We see no reason to question the outlook,” said an Infineon spokesperson (Source: Thomson Reuters media release, October 10, 2019). The Group expects sales to grow by 10%. Austria-based AMS, which is primarily known as an Apple supplier, is also growing strongly, but faces margin pressure. Even though UBS IB Research sees opportunities for AMS in 3D-sensor technology, the experts rate the equity as “Neutral” and have lowered the target price to CHF 65.

Opportunities: In order to achieve a double-digit percentage return with the Early Redemption Kick-In GOAL (symbol: KCSEDU) on AMS, the equity does not need to grow. If the risk buffer of 40% is maintained, the maximum return of 10% p.a. will be paid out in just under a year. The new Double Coupon Kick-In GOAL (symbol: KCRRDU) on AMS, Infineon and Intel offers a lofty 20% return opportunity. If the three equities are at least level with or above the initial price upon maturity, the traditional coupon of 10% p.a. will be doubled. The barrier stands at a comfortable 40% of the initial fixing price.

Risks: Kick-In GOALs do not have capital protection. If the underlyings touch or fall below the respective Kick-In Level (barrier) and the early redemption feature does not apply, the amount repaid on the maturity date is reflecting the worst performance of the underlyings (but not more than notional value plus coupon). In this case, it is likely that losses will be incurred. Investors in structured products are also exposed to issuer risk, which means that the capital invested may be lost if UBS AG becomes insolvent, regardless of the performance of the underlying.

More UBS products and further information on the risks and opportunities are available at ubs.com/keyinvest.

AMS vs. Infineon vs. Intel (5 years; for illustrative purposes only; figures in %)¹

ams infineon

The three microchip equities are ultimately showing clear upward growth over the next 5 years, with AMS faring the best. Nevertheless, the Apple supplier recently suffered significant losses.

Source: UBS AG, Bloomberg

As of 19.10.2018

AMS (5 years)¹

ams

Austrian semiconductor manufacturer AMS has enjoyed a steep upward trend, which started some two years ago. A correction phase subsequently set in when prices rose above 100 francs.

Source: UBS AG, Bloomberg

As of: 19.10.2018

¹) Please be aware that past performance does not indicate future results.
²) The conditions of ETTs are reviewed on a yearly basis and can be adjusted with a deadline of 13 months after the announcement.

10.00% p.a. Double Coupon Worst of Kick-In GOAL on AMS, Infineon, Intel

Symbol KCRRDU
SVSP Name Barrier Reverse Convertible
SPVSP Code 1230, Variable Coupon
Underlying AMS, Infineon, Intel
Currency CHF (Quanto)
Coupon 10.00% p.a.
Double Coupon Trigger Level 100%
Kick-In Level 60%
Expiry 31.10.2019
Issuer UBS AG, London
Subscription until 31.10.2018, 15:00 h
 

10.00% p.a. ER Kick-In GOAL on AMS

Symbol KCSEDU
SVSP Name Barrier Reverse Convertible
SPVSP Code 1230, Auto-Callable
Underlying AMS
Currency CHF
Coupon 10.00% p.a.
Strike-Level 100%
Kick-In Level 60%
Expiry 02.11.2020
Issuer UBS AG, London
Subscription until 31.10.2018, 15:00 h
 

More UBS products and further information on the risks and opportunities are available at ubs.com/keyinvest.

Source: UBS AG, Bloomberg

As of: 19.10.2018

Market overview

Index Quotation Week¹
SMI™ 8’750.35 -1.6%
SLI™ 1’399.69 -1.2%
S&P 500™ 2’809.21 0.8%
Euro STOXX 50™ 3’243.08 -0.7%
S&P™ BRIC 40 3’868.91 1.0%
CMCI™ Compos. 965.12 0.1%
Gold (troy ounce) 1’227.40 2.8%

¹ Change based on the closing price of the previous day compared to the closing price a week ago.

SMI™ vs. VSMI™ 1 year

smi vs vsmi

The VSMI™ Index is calculated since 2005. It shows the volatility of the stocks within the SMI™ index. A portfolio which reacts only to changes in volatility instead of volatility itself is relevant for the calculation. Thereby, the VSMI™ methodology uses the squared volatility, known as variance, of the SMI options with remaining time to expiry of 30 days traded at the Eurex.

Source: UBS AG, Bloomberg

As of: 19.10.2018

BMW & Tesla
Premium manufacturers revved up

The automotive industry is currently being hit from all sides. In addition to international risks as a result of the customs conflict and Brexit, regulators are also exerting pressure on manufacturers with new exhaust emission tests. Although day-to-day business is consequently suffering, the companies are not losing sight of their future opportunities. BMW made a massive statement of intent recently. The German firm was the first foreign car company to succeed in acquiring a majority stake in a Chinese joint venture. In contrast, Tesla is making headlines in the US thanks to its rising production figures. From July to September, 53,239 bodies of the Model 3 cars on which the company has pinned its hopes rolled off the production line – more than twice as many as in the second quarter. UBS is now packaging the two premium manufacturers into a Callable Worst of Kick-In GOAL (symbol: KCRQDU), offering amazing conditions. The barrier stands at 50% of the initial price and the coupon totals 20% p.a.

The charismatic boss of the electric car pioneer Tesla is always good for a surprise. Elon Musk is currently trying to retrofit the on-board computer in the Tesla to include a video game console. Although this is still a long way off from bearing fruit, investors are eagerly awaiting the figures for the third quarter. After a weak first half-year, Musk had promised “sustainably profitable” work from now on. Tesla will publish its interim report on October 30. Although remaining in the black is no problem for competitor BMW, the Munich-based company did scare off investors with a profit warning. Nevertheless, the car company has decided not to stick its head in the sand, but continue to put the pedal to the metal instead. For example, BMW is increasing its stake in the joint venture with its Chinese partner Brilliance by 25% to 75%, paying EUR 3.6 billion in return. We expect to be able to fully consolidate BMW Brilliance Automotive in the balance sheet from 2022 onwards,” said BMW CEO Harald Krüger. (Source: Thomson Reuters media report, October 11, 2018)

Opportunities: BMW and Tesla don’t have to switch to the fast lane for the new Callable Worst of Kick-In GOAL (symbol: KCRQDU) to be profitable. On the contrary: The two automotive equities have a downward margin of 50% before the brakes are put on the potential maximum return of 20% p.a. The maximum term of one year can be shortened by a maximum of half a year due to the callable function.

Risks: This product does not have capital protection. If the underlyings touch or fall below the respective Kick-In Level (barrier) and the callable feature does not apply, the amount repaid on the maturity date is reflecting the worst performance of the underlyings (but not more than notional value plus coupon). In this case, it is likely that losses will be incurred. Investors in structured products are also exposed to issuer risk, which means that the capital invested may be lost if UBS AG becomes insolvent, regardless of the performance of the underlying.

More UBS products and further information on the risks and opportunities are available at ubs.com/keyinvest.

BMW vs. Tesla
(5 years; for illustrative purposes only; figures in %)¹

bmw

Source: UBS AG, Bloomberg

As of: 19.10.2018

20.00% p.a. Callable Worst of Kick-In GOAL on BMW and Tesla

Symbol KCRQDU
SVSP Name Barrier Reverse Convertible
SPVSP Code 1230, Callable
Underlyings BMW, Tesla
Currency EUR (Quanto)
Coupon 20.00% p.a.
Kick-In Level 50.00%
Expiry 24.10.2019
Issuer UBS AG, London
Subscription until 24.10.2018
 

More UBS products and further information on the risks and opportunities are available at ubs.com/keyinvest.

Source: UBS AG, Bloomberg

As of: 19.10.2018

¹) Please be aware that past performance does not indicate future results.
²) The conditions of ETTs are reviewed on a yearly basis and can be adjusted with a deadline of 13 months after the announcement.

This material has been prepared by UBS AG or one of its affiliates («UBS»). This material is for distribution only as permitted by law. It is not prepared for the needs of any specific recipient. It is published solely for information and is not a solicitation or offer to buy or sell any securities or related financial instruments (“Instruments”). UBS makes no representation or warranty, either express or implied, on the completeness or reliability of the information contained in this document (“Information”) except that concerning UBS AG and its affiliates. The Information should not be regarded by recipients as a substitute for using their own judgment. Any opinions expressed in this material may change without notice and may be contrary to opinions expressed by other business areas of UBS as a result of using different assumptions or criteria. UBS is under no obligation to update the Information. UBS, its officers, employees or clients may have or have had an interest in the Instruments and may at any time transact in them. UBS may have or have had a relationship with entities referred to in the Information. Neither UBS nor any of its affiliates, or their officers or employees, accepts any liability for any loss arising from use of the Information. This presentation is not a basis for entering into a transaction. Any transaction between you and UBS will be subject to the detailed provisions of the term sheet, confirmation or electronic matching systems relating to that transaction. Clients wishing to effect transactions should contact their local sales representative.
This information is communicated by UBS AG and/or its affiliates («UBS»). * (see below) UBS may from time to time, as principal or agent, have positions in, or may buy or sell, or make a market in any securities, currencies, financial instruments or other assets underlying the product to which this website relates (the «Structured Product»). UBS may provide investment banking and other services to and/or have officers who serve as directors of the companies referred to in this website. UBS’s trading and/or hedging activities related to the Structured Product may have an impact on the price of the underlying asset and may affect the likelihood that any relevant barrier or relevant trigger event is crossed or triggered. UBS has policies and procedures designed to minimise the risk that officers and employees are influenced by any conflicting interest or duty and that confidential information is improperly disclosed or made available. UBS may pay or receive brokerage or retrocession fees in connection with the Structured Product described herein. In respect of any Structured Product that is a security, UBS may, in certain circumstances, sell the Structured Product to dealers and other financial institutions at a discount to the issue price or rebate to them for their own account some proportion of the issue price. Further information is available on request. Structured Products are complex and may involve a high risk of loss. Prior to purchasing the Structured Product you should consult with your own legal, regulatory, tax, financial and accounting advisors to the extent you consider it necessary, and make your own investment, hedging and trading decisions (including decisions regarding the suitability of the Structured Product) based upon your own judgement and advice from those advisers you consider necessary. Save as otherwise expressly agreed in writing, UBS is not acting as your financial adviser or fiduciary in relation to the Product. UBS generally hedges its exposure to Structured Products, although it may elect not to hedge or to partially hedge any Structured Product. UBS’s hedging activity may be conducted through transactions in the underlying asset, index or instrument or in options, futures or other derivatives related to the underlying asset, index or instrument on publicly traded markets or otherwise, and may have an impact on the price of the under-lying asset. If a transaction is cash settled, UBS will generally unwind or offset any hedge it has for such Structured Product in close proximity to the relevant valuation time or period. In some cases, this activity may affect the value of the Structured Product. Unless stated otherwise in this document, (i) this document is for information purposes only and should not be construed as an offer, personal recommendation or solicitation to purchase the Structured Product and should not be treated as giving investment advice, and (ii) the terms of any investment in the Structured Product will be exclusively subject to the detailed provisions, including risk considerations, contained in the more detailed legal documentation that relates to the Structured Product (being the confirmation, information memorandum, prospectus or other issuer documentation as relevant). UBS makes no representation or warranty relating to any information herein which is derived from independent sources. This document shall not be copied or reproduced without UBS’s prior written permission. In respect of any Structured Product that is a security, no action has been or will be taken in any jurisdiction that would permit a public offering of the Product, save where explicitly stated in the issuer documentation. The Structured Product must be sold in accordance with all applicable selling restrictions in the jurisdictions in which it is sold.
© UBS 2018. All rights reserved. UBS prohibits the forwarding of this information without the approval of UBS.
Weekly-Hits edition of 19.10.20182018-10-19T09:14:50+02:00

Gold: Verschmähtes Edelmetall mit Comeback-Chancen

KeyInvest Blog

Montag, 08. Oktober 2018

Gold: Verschmähtes Edelmetall mit Comeback-Chancen

Die globalen Auseinandersetzungen nehmen zu und dennoch lassen Anleger die Krisenwährung links liegen. Ein Hauptbelastungsfaktor der Goldschwäche ist der starke US-Dollar. Doch könnte die Stimmung schon bald drehen und dem Edelmetall wieder glanzvolle Zeiten bescheren.

Die Welt ist in Aufruhr: Die politischen und wirtschaftlichen Entwicklungen zeigen, dass die internationalen Kapitalmärkte mit steigenden Risikofaktoren konfrontiert werden. Auf der einen Seite herrschen Krisen in Schwellenländern wie der Türkei und Argentinien, die einen Flächenbrand in den Emerging Markets auslösen könnten. Auf der anderen Seite stehen die Handelskonflikte zwischen den USA und Europa, China sowie Japan. Dazu kommt noch das zehnjährige Jubiläum der Lehman-Krise am 15. September, welche Anleger wieder schmerzlich daran erinnert, dass Aktienkurse auch fallen können.

Spielball der Währungen

Angesichts dieser Gemengelage wäre es nicht verwunderlich, wenn Gold eine wahre Renaissance erleben würde. Doch das Gegenteil ist der Fall: Die Krisenwährung notiert seit Jahresbeginn mit einem Minus von 8.5 Prozent (Stand: 05.09.2018) deutlich im negativen Bereich. Im April setzte die Abwärtsbewegung bei Kursen oberhalb der 1’300er-Marke ein, Mitte August tauchte das Edelmetall dann sogar erstmals seit 15 Monaten unter 1’200 US-Dollar. Ein entscheidender Richtungsgeber für den Goldpreis ist die Währungsentwicklung. Der US-Dollar-Index, der die Stärke des Greenbacks gegenüber seinen sechs wichtigsten Rivalen darstellt, markierte zuletzt den höchsten Stand seit Mitte 2017.* Angesichts der Stärke des US-Dollar haben die Experten von UBS CIO GWM ihre Dreimonats-Handelsspanne für Gold im August auf 1,125 – 1,240 US-Dollar pro Unze reduziert. Das Aufwärtspotenzial wurde zudem auf Sicht von sechs und zwölf Monaten auf 1’250 respektive 1’300 US-Dollar pro Unze gesenkt (Quelle: CIO GWM Research, «Gold: Asien ist zurück», 21.09.2018).

Neben den Währungen drückten zuletzt auch vermehrt spekulative Verkäufe auf den Goldkurs. Zudem mussten die Investoren ihre US-Dollar-Engagements weniger absichern, da sich die US-Aktienmärkte auf Rekordhöhen bewegen. «Die niedrige Marktvolatilität des US-Marktes hat renditestarke US-Dollar-Anlagen besonders attraktiv gemacht, was die Goldabflüsse von ETFs und Spekulanten-Konten bestätigen», konstatieren die Analysten von UBS CIO GWM Research. (Quelle: CIO GWM Research, «Gold: Zeit zum umdenken», 17.08.2018)

Goldene Zeiten

Wie lange die Währungsrallye noch anhalten wird, ist fraglich. Zwar spricht der Zinsvorsprung für den US-Dollar, doch könnte nur eine geringe Abweichung der US-Notenbank Fed von ihrem geldpolitischen Kurs die Devise ausbremsen. Dass dies nicht komplett abwegig ist, machte Donald Trump jüngst klar. Der amerikanische Präsident attackierte den von ihm ernannten Fed-Chef Jerome Powell. Er sieht nämlich durch eine weitere Straffung der Leitsätze die Wirtschaftsentwicklung gefährdet. Er sei «nicht begeistert» über dessen Zinserhöhungen, kritisierte Trump in einem Interview mit der Nachrichtenagentur Reuters Mitte August.

Für einen Abgesang auf Gold könnte es also zu früh sein. Eventuell steht sogar ein Comeback an. Nach einer technisch überverkauften Lage sind starke Gegenbewegungen keine Seltenheit. Im Bereich von 1’125 US-Dollar pro Unze befindet sich zudem eine Unterstützungsmarke, die auf Ende 2016 zurückgeht. Darüber hinaus ist Gold weiterhin ein adäquates Instrument für die Portfoliodiversifizierung. Und sollten sich die eingangs skizzierten Krisen rund um den Erdball weiter verschärfen, könnten wieder mehr Anleger den «sicheren Hafen» ansteuern.

Grund zum Optimismus

Grundsätzlich erachtet es Haefele jedoch als wichtig, investiert zu bleiben. Er hält es für durchaus möglich, dass sich jüngsten Zollandrohungen als Verhandlungstaktik erweisen. Wäre diese der Fall, blieben die Aussichten freundlich. In der Vergangenheit war es dem CIO zufolge eher falsch, zu vorsichtig als zu optimistisch zu agieren. Marc Haefele begründet diese These mit der historischen Entwicklung des S&PTM 500: In der Nachkriegszeit hat der US-Leitindex in Zeiträumen von sechs Monaten 2.3 Mal häufiger positive als negative Renditen erzielt. Bei einem Betrachtungszeitraum von fünf Jahren lag die entsprechende Quote sogar bei 5.8. (Quelle: UBS House View Monthly Letter, 19.07.2018)

Alles in allem käme es für Investoren nun zunächst darauf an, kein übermässiges Risiko einzugehen und sich auf das kurzfristige Abwärtspotenzial vorzubereiten. Haefele sieht verschiedene Möglichkeiten, mit denen sich Anleger für Portfoliowachstum positionieren, aber auch die kurzfristigen Risiken begrenzen können: Dazu zählt er beispielsweise die Beimischung von alternativen Anlagen wie Hedge Funds oder die Diversifikation über Länder und Sektoren. Als weiteres Instrument nennt der Kapitalmarktprofi die Anlage in Vermögenswerten, die von langfristigen Trends profitieren. Vor allem Aktien aus den Bereichen E-Commerce und Software haben zuletzt eine Outperformance erwirtschaft. Dahinter verbergen sich häufig Geschäftsmodelle, die von strukturellen Entwicklungen wie Bevölkerungswachstum und -alterung sowie Urbanisierung profitieren. Haefele hält solche Unternehmen für besser positioniert, um den Wachstums- und Handelssorgen standzuhalten, als stärker vom Konjunkturzyklus abhängige Gesellschaften. (Quelle: UBS House View Monthly Letter, 19.07.2018)

Entwicklung des Goldpreises in den letzten 5 Jahren (in USD)

keyinvest blog chart

Quelle: Bloomberg, UBS. Zeitraum: 09.10.2013 bis 08.10.2018.*

* Bitte beachten Sie, dass vergangene Wertentwicklungen keine Indikationen für künftige Wertentwicklungen sind.

Weitere Blogeinträge:

Emsige Betriebsamkeit an den Märkten

Am Sonntag läutete der erste Advent die eigentlich ruhige und besinnliche Zeit des Jahres ein. Doch von Ruhe können Börsianer nur träumen, viel zu viele bewegende Ereignisse prasseln derzeit auf die Märkte ein.

Entflechtung in Basel

Follow us on LinkedIn 22. November 2021 Entflechtung in Basel Die Gewinnserie beim SMI® Index hat gehalten. Der heimische Benchmark konnte die siebte Handelswoche nacheinander mit positiven [...]

Der Greenback hebt ab

Das Börsenjahr 2021 geht auf die Zielgerade. Ab diesem Montag sind es nur noch sieben Handelswochen, ehe die Schlussglocke ertönt respektive Sylvester im Kalender steht.

Ein starker Monatsauftakt

Der US-Arbeitsmarkt macht weiter Boden gut – das ist die zentrale Aussage des am vergangenen Freitag publizierten „Nonfarm Payroll“-Reports.

Gold: Verschmähtes Edelmetall mit Comeback-Chancen2018-10-25T07:51:22+02:00
Go to Top