About ubs-ch

This author has not yet filled in any details.
So far ubs-ch has created 384 blog entries.

Weekly-Hits édition de 12.10.2018

KeyInvest Weekly Hits

Vendredi, 12.10.2018

  • Thème 1: Criminalité sur Internet - En toute sécurité sur l’autoroute des données
  • Thème 2: Technique médicale - Un secteur en plein essor

Criminalité sur Internet
En toute sécurité sur l’autoroute des données

Les attaques de pirates informatiques font actuellement la une des journaux. Par exemple, la Grande-Bretagne accuse la Russie d’être responsable de cyberattaques contre des institutions politiques. (Source : Thomson Reuters, article de presse, 04.10.2018). En plus, un scandale lié à des données volées sur Facebook fait sensation : selon le groupe américain, les pirates ont utilisé une brèche de sécurité pour espionner quelque 50 millions de profils. (Source : https://newsroom.fb.com/news/2018/09/security-update/). Ces exemples montrent bien qu’il faut toujours améliorer et renforcer les mécanismes de protection. En conséquence, la demande de prestations de sécurité informatique devrait rester forte à l’avenir, qu’elle provienne des utilisateurs privés, des entreprises ou même des Etats. Cette tendance de long terme pourrait aussi convenir pour des placements de capitaux. L’Open End PERLES sur l’indice Solactive Global Cyber Security permet d’investir simplement et à bon compte dans ce secteur. Les produits négociés en francs suisses (symbole : KCFJDU) et dollar US (symbole : KCFKDU) sont soumis à une commission de gestion de 0.75% p.a.

L’exemple de Siemens montre de manière impressionnante l’importance de la cybersécurité. 1275 collaborateurs sont responsables de la sécurité informatique du groupe industriel. Et ils ne chôment pas, puisque Siemens enregistre quelque 1000 attaques par jour. On comprend très vite que la sécurité informatique est un marché global portant sur des milliards. Selon le rapport « Cybersecurity Market by Solution », les dépenses mondiales dans ce domaine atteindront pour l’année en cours un volume de 152.71 milliards de dollars US. Et la tendance est à la hausse. En 2023, on estime que le marché s’établira à 248.26 milliards de dollars US, ce qui correspond à un taux de croissance annuelle moyen de 10.2% entre 2018 et 2023. Outre les attaques de pirates informatiques toujours plus fréquentes, le durcissement des directives relatives à la protection des données constitue le moteur principal de cette évolution. (Source : MarketsandMarktes, septembre 2018). La sécurité sur Internet est un vaste domaine. Le cryptage, les antivirus, les pare-feu ou la récupération des données ne sont que quelques secteurs parmi d’autres auxquels les entreprises de sécurité informatique doivent s’intéresser. Il pourrait donc être judicieux d’investir de manière diversifiée dans cette tendance de croissance. L’indice Solactive Global Cyber Security contient au total 14 entreprises de sécurité internationales qui sont toutes des spécialistes dans leurs domaines. Si, par exemple, le Japonais Trend Micro est surtout connu pour ses logiciels antivirus, la société israélienne Check Point Software se distingue par ses produits pare-feu et VPN. Fortinet est actuellement un poids lourd de l’indice. L’entreprise a même créé une filiale indépendante spécialisée dans les produits de cybersécurité pour les autorités gouvernementales l’année dernière a été récemment adoubée par le fournisseur d’indices S&P Dow Jones. A partir du 11 octobre 2018, Fortinet remplacera l’action d’Envision Healthcare Corp. Dans le S&P 500™. Une forte progression du cours a précédé cette « promotion ». La valeur en bourse de Fortinet a même progressé de 113% en un an.¹

Opportunités: la courbe de cours de l’indice Solactive Global Cyber Security est également en forte hausse. Si le baromètre a dû payer son tribut à la récente faiblesse du marché, l’indice a atteint mi-septembre un nouveau record. Depuis Nouvel an, la hausse se résume à 21.4%.¹ L’Open End PERLES en francs suisses (symbole : KCFJDU) et en dollars US (symbole : KCFKDU) permet aux investisseurs d’accéder facilement aux entreprises proposant des solutions de sécurité informatique prometteuses. Les produits participent à l’identique l’évolution de l’indice Solactive Global Cyber Security NTR. Une commission de gestion de 0.75% est due, et les dividendes nets versés aux membres sont réinvestis.

Risques: il n’existe aucune protection du capital pour les produits présentés. Une évolution négative de la valeur de base génère des pertes correspondantes pour l’Open End PERLES. Il faut également prendre en compte le risque de change, car la monnaie dans laquelle les produits sont négociés peut être différente de celle des membres de l’indice. Par ailleurs, avec les produits structurés, l’investisseur supporte le risque d’émetteur. Cela signifie qu’en cas d’insolvabilité d’UBS SA, le capital investi peut être perdu, indépendamment de l’évolution du sous-jacent.

Vous trouverez davantage de produits UBS et des informations sur les opportunités et les risques à l’adresse ubs.com/keyinvest.

Indice Solactive Global Cyber Security USD NTR depuis le 18.10.2013 (jour du lancement)¹

solactive

Le secteur de la sécurité informatique bénéficie de la hausse des dépenses de sécurité. Ceci apparaît nettement dans l’indice Solactive Global Cyber Security qui a réalisé un rendement moyen de 19.9% depuis sa création.

Source: UBS AG, Bloomberg

Valeurs du: 10.10.2018

Check Point Software vs. Fortinet vs. F5 Networks (5 ans)¹
(Aux fins d’illustration uniquement, données en %)

Check Point Software, Fortinet et F5 Networks, les poids lourds actuels de l’indice Solactive Global Cyber Security, affichent de nettes progressions sur cinq ans. Fortinet a même été multiplié par plus de quatre.

Source: UBS AG, Bloomberg

Valeurs du: 10.10.2018

¹) La performance passée n’indique pas les résultats futures.
²) Les condition des ETTs sont vérifiés annuellement et peuvent être ajustées avec un délai de 13 mois après la publication.

Open End PERLES sur Solactive Global Cyber Security NTR Index (CHF)

Symbol KCFJDU
SVSP Name Tracker certificat
SPVSP Code 1300
Sous-jacent Solactive Global Cyber Security USD NTR Index
Rapport de souscription 1:1
Devise CHF
Frais de gestion 0.75% p.a.
Participation 100%
Echéance Open End
Émetteur UBS AG, London
Bid/Ask CHF 200.10 / 202.20
 

Open End PERLES sur Solactive Global Cyber Security NTR Index (USD)

Symbol KCFKDU
SVSP Name Tracker certificat
SPVSP Code 1300
Sous-jacent Solactive Global Cyber Security USD NTR Index
Rapport de souscription 1:1
Devise USD
Frais de gestion 0.75% p.a.
Participation 100%
Echéance Open End
Émetteur UBS AG, London
Bid/Ask USD 202.00 /204.00
 

Vous trouverez davantage de produits UBS et des informations sur les opportunités et les risques à l’adresse ubs.com/keyinvest.

Source: UBS AG, Bloomberg

Valeurs du: 10.10.2018

Apérçu du marché

Index Citation Semaine¹
SMI™ 8’892.88 -3.1%
SLI™ 1’416.66 -4.8%
S&P 500™ 2’785.68 -4.8%
Euro STOXX 50™ 3’266.90 -4.1%
S&P™ BRIC 40 3’829.43 -4.9%
CMCI™ Compos. 963.86 -1.4%
Gold (once troy) 1’193.40 -1.4%

¹ Changement basé sur le cours de clôture du jour précédent par rapport au cours de clôture de la semaine dernière.

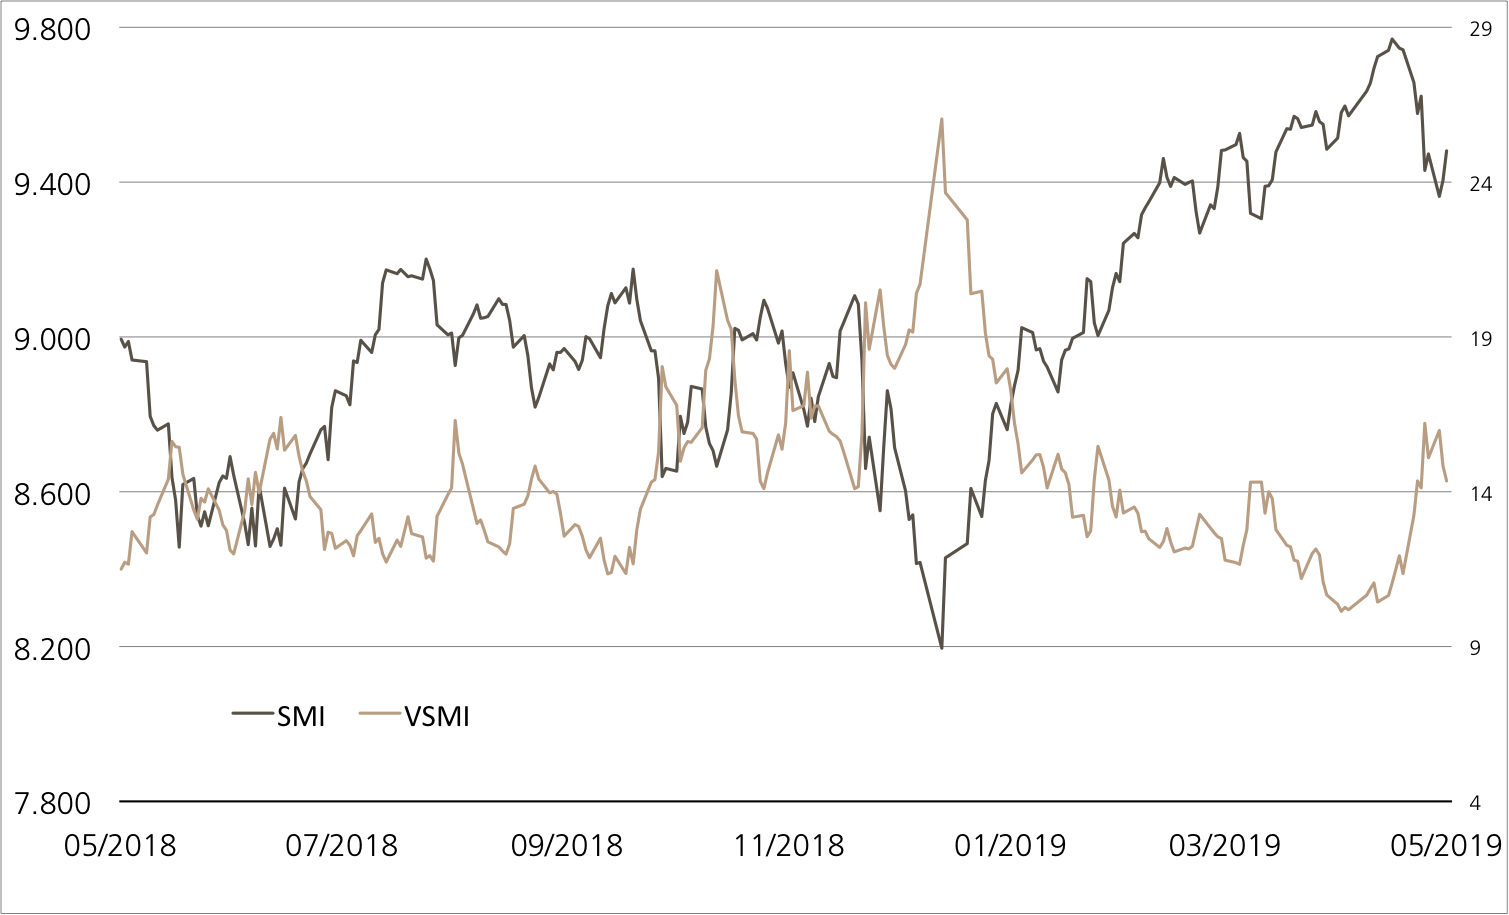
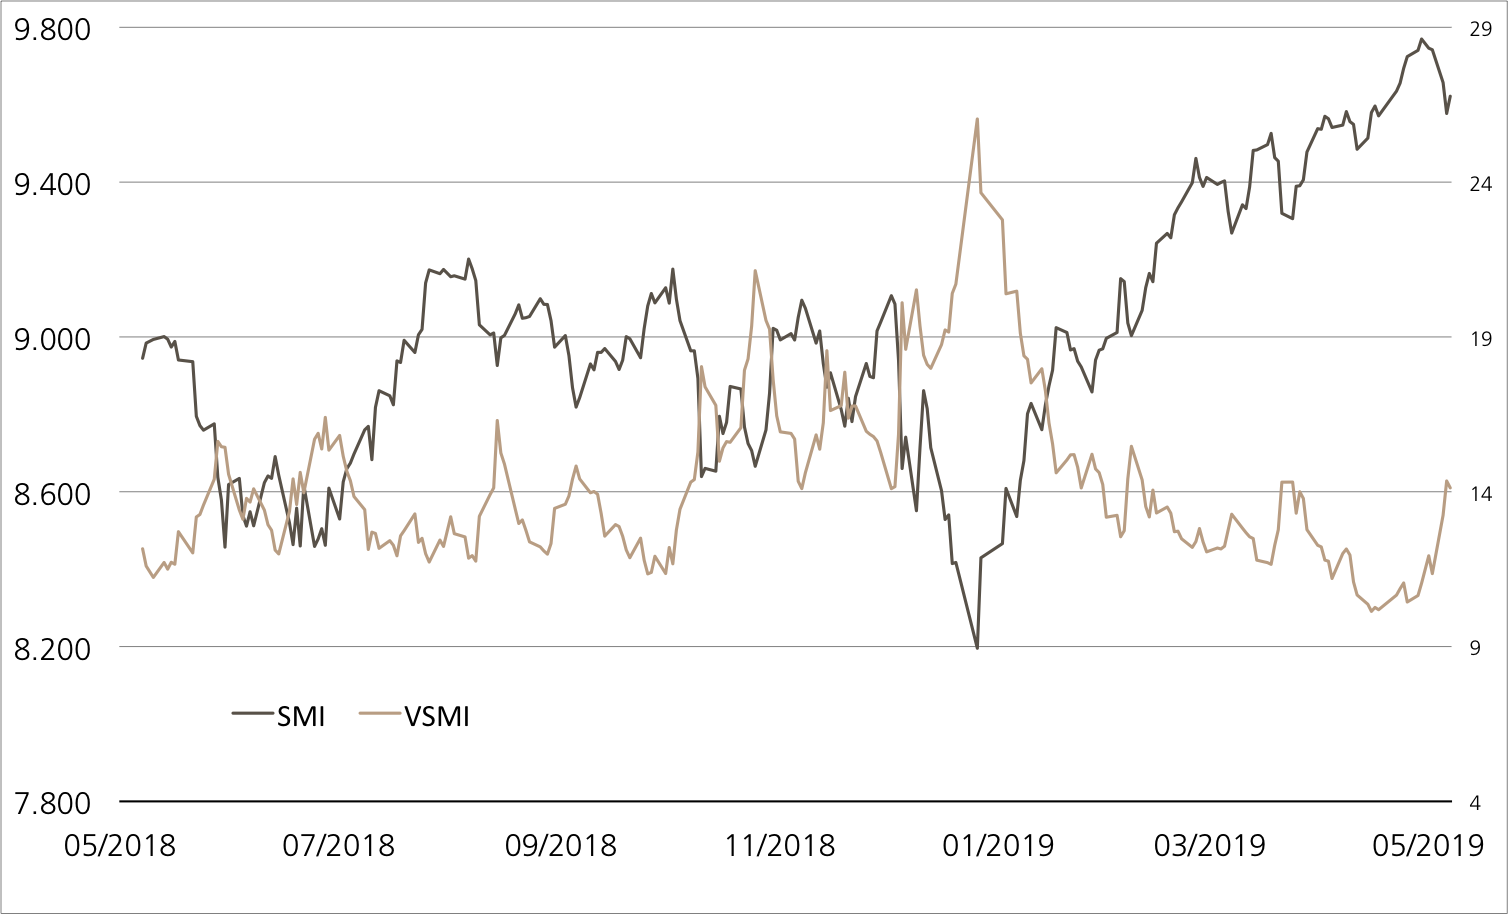
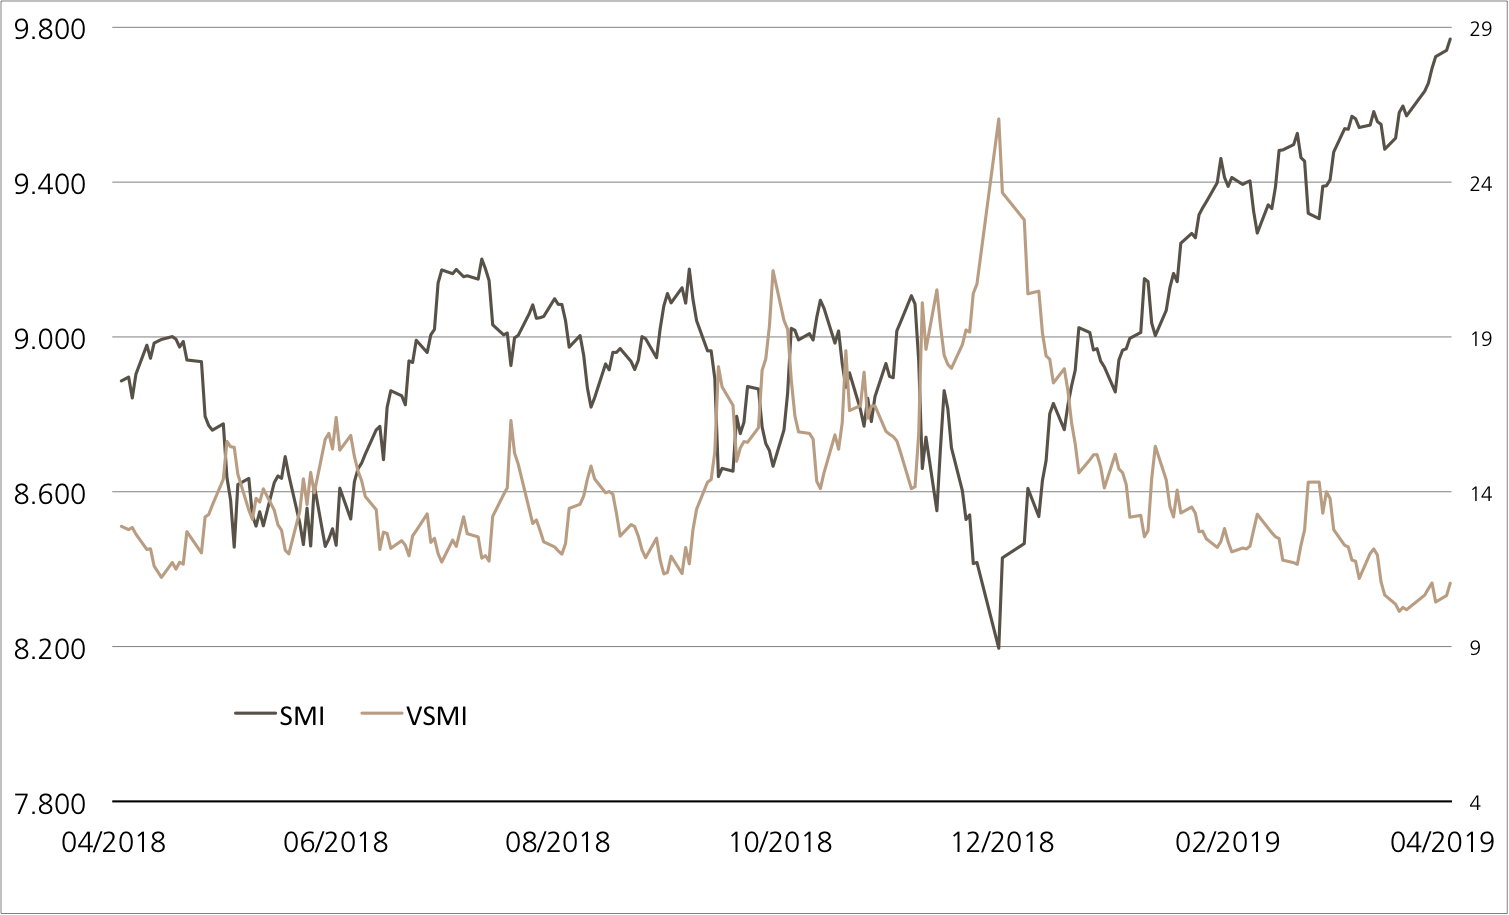
SMI™ vs. VSMI™ 1 année
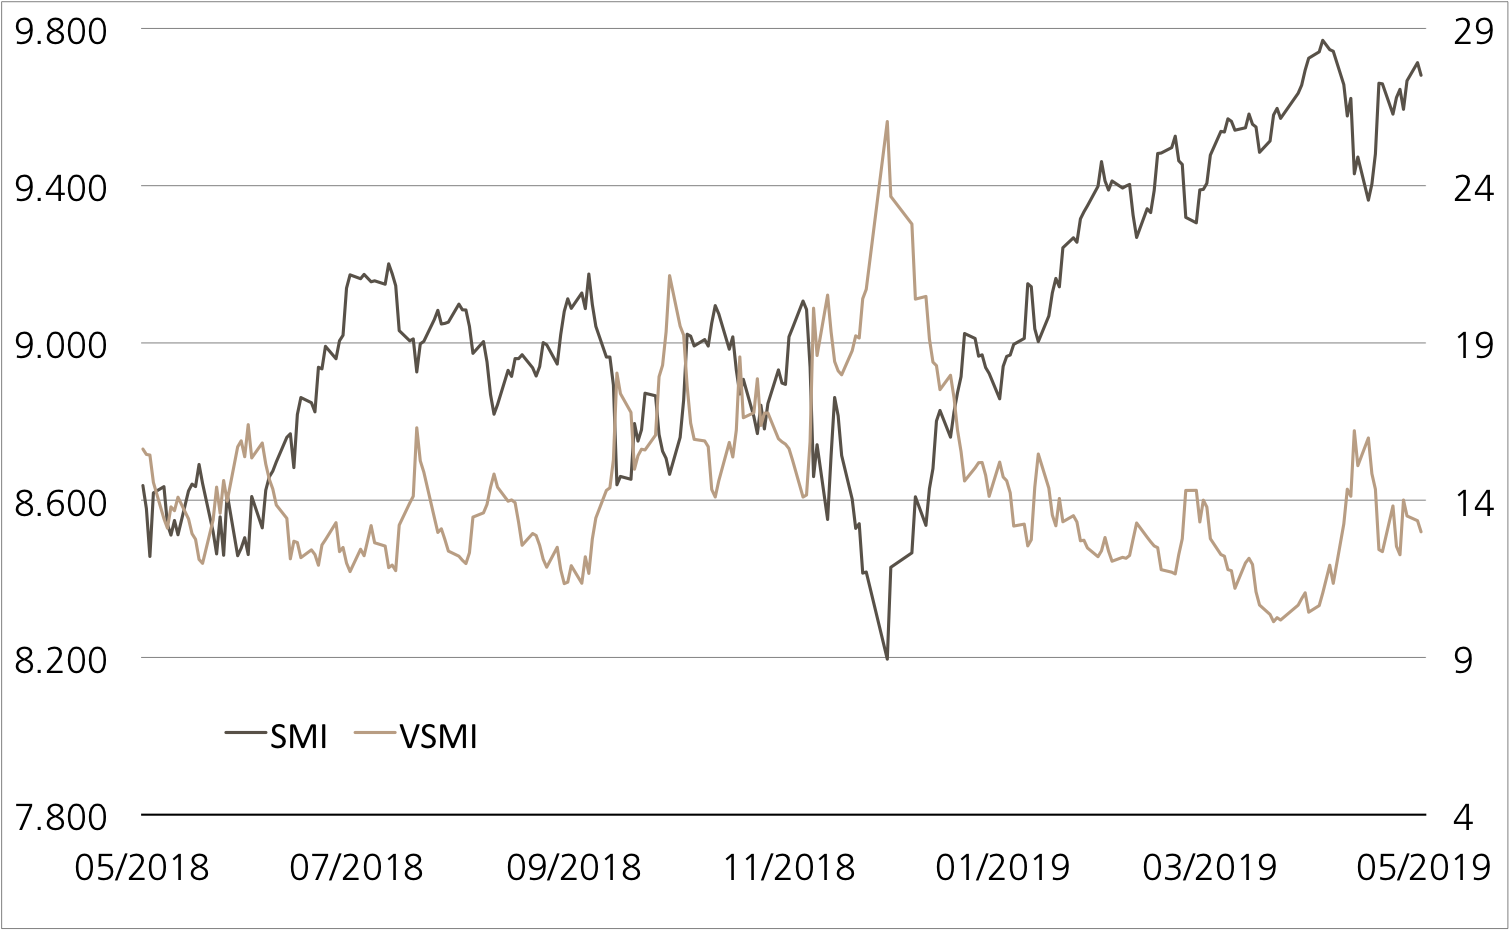
L’index VSMI™ est calculé depuis 2005. Il affiche la volatilité des actions inclus dans le SMI™ index. Pour la calculation, un portefeuille est utilisé qui ne réagit qu’au variations de la volatilité au lieu des variations des prix. En le faisant, la méthodologie du VSMI™ utilise la volatilité carré, connu sous le terme variance, des options sur le SMI avec 30 jours jusqu’à l’échéance négociées à la Bourse Eurex.

Source: UBS AG, Bloomberg

Valeurs du: 10.10.2018

Technique médicale

Un secteur en plein essor

Agitation sur le marché des aides auditives : la société américaine Bose connue pour ses haut-parleurs s’est vu accorder l’autorisation pour un appareil auditif par la FDA (autorité sanitaire américaine). Les personnes souffrant de pertes auditives légères à moyennes peuvent l’adapter à leurs besoins. Le renforcement de la concurrence a mis la pression sur les actions de la société suisse Sonova. Après l’annonce, les titres ont perdu environ dix pour cent de leur valeur. Il en est allé de même pour la société de technique médicale Straumann¹ en raison notamment d’annonces de résultats faibles dans le secteur. Stratec Biomedical a ainsi surpris avec un avertissement sur les bénéfices. A vu du niveau de cours désormais modéré de Sonova et Straumann, un produit avec protection partielle sur ce duo pourrait être intéressant. Dans ce contexte, l’Early Redemption (ER) Worst of Kick-In GOAL en souscription (symbole : KCQVDU) offre des conditions attrayantes : Si la barrière de 69% des cours initiaux reste intacte, le produit générera dans un an le montant maximum de 12 % par an.

Deux facteurs doivent être pris en compte si l’on considère la faiblesse actuelle du cours de Sonova : tout d’abord, le groupe a lancé le 10 octobre son vaste programme de rachat d’actions. Le fabricant d’aides auditives envisage d’y consacrer jusqu’à 1.5 milliard de francs. De plus, le 16 octobre sera un jour important pour les investisseurs. Les acteurs du marché espèrent que, lors de la réunion, Sonova annoncera un nouvel appareil auditif qui fera de l’ombre aux produits de la concurrence. Pour Straumann, la fin octobre sera passionnante. C’est là que le spécialiste des implants présentera ses résultats du troisième trimestre. Les résultats semestriels avaient surpris positivement : la direction a renforcé ses prévisions de croissance organique en 2018 à environ 15%.

Opportunités: des avancées de cours pour les deux actions de technique médicale présentées ne sont pas nécessaires pour que le nouveau ER Worst of Kick-In GOAL (symbole : KCQVDU) produise le rendement maximal de 5%. Il faut seulement qu’aucun titre n’atteigne ou ne passe en-dessous de la barrière de 69% du niveau initial pendant la période de 18 mois. Avec la fonction « Early Redemption », le montant maximal peut toutefois être atteint plus tôt. Il faut pour cela que Sonova et Straumann atteignent ou dépassent ensemble le cours initial à l’un des jours d’observation trimestriel (première observation : 24.10.2019).

Risques: il n’existe aucune protection du capital pour le produit présenté. Si, pendant la durée de l’investissement, l’un des sous-jacents atteint une seule fois la barrière respective («Kick-In Level») ou est inférieur à celle-ci, et que la fonction de remboursement anticipé ne s’applique pas, le remboursement par amortissement en espèces à l’échéance est basé sur la performance la plus faible (base Strike) du duo (au maximum toutefois à la valeur nominale majorée du coupon). Dans un tel cas, des pertes sont probables. Par ailleurs, avec les produits structurés, l’investisseur supporte le risque d’émetteur. Cela signifie qu’en cas d’insolvabilité d’UBS SA, le capital investi peut être perdu, indépendamment de l’évolution des sous-jacents.

Vous trouverez davantage de produits UBS et des informations sur les opportunités et les risques à l’adresse ubs.com/keyinvest.

Sonova vs. Straumann (5 ans)¹
(Aux fins d’illustration uniquement, données en %)

Source: UBS AG, Bloomberg

Valeurs du: 10.10.2018

5.00% p.a. ER Worst of Kick-In GOAL sur Sonova / Straumann

Symbol KCQVDU
SVSP Name Barrier Reverse Convertible
SPVSP Code 1230 (Auto-Callable)
Sous-jacent Sonova, Straumann
Devise CHF
Coupon 5.00% p.a.
Kick-In Level 69.00%
Echéance 23.04.2020
Émetteur UBS AG, London
Date de fixation du prix 24.10.2018, 15:00 h
 

Vous trouverez davantage de produits UBS et des informations sur les opportunités et les risques à l’adresse ubs.com/keyinvest.

Source: UBS AG, Bloomberg

Valeurs du: 10.10.2018

¹) La performance passée n’indique pas les résultats futures.
²) Les condition des ETTs sont vérifiés annuellement et peuvent être ajustées avec un délai de 13 mois après la publication.

This material has been prepared by UBS AG or one of its affiliates («UBS»). This material is for distribution only as permitted by law. It is not prepared for the needs of any specific recipient. It is published solely for information and is not a solicitation or offer to buy or sell any securities or related financial instruments (“Instruments”). UBS makes no representation or warranty, either express or implied, on the completeness or reliability of the information contained in this document (“Information”) except that concerning UBS AG and its affiliates. The Information should not be regarded by recipients as a substitute for using their own judgment. Any opinions expressed in this material may change without notice and may be contrary to opinions expressed by other business areas of UBS as a result of using different assumptions or criteria. UBS is under no obligation to update the Information. UBS, its officers, employees or clients may have or have had an interest in the Instruments and may at any time transact in them. UBS may have or have had a relationship with entities referred to in the Information. Neither UBS nor any of its affiliates, or their officers or employees, accepts any liability for any loss arising from use of the Information. This presentation is not a basis for entering into a transaction. Any transaction between you and UBS will be subject to the detailed provisions of the term sheet, confirmation or electronic matching systems relating to that transaction. Clients wishing to effect transactions should contact their local sales representative.
This information is communicated by UBS AG and/or its affiliates («UBS»). * (see below) UBS may from time to time, as principal or agent, have positions in, or may buy or sell, or make a market in any securities, currencies, financial instruments or other assets underlying the product to which this website relates (the «Structured Product»). UBS may provide investment banking and other services to and/or have officers who serve as directors of the companies referred to in this website. UBS’s trading and/or hedging activities related to the Structured Product may have an impact on the price of the underlying asset and may affect the likelihood that any relevant barrier or relevant trigger event is crossed or triggered. UBS has policies and procedures designed to minimise the risk that officers and employees are influenced by any conflicting interest or duty and that confidential information is improperly disclosed or made available. UBS may pay or receive brokerage or retrocession fees in connection with the Structured Product described herein. In respect of any Structured Product that is a security, UBS may, in certain circumstances, sell the Structured Product to dealers and other financial institutions at a discount to the issue price or rebate to them for their own account some proportion of the issue price. Further information is available on request. Structured Products are complex and may involve a high risk of loss. Prior to purchasing the Structured Product you should consult with your own legal, regulatory, tax, financial and accounting advisors to the extent you consider it necessary, and make your own investment, hedging and trading decisions (including decisions regarding the suitability of the Structured Product) based upon your own judgement and advice from those advisers you consider necessary. Save as otherwise expressly agreed in writing, UBS is not acting as your financial adviser or fiduciary in relation to the Product. UBS generally hedges its exposure to Structured Products, although it may elect not to hedge or to partially hedge any Structured Product. UBS’s hedging activity may be conducted through transactions in the underlying asset, index or instrument or in options, futures or other derivatives related to the underlying asset, index or instrument on publicly traded markets or otherwise, and may have an impact on the price of the under-lying asset. If a transaction is cash settled, UBS will generally unwind or offset any hedge it has for such Structured Product in close proximity to the relevant valuation time or period. In some cases, this activity may affect the value of the Structured Product. Unless stated otherwise in this document, (i) this document is for information purposes only and should not be construed as an offer, personal recommendation or solicitation to purchase the Structured Product and should not be treated as giving investment advice, and (ii) the terms of any investment in the Structured Product will be exclusively subject to the detailed provisions, including risk considerations, contained in the more detailed legal documentation that relates to the Structured Product (being the confirmation, information memorandum, prospectus or other issuer documentation as relevant). UBS makes no representation or warranty relating to any information herein which is derived from independent sources. This document shall not be copied or reproduced without UBS’s prior written permission. In respect of any Structured Product that is a security, no action has been or will be taken in any jurisdiction that would permit a public offering of the Product, save where explicitly stated in the issuer documentation. The Structured Product must be sold in accordance with all applicable selling restrictions in the jurisdictions in which it is sold.
© UBS 2018. All rights reserved. UBS prohibits the forwarding of this information without the approval of UBS.
Weekly-Hits édition de 12.10.20182018-10-12T07:59:45+02:00

Weekly-Hits edition of 12.10.2018

KeyInvest Weekly Hits

Friday, 12.10.2018

  • Topic 1: Cybercrime - Security on the information superhighway
  • Topic 2: Medical technology - A sector in upheaval

Cybercrime
Security on the information superhighway

Hacker attacks are currently a hot topic in the media. For example, the UK is accusing Russia of being responsible for cyber attacks made against political institutions. (Source: Thomson Reuters media report, October 10, 2018) A data scandal on Facebook is also causing quite a stir. According to the US company, hackers exploited a breach in security, which enabled them to spy on approximately 50 million profiles (Source: https://newsroom.fb.com/news/2018/09/security-update/). These examples show that the protection mechanisms used need to be improved and become more effective. Consequently, the demand for IT security services – from private users and companies to entire countries – is likely to remain high in the future. This long-term trend could also be a good capital investment. The Open End PERLES on the Solactive Global Cyber Security Index make it easy and cost-effective to invest in the sector. The products, which can be traded in Swiss francs (symbol: KCFJDU) and US dollars (symbol: KCFKDU), have a management fee of 0.75% p.a.

Siemens is an impressive example of the significance of cybersecurity. A total of 1,275 employees are responsible for IT security at the industrial group. After all, Siemens records around 1,000 attacks a day. It is rapidly becoming clear that IT security is a global market worth billions. According to the «Cybersecurity Market by Solution» report, global spending in this area will reach a volume of USD 152.71 billion in the current year – and this figure is set to increase in the future. Estimates state that the market will grow to USD 248.26 billion by 2023, corresponding to an average annual growth rate of 10.2% between 2018 and 2023. The main drivers behind this are the increasing number of hacker attacks and stricter data protection guidelines. (Source: MarketsandMarktes, September 2018) Internet security is a wide-ranging field. Encryption, anti-virus protection, firewalls and data recovery are just a few of the areas that IT security companies need to address. It could therefore make sense to diversify your portfolio by investing in this growth trend. The Solactive Global Cyber Security Index includes a total of 14 international security companies, all of which are specialists in their fields. For example, Japanese company Trend Micro is best known for its antivirus software, while Israeli firm Check Point Software excels in firewall and VPN products. The current heavyweight in the index is Fortinet. The company, which last year even founded an independent subsidiary that focuses solely on cybersecurity products for government agencies, recently received a fillip from the index provider S&P Dow Jones. As of October 11, 2018, Fortinet replaced Envision Healthcare Corp. on the S&P 500™ indices. The “promotion” came as a result of a strong share price performance, as the market value of Fortinet increased by a huge 113% within the space of a year.¹

Opportunities: The price curve of the Solactive Global Cyber Security Index is likewise trending strongly upward. Although the barometer also paid the price for the recent market weakness, the index reached a new record high until mid-September. Positive growth of 21.4% has been recorded since the end of the year 2017.¹ The Open End PERLES in Swiss francs (symbol: KCFJDU) and US dollars (symbol: KCFKDU) give investors easy access to companies offering promising IT security solutions. The products track the performance of the Solactive Global Cyber Security NTR Index. Although there is an annual management fee of 0.75%, the net dividends distributed to members are reinvested.

Risks: The aforementioned products do not have capital protection. Should the underlying assets deliver a negative performance; the Open End PERLES will incur commensurate losses. The currency risk must also be taken into account, as the trading currency of the products may differ from the currencies of the index members. Investors in structured products are also exposed to issuer risk, which means that the capital invested may be lost if UBS AG becomes insolvent, regardless of the performance of the underlying.

More UBS products and further information on the risks and opportunities are available at ubs.com/keyinvest.

Solactive Global Cyber Security USD NTR Index since October 18, 2013 (launch day)¹

solactive

The IT security sector benefits from the increase in spending on security. This is impressively reflected in the Solactive Global Cyber Security Index, which has achieved an average return of 19.9% p.a. since its launch.

Source: UBS AG, Bloomberg

As of 10.10.2018

Check Point Software vs. Fortinet vs. F5 Networks (5 years) ¹
(for illustrative purposes only; figures in %)

The current heavyweights on the Solactive Global Cyber Security Index – Check Point Software, Fortinet and F5 Networks – are posting significant growth on a five-year basis. Fortinet has even recorded growth in excess of 400%.

Source: UBS AG, Bloomberg

As of: 10.10.2018

¹) Please be aware that past performance does not indicate future results.
²) The conditions of ETTs are reviewed on a yearly basis and can be adjusted with a deadline of 13 months after the announcement.

Open End PERLES on Solactive Global Cyber Security NTR Index (CHF)

Symbol KCFJDU
SVSP Name Tracker-Certificate
SPVSP Code 1300
Underlying Solactive Global Cyber Security USD NTR Index
Ratio 1:1
Currency CHF
Administration fee 0.75% p.a.
Participation 100%
Expiry Open End
Issuer UBS AG, London
Bid/Ask CHF 200.10 / 202.20
 

Open End PERLES on Solactive Global Cyber Security NTR Index (USD)

Symbol KCFKDU
SVSP Name Tracker-Certificate
SPVSP Code 1300
Underlying Solactive Global Cyber Security USD NTR Index
Ratio 1:1
Currency USD
Administration fee 0.75% p.a.
Participation 100%
Expiry Open End
Issuer UBS AG, London
Bid/Ask USD 202.00 /204.00
 

More UBS products and further information on the risks and opportunities are available at ubs.com/keyinvest.

Source: UBS AG, Bloomberg

As of: 10.10.2018

Market overview

Index Quotation Week¹
SMI™ 8’892.88 -3.1%
SLI™ 1’416.66 -4.8%
S&P 500™ 2’785.68 -4.8%
Euro STOXX 50™ 3’266.90 -4.1%
S&P™ BRIC 40 3’829.43 -4.9%
CMCI™ Compos. 963.86 -1.4%
Gold (troy ounce) 1’193.40 -1.4%

¹ Change based on the closing price of the previous day compared to the closing price a week ago.

SMI™ vs. VSMI™ 1 year

smi vs vsmi

The VSMI™ Index is calculated since 2005. It shows the volatility of the stocks within the SMI™ index. A portfolio which reacts only to changes in volatility instead of volatility itself is relevant for the calculation. Thereby, the VSMI™ methodology uses the squared volatility, known as variance, of the SMI options with remaining time to expiry of 30 days traded at the Eurex.

Source: UBS AG, Bloomberg

As of: 10.10.2018

Medical technology
A sector in upheaval

Commotion on the hearing aid market: The US company Bose, known for its speaker systems, has received FDA approval for a hearing aid. People with mild to moderate hearing loss can adjust the settings of this device to meet their needs. The increase in the competition on the market has placed the shares of Sonova under pressure, with the Swiss company’s equities losing about a tenth of their value following the announcement. Medical technology company Straumann also experienced a similar situation.¹ Weak tidings from the industry, among other things, has had a negative impact here. For example, Stratec Biomedical provided a huge surprise by issuing a profit warning. In view of the now reduced share prices of Sonova and Straumann, a partial protection product on the duo might make sense. The Early Redemption (ER) Worst of Kick-In GOAL (symbol: KCQVDU) in subscription offers attractive conditions in this regard. If the barrier remains intact at 69% of the starting prices, the product will yield a maximum amount of 5% p.a. in 18 months at the latest.

Two factors should not be overlooked in the current weakness of Sonova’s share price: Firstly, the group started its extensive share buy-back program on October 10. The hearing aid manufacturer would like to spend up to 1.5 billion Swiss francs on this program. Secondly, an important investors’ day will be held on October 16. Market participants hope that Sonova will use the meeting to announce a new hearing aid that will outperform competing products. At Straumann, on the other hand, things will only start getting exciting at the end of October, as this is when the implant specialist will publish its results for the third quarter. The company’s half-year figures delivered a positive surprise, as management increased its forecast for organic growth in 2018 by some 15%.

Opportunities: The two aforementioned medical technology equities do not need to post price gains for the new ER Worst of Kick-In GOAL (symbol: KCQVDU) to yield the maximum return of 5% p.a. All that is required is that both equites remain above the barrier of 69% of the initial fixing levels during the 18-month term. However, due to the early redemption function, the maximum return can also be achieved earlier. For this to happen, Sonova and Straumann both have to be at or above the initial fixed price on one of the quarterly observation days (first date: October 24, 2019).

Risks: This product does not have capital protection. If the underlyings touch or fall below the respective Kick-In Level (barrier) and the early redemption feature does not apply, the amount repaid on the maturity date is reflecting the worst performance of the underlyings (but not more than notional value plus coupon). In this case, it is likely that losses will be incurred. Investors in structured products are also exposed to issuer risk, which means that the capital invested may be lost if UBS AG becomes insolvent, regardless of the performance of the underlying.

More UBS products and further information on the risks and opportunities are available at ubs.com/keyinvest.

Sonova vs. Straumann (5 years) ¹
(for illustrative purposes only; figures in %)

Source: UBS AG, Bloomberg

As of: 10.10.2018

5.00% p.a. ER Worst of Kick-In GOAL on Sonova / Straumann

Symbol KCQVDU
SVSP Name Barrier Reverse Convertible
SPVSP Code 1230 (Auto-Callable)
Underlyings Sonova, Straumann
Currency CHF
Coupon 5.00% p.a.
Kick-In Level 69.00%
Expiry 23.04.2020
Issuer UBS AG, London
Subscription until 24.10.2018, 15:00 h
 

More UBS products and further information on the risks and opportunities are available at ubs.com/keyinvest.

Source: UBS AG, Bloomberg

As of: 10.10.2018

¹) Please be aware that past performance does not indicate future results.
²) The conditions of ETTs are reviewed on a yearly basis and can be adjusted with a deadline of 13 months after the announcement.

This material has been prepared by UBS AG or one of its affiliates («UBS»). This material is for distribution only as permitted by law. It is not prepared for the needs of any specific recipient. It is published solely for information and is not a solicitation or offer to buy or sell any securities or related financial instruments (“Instruments”). UBS makes no representation or warranty, either express or implied, on the completeness or reliability of the information contained in this document (“Information”) except that concerning UBS AG and its affiliates. The Information should not be regarded by recipients as a substitute for using their own judgment. Any opinions expressed in this material may change without notice and may be contrary to opinions expressed by other business areas of UBS as a result of using different assumptions or criteria. UBS is under no obligation to update the Information. UBS, its officers, employees or clients may have or have had an interest in the Instruments and may at any time transact in them. UBS may have or have had a relationship with entities referred to in the Information. Neither UBS nor any of its affiliates, or their officers or employees, accepts any liability for any loss arising from use of the Information. This presentation is not a basis for entering into a transaction. Any transaction between you and UBS will be subject to the detailed provisions of the term sheet, confirmation or electronic matching systems relating to that transaction. Clients wishing to effect transactions should contact their local sales representative.
This information is communicated by UBS AG and/or its affiliates («UBS»). * (see below) UBS may from time to time, as principal or agent, have positions in, or may buy or sell, or make a market in any securities, currencies, financial instruments or other assets underlying the product to which this website relates (the «Structured Product»). UBS may provide investment banking and other services to and/or have officers who serve as directors of the companies referred to in this website. UBS’s trading and/or hedging activities related to the Structured Product may have an impact on the price of the underlying asset and may affect the likelihood that any relevant barrier or relevant trigger event is crossed or triggered. UBS has policies and procedures designed to minimise the risk that officers and employees are influenced by any conflicting interest or duty and that confidential information is improperly disclosed or made available. UBS may pay or receive brokerage or retrocession fees in connection with the Structured Product described herein. In respect of any Structured Product that is a security, UBS may, in certain circumstances, sell the Structured Product to dealers and other financial institutions at a discount to the issue price or rebate to them for their own account some proportion of the issue price. Further information is available on request. Structured Products are complex and may involve a high risk of loss. Prior to purchasing the Structured Product you should consult with your own legal, regulatory, tax, financial and accounting advisors to the extent you consider it necessary, and make your own investment, hedging and trading decisions (including decisions regarding the suitability of the Structured Product) based upon your own judgement and advice from those advisers you consider necessary. Save as otherwise expressly agreed in writing, UBS is not acting as your financial adviser or fiduciary in relation to the Product. UBS generally hedges its exposure to Structured Products, although it may elect not to hedge or to partially hedge any Structured Product. UBS’s hedging activity may be conducted through transactions in the underlying asset, index or instrument or in options, futures or other derivatives related to the underlying asset, index or instrument on publicly traded markets or otherwise, and may have an impact on the price of the under-lying asset. If a transaction is cash settled, UBS will generally unwind or offset any hedge it has for such Structured Product in close proximity to the relevant valuation time or period. In some cases, this activity may affect the value of the Structured Product. Unless stated otherwise in this document, (i) this document is for information purposes only and should not be construed as an offer, personal recommendation or solicitation to purchase the Structured Product and should not be treated as giving investment advice, and (ii) the terms of any investment in the Structured Product will be exclusively subject to the detailed provisions, including risk considerations, contained in the more detailed legal documentation that relates to the Structured Product (being the confirmation, information memorandum, prospectus or other issuer documentation as relevant). UBS makes no representation or warranty relating to any information herein which is derived from independent sources. This document shall not be copied or reproduced without UBS’s prior written permission. In respect of any Structured Product that is a security, no action has been or will be taken in any jurisdiction that would permit a public offering of the Product, save where explicitly stated in the issuer documentation. The Structured Product must be sold in accordance with all applicable selling restrictions in the jurisdictions in which it is sold.
© UBS 2018. All rights reserved. UBS prohibits the forwarding of this information without the approval of UBS.
Weekly-Hits edition of 12.10.20182018-10-19T07:37:58+02:00

Weekly-Hits édition de 08.10.2018

KeyInvest Weekly Hits

Lundi, 08.10.2018

Keyinvest Weekly Hits
  • Thème 1: Réforme fiscale américaine – Les entreprises américaines prennent leur essor
  • Thème 2: Airbus / Boeing – Des carnets de commande pleins à craquer

Réforme fiscale américaine
Les entreprises américaines prennent leur essor

L’économie américaine est en pleine effervescence : au premier trimestre 2018, le produit intérieur brut (PIB) a progressé aux Etats-Unis, pour atteindre une valeur annuelle estimée de 4.2%. Parallèlement, sur le marché du travail, c’est de fait le plein emploi. La réforme fiscale mise en œuvre en début d’année sert de moteur essentiel à ce boom. Afin d’offrir aux investisseurs une possibilité de participer pleinement aux bénéfices des entreprises potentiellement avantagées, UBS a lancé en décembre 2017 le US Tax Reform Beneficiaries Basket. Jusqu’à présent, le calcul de ce choix se révèle exact : la valeur du PERLES (symbole : USTAXU) sur le panier a progressé de 11.3% depuis le début de l’année, c’est-à-dire qu’elle a fait mieux que l’indice S&P 500™.

Cette réforme fiscale de grande envergure était l’une des principales promesses de campagne de Donald Trump. En 2016, dans la course à la Maison blanche, le républicain avait fait miroiter d’importants allègements pour les particuliers et les entreprises, conformément à sa devise « America First ! ». Juste avant Noël 2017, environ onze mois après sa prise de pouvoir, Trump a signé le paquet de lois très contesté à Washington, mettant ainsi en œuvre la plus grande réforme fiscale depuis 30 ans aux Etats-Unis. Désormais, il apparaît que cette mesure dont l’un des éléments centraux est une nette réduction de l’impôt sur les sociétés est efficace. La réforme ne relance pas que l’économie américaine en tant que tout. Selon UBS CIO WM, elle se remarque aussi positivement dans les résultats des entreprises. Les experts désignent les allègements fiscaux comme la « cerise sur le gâteau » dans un environnement déjà positif. Concrètement, elle pourrait accélérer la croissance des résultats de cette année aux Etats-Unis de 8%. Au total, UBS CIO WM prévoit pour l’année en cours une hausse de 18% des profits. (Source : UBS CIO WM, « UBS House view Monthly Base », octobre 2018, 20.09.2018). Il est établi que le marché américain des actions en général, et les bénéficiaires de la réforme fiscale en particulier, font actuellement l’objet d’une forte demande de la part des investisseurs. Si d’autres places boursières importantes ont à peine évolué au cours des trois premiers trimestres de 2018, le S&P 500™ a enchaîné les records. Fin septembre 2018, l’indice de référence comptabilisait une hausse de tout juste 9%. Pendant ce temps, le US Tax Reform Beneficiaries Basket a augmenté de plus de 11%.

Juste avant que la réforme ait été décidée, UBS avait proposé cette possibilité en décembre dernier. L’impulsion avait été donnée par UBS Research. Les analystes de l’entreprise pensaient à l’époque que la réforme fiscale américaine n’était que partiellement intégrée dans les cours des actions. En conséquence, ils ont commencé à rechercher systématiquement de possibles bénéficiaires. Un critère central pour la composition du panier a été l’effet de la réforme sur les liquidités, et son rapport avec la capitalisation de marché. Afin d’éviter un trop grand écart par rapport à la composition de l’indice S&P 500™, les experts ont limité le nombre d’actions par secteur. Il en est résulté une légère surpondération des entreprises particulièrement bénéficiaires de la réforme.

A ce jour par exemple, la part relativement importante des entreprises healthcare et technologiques dans le US Tax Reform Beneficiaries Basket s’avère efficace. Pour le second secteur cité, la réforme fiscale facilite en outre un climat de consommation américain favorable. Il en est de même pour le commerce de détail. Dans ce secteur, ce sont notamment Kohl’s et Macy’s qui ont été pris en considération – à ce jour, les actions des deux grands magasins américains ont progressé en 2018 d’environ 37%.

Opportunités: le Tracker Certificat (symbole : USTAXU) sur le US Tax Reform Beneficiaries Basket n’est pas encore au bout de la première année de ses sept ans d’échéance. Les investisseurs peuvent en conséquence encore miser sur l’effet à long terme de la réforme fiscale américaine. La commission de gestion pour ce produit de participation est de 0.30% p.a. D’éventuels dividendes versés par les membres du panier sont réinvestis net dans l’action à l’origine du versement.

Risques: il n’existe aucune protection du capital pour le produit présenté. Il peut y avoir des pertes avec le PERLES lorsque le panier sous-jacent baisse. Par ailleurs, avec les produits structurés, l’investisseur supporte le risque d’émetteur. Cela signifie qu’en cas d’insolvabilité d’UBS SA, le capital investi peut être perdu, indépendamment de l’évolution du sous-jacent.

Vous trouverez davantage de produits UBS et des informations sur les opportunités et les risques à l’adresse ubs.com/keyinvest.

HCA Healthcare vs. Centene vs. Humana (5 ans)¹
(Aux fins d’illustration uniquement, données en %)

Les trois entreprises du secteur de la santé CA Healthcare, Centene et Humana comptent parmi les plus performantes du US Tax Reform Beneficiaries Basket. En 2018, le trio a encore accéléré sa tendance haussière.

Source: UBS AG, Bloomberg

Valeurs du: 03.10.2018

Kohl’s vs. Macy’s vs. Gap (5 ans)¹

(Aux fins d’illustration uniquement, données en %)

Les cours des actions des deux commerces de détail Kohl’s et Macy’s ont commencé à grimper après la mise en place de la réforme fiscale. En revanche, des problèmes opérationnels freinent la chaîne de magasins de mode Gap.

Source: UBS AG, Bloomberg

Valeurs du: 03.10.2018

¹) La performance passée n’indique pas les résultats futures.
²) Les condition des ETTs sont vérifiés annuellement et peuvent être ajustées avec un délai de 13 mois après la publication.

PERLES sur US Tax Reform Beneficiaries Basket

Symbol USTAXU
SVSP Name Tracker-certificat
SPVSP Code 1300
Sous-jacent US Tax Reform Beneficiaries Basket
Rapport de souscription 1:1
Devise USD
Frais de gestion 0.30% p.a.
Participation 100%
Echéance 20.10.2024
Émetteur UBS AG, London
Bid/Ask USD 1’135.00 / 1’145.00
 

US Tax Reform Beneficiaries Basket: Pondération initiale par secteur (Valeurs du: 04.12.2017)

Technologie 18%
Finances 16%
Soins de santé 16%
Non-Staples à la consommation 14%
Industrie 12%
Staples à la consommation 10%
Autre 14%
 

Vous trouverez davantage de produits UBS et des informations sur les opportunités et les risques à l’adresse ubs.com/keyinvest.

Source: UBS AG, Bloomberg

Valeurs du: 03.10.2018

Apérçu du marché

Index Citation Semaine¹
SMI™ 9’175.21 Pkt. 1.0%
SLI™ 1’488.05 Pkt. 0.0%
S&P 500™ 2’925.51 Pkt. 0.7%
Euro STOXX 50™ 3’405.48 Pkt. -0.8%
S&P™ BRIC 40 4’028.54 Pkt. -0.7%
CMCI™ Compos. 977.18 Pkt. 3.6%
Gold (once troy) 1’202.90 USD 0.3%

¹ Changement basé sur le cours de clôture du jour précédent par rapport au cours de clôture de la semaine dernière.

SMI™ vs. VSMI™ 1 année

L’index VSMI™ est calculé depuis 2005. Il affiche la volatilité des actions inclus dans le SMI™ index. Pour la calculation, un portefeuille est utilisé qui ne réagit qu’au variations de la volatilité au lieu des variations des prix. En le faisant, la méthodologie du VSMI™ utilise la volatilité carré, connu sous le terme variance, des options sur le SMI avec 30 jours jusqu’à l’échéance négociées à la Bourse Eurex.

Source: UBS AG, Bloomberg

Valeurs du: 03.10.2018

Airbus / Boeing
Des carnets de commande pleins à craquer

Dans le duel qui oppose les constructeurs d’avions Airbus et Boeing, le leader américain du secteur a pour l’instant une longueur d’avance. De janvier à août 2018, Boeing a enregistré des commandes nettes pour 581 appareils. Pendant la même période, Airbus a dû se contenter de commandes nettes pour 219 appareils. La récente évolution de cours des deux rivaux est similaire: alors que l’action Airbus marque le pas, Boeing débute le quatrième trimestre avec un nouveau record absolu.¹ UBS réunit maintenant les deux géants de la branche dans un Early Redemption (ER) Worst of Kick-In GOAL (symbole: KCOADU). Les investisseurs peuvent prévoir ici un versement de coupon d’un montant de 7,50% p.a. Actuellement, les sous-jacents entrent dans la période de deux ans avec une marge de sécurité de 40%.

En dépit du creux récent en matière de commandes, le carnet de commandes d’Airbus reste bien rempli. A la fin-août 2018, le groupe comptabilisait, selon ses propres indications, des commandes pour un total de 7415 appareils. Aux taux de production actuels, la production serait ainsi pleinement occupée pour environ neuf ans. Finalement, Airbus a obtenu une commande de la plus grande compagnie aérienne d’Europe. Lufthansa a converti des options d’achat pour 27 appareils de type A320 neo et A321 neo en commandes fermes. Dix des avions très peu gourmands en carburant de cette commande devraient être exploités pour SWISS. (Source : Airbus, Communiqué de presse, 01.10.2018) Chez Boeing, le légendaire 737 est un succès absolu. De janvier à août 2018, presque trois commandes sur quatre concernaient les modèles traditionnels. Le 737 MAX en particulier fait l’objet d’une forte demande. Boeing indique qu’au cours des plus de 100 ans d’histoire de l’entreprise, aucun avion ne s’est aussi bien vendu que ce modèle ultramoderne. Selon l’entreprise, quelque 4700 commandes de plus de 100 clients ont été passées pour le 737 MAX. (Source : Boeing.com) Les investisseurs découvriront le 24 octobre la situation du leader de la branche en ce qui concerne les bénéfices, lors de la publication par Boeing des résultats pour le 3e trimestre. Six jours après, Airbus donnera un aperçu de la marche récente de ses affaires.

Opportunités: juste avant les échéances de résultats, UBS émet le ER Worst of Kick-In GOAL (symbole: KCOADU) sur Airbus et Boeing. Le duo permet un coupon de 7,50% p.a. Les barrières sont situées à 60% du niveau initial des deux actions. Tant qu’aucun sous-jacent n’atteint ce niveau, ou n’y est inférieur, le produit s’inscrit avec un rendement maximal correspondant au coupon. S’ajoute à cela une possibilité de remboursement anticipé avec coupon proportionnel. La fonction de remboursement anticipé s’applique si Airbus et Boeing atteignent ensemble le cours initial lors d’une des journées d’observation trimestrielles ou sont supérieurs à celui-ci, pour la première fois au 19 octobre 2019.

Risques: il n’existe aucune protection du capital pour le produit présenté. Si, pendant la durée de l’investissement, l’un des sous-jacents atteint une seule fois la barrière respective («Kick-In Level») ou est inférieur à celle-ci, et que la fonction de remboursement anticipé ne s’applique pas, le remboursement par amortissement en espèces à l’échéance est basé sur la performance la plus faible (base Strike) du duo (au maximum toutefois à la valeur nominale majorée du coupon). Dans un tel cas, des pertes sont probables. Par ailleurs, avec les produits structurés, l’investisseur supporte le risque d’émetteur. Cela signifie qu’en cas d’insolvabilité d’UBS SA, le capital investi peut être perdu, indépendamment de l’évolution du sous-jacent.

Vous trouverez davantage de produits UBS et des informations sur les opportunités et les risques à l’adresse ubs.com/keyinvest.

Airbus vs. Boeing (5 ans)¹
(Aux fins d’illustration uniquement, données en %)

Source: UBS AG, Bloomberg

Valeurs du: 03.10.2018

7.50% p.a. Early Redemption Worst of Kick-In GOAL sur Airbus / Boeing

Symbol KCOADU
SVSP Name Barrier Reverse Convertible
SPVSP Code 1230 (Auto-Callable)
Sous-jacent Airbus / Boeing
Devise EUR
Coupon 7.50% p.a.
Kick-In Level 60.00%
Echéance 12.10.2020
Émetteur UBS AG, London
Date de fixation du prix 10.10.2018, 15:00 h
 

Vous trouverez davantage de produits UBS et des informations sur les opportunités et les risques à l’adresse ubs.com/keyinvest.

Source: UBS AG, Bloomberg

Valeurs du: 03.10.2018

¹) La performance passée n’indique pas les résultats futures.
²) Les condition des ETTs sont vérifiés annuellement et peuvent être ajustées avec un délai de 13 mois après la publication.
This material has been prepared by UBS AG or one of its affiliates («UBS»). This material is for distribution only as permitted by law. It is not prepared for the needs of any specific recipient. It is published solely for information and is not a solicitation or offer to buy or sell any securities or related financial instruments (“Instruments”). UBS makes no representation or warranty, either express or implied, on the completeness or reliability of the information contained in this document (“Information”) except that concerning UBS AG and its affiliates. The Information should not be regarded by recipients as a substitute for using their own judgment. Any opinions expressed in this material may change without notice and may be contrary to opinions expressed by other business areas of UBS as a result of using different assumptions or criteria. UBS is under no obligation to update the Information. UBS, its officers, employees or clients may have or have had an interest in the Instruments and may at any time transact in them. UBS may have or have had a relationship with entities referred to in the Information. Neither UBS nor any of its affiliates, or their officers or employees, accepts any liability for any loss arising from use of the Information. This presentation is not a basis for entering into a transaction. Any transaction between you and UBS will be subject to the detailed provisions of the term sheet, confirmation or electronic matching systems relating to that transaction. Clients wishing to effect transactions should contact their local sales representative.
This information is communicated by UBS AG and/or its affiliates («UBS»). * (see below) UBS may from time to time, as principal or agent, have positions in, or may buy or sell, or make a market in any securities, currencies, financial instruments or other assets underlying the product to which this website relates (the «Structured Product»). UBS may provide investment banking and other services to and/or have officers who serve as directors of the companies referred to in this website. UBS’s trading and/or hedging activities related to the Structured Product may have an impact on the price of the underlying asset and may affect the likelihood that any relevant barrier or relevant trigger event is crossed or triggered. UBS has policies and procedures designed to minimise the risk that officers and employees are influenced by any conflicting interest or duty and that confidential information is improperly disclosed or made available. UBS may pay or receive brokerage or retrocession fees in connection with the Structured Product described herein. In respect of any Structured Product that is a security, UBS may, in certain circumstances, sell the Structured Product to dealers and other financial institutions at a discount to the issue price or rebate to them for their own account some proportion of the issue price. Further information is available on request. Structured Products are complex and may involve a high risk of loss. Prior to purchasing the Structured Product you should consult with your own legal, regulatory, tax, financial and accounting advisors to the extent you consider it necessary, and make your own investment, hedging and trading decisions (including decisions regarding the suitability of the Structured Product) based upon your own judgement and advice from those advisers you consider necessary. Save as otherwise expressly agreed in writing, UBS is not acting as your financial adviser or fiduciary in relation to the Product. UBS generally hedges its exposure to Structured Products, although it may elect not to hedge or to partially hedge any Structured Product. UBS’s hedging activity may be conducted through transactions in the underlying asset, index or instrument or in options, futures or other derivatives related to the underlying asset, index or instrument on publicly traded markets or otherwise, and may have an impact on the price of the under-lying asset. If a transaction is cash settled, UBS will generally unwind or offset any hedge it has for such Structured Product in close proximity to the relevant valuation time or period. In some cases, this activity may affect the value of the Structured Product. Unless stated otherwise in this document, (i) this document is for information purposes only and should not be construed as an offer, personal recommendation or solicitation to purchase the Structured Product and should not be treated as giving investment advice, and (ii) the terms of any investment in the Structured Product will be exclusively subject to the detailed provisions, including risk considerations, contained in the more detailed legal documentation that relates to the Structured Product (being the confirmation, information memorandum, prospectus or other issuer documentation as relevant). UBS makes no representation or warranty relating to any information herein which is derived from independent sources. This document shall not be copied or reproduced without UBS’s prior written permission. In respect of any Structured Product that is a security, no action has been or will be taken in any jurisdiction that would permit a public offering of the Product, save where explicitly stated in the issuer documentation. The Structured Product must be sold in accordance with all applicable selling restrictions in the jurisdictions in which it is sold.
© UBS 2018. All rights reserved. UBS prohibits the forwarding of this information without the approval of UBS.
Weekly-Hits édition de 08.10.20182018-10-08T07:32:58+02:00

Weekly-Hits edition of 08.10.2018

KeyInvest Weekly Hits

Monday, 08.10.2018

Keyinvest Weekly Hits
  • Topic 1: US tax reform – US companies flourishing
  • Topic 2: Airbus/Boeing – Full-to-bursting order books

US tax reform
US companies flourishing

The US economy is buzzing. In the first quarter of 2018, the country’s gross domestic product (GDP) grew by 4.2% on an annualized basis. At the same time, the economy is more or less at full employment. One of the main drivers of this boom is the tax reform initiated at the start of the year. In December 2017, UBS launched the US Tax Reform Beneficiaries Basket to provide investors with an opportunity to participate in the benefits of the relief in a concentrated form. To date, the strategy behind the shares selected has been very successful. The PERLES (symbol: USTAXU) on the basket has gained 11.3% in value since the start of the year and is therefore outperforming the S&P 500™ index.

One of Donald Trump’s main promises that he made during his election campaign was the implementation of a large-scale tax reform. In the battle for the White House in 2016, the Republican candidate promised extensive relief for private households and businesses, true to the motto of “America first!”. Shortly before Christmas 2017 and about eleven months after taking office, Trump signed a package of laws that had been hotly contested in Washington and implemented the largest tax reform in the US in more than 30 years. This measure, one of the central elements of which was a significant reduction in corporate income tax, is now clearly taking effect. The reform is not only driving the US economy forward as a whole, it is also having a positive effect on company figures according to UBS CIO WM. The experts describe the relief as the “icing on the cake” in an already positive environment. In concrete terms, the reform could accelerate this year’s profit growth in the US by 8%. Overall, UBS CIO WM anticipates a profit increase of 18% for the current year. (Source: UBS CIO WM, «UBS House view Monthly Base», October 2018, 20.09.2018) What is certain is that the US equity market in general and the beneficiaries of the tax reform in particular are currently in strong demand among investors. While other important stock markets hardly made any headway in the first three quarters of 2018, the S&P 500™ continued its attempt to set new records. At the end of September 2018, the benchmark was up by just under 9%. Meanwhile, the US Tax Reform Beneficiaries Basket has increased in price by more than 11%.

UBS launched this selection last December, shortly before a decision had been made on the reform. The impetus to do so came from UBS Research. The in-house analysts were of the opinion at the time that the US tax reform had only been partially priced into share prices. As a result, they systematically searched for companies that could potentially profit from the reform. One of the main criterion for the composition of the basket was the influence of the reform on cash flow and its relation to the respective market capitalization. In order to ensure that the composition did not differ too much from that of the S&P 500™ index, the experts limited the number of shares per sector, resulting in a moderate overweight in companies that benefit the most.

For example, the relatively high proportion of healthcare and technology companies in the US Tax Reform Beneficiaries Basket has paid off to date. In addition to the tax reform, the friendly US consumer climate is playing into the hands of the technology sector. The same also applies to the retail sector. Kohl’s and Macy’s, among others, were considered from this sector of the economy – the shares of the two US department stores have to date risen by around 37% in 2018.

Opportunities: The tracker certificate (symbol: USTAXU) on the US Tax Reform Beneficiaries Basket is still in the first year of its seven-year term. Investors can therefore continue to be able to rely on the long-term effect of the US tax reform. The management fee for the participation product is 0.3% p.a. Any dividend payments distributed by the basket members are reinvested net in the share of the company paying out.

Risks: This product does not have capital protection. The PERLES will make a loss if the underlying basket decreases. Investors in structured products are also exposed to issuer risk, which means that the invested capital may be lost if UBS AG becomes insolvent, regardless of the performance of the underlying.

More UBS products and further information on the risks and opportunities are available at ubs.com/keyinvest.

HCA Healthcare vs. Centene vs. Humana (5 years)¹
(for illustrative purposes only; figures in %)

The three healthcare companies HCA Healthcare, Centene and Humana are among the top performers in the US Tax Reform Beneficiaries Basket to date. The upward pace of the three shares increased once again in 2018.

Source: UBS AG, Bloomberg

As of 03.10.2018

Kohl’s vs. Macy’s vs. Gap (5 years)¹

(for illustrative purposes only; figures in %)

The share prices of the two US retailers Kohl’s and Macy’s have rocketed following the introduction of the tax reform. In contrast, operational problems have put the brakes on the Gap fashion chain’s share performance.

Source: UBS AG, Bloomberg

As of: 03.10.2018

¹) Please be aware that past performance does not indicate future results.
²) The conditions of ETTs are reviewed on a yearly basis and can be adjusted with a deadline of 13 months after the announcement.

PERLES on US Tax Reform Beneficiaries Basket

Symbol USTAXU
SVSP Name Tracker-Certificate
SPVSP Code 1300
Underlying US Tax Reform Beneficiaries Basket
Ratio 1:1
Currency USD
Administration fee 0.30% p.a.
Participation 100%
Expiry 20.10.2024
Issuer UBS AG, London
Bid/Ask USD 1’135.00 / 1’145.00
 

US Tax Reform Beneficiaries Basket: Initial weighting by sector (as of: 04.12.2017)

Technology 18%
Finances 16%
Healthcare 16%
Non-basic consumer Goods 14%
Industry 12%
Basic consumer Goods 10%
Other 14%

More UBS products and further information on the risks and opportunities are available at ubs.com/keyinvest.

Source: UBS AG, Bloomberg

As of: 03.10.2018

Market overview

Index Quotation Week¹
SMI™ 9’175.21 Pkt. 1.0%
SLI™ 1488.05 Pkt. 0.0%
S&P 500™ 2’925.51 Pkt. 0.7%
Euro STOXX 50™ 3’405.48 Pkt. -0.8%
S&P™ BRIC 40 4’028.54 Pkt. -0.7%
CMCI™ Compos. 977.18 Pkt. 3.6%
Gold (troy ounce) 1’202.90 USD 0.3%

¹ Change based on the closing price of the previous day compared to the closing price a week ago.

SMI™ vs. VSMI™ 1 year

smi vs vsmi

The VSMI™ Index is calculated since 2005. It shows the volatility of the stocks within the SMI™ index. A portfolio which reacts only to changes in volatility instead of volatility itself is relevant for the calculation. Thereby, the VSMI™ methodology uses the squared volatility, known as variance, of the SMI options with remaining time to expiry of 30 days traded at the Eurex.

Source: UBS AG, Bloomberg

As of: 03.10.2018

Airbus/Boeing
Full-to-bursting order books

In the duel between the aircraft manufacturers Airbus and Boeing, the US industry leader has currently inched ahead by a nose. From January to August 2018, Boeing received net orders for 581 aircraft. In contrast, Airbus had to make do with just 219 net orders during this period. The most recent share price performance of the rivals reflects this. While the Airbus share is stagnating in the short term, the Boeing share has started the fourth quarter at a new all-time high.¹ UBS is now combining the two industry giants for an Early Redemption (ER) Worst of Kick-In GOAL (symbol: KCOADU). Investors can expect a coupon payment of 7.5% p.a. here. Meanwhile, the underlyings have a safety cushion of 40% over the two-year term.

Despite the recent slump in orders, Airbus› order book remains full to bursting. At the end of August 2018, the Group reported that it had orders for a total of 7,415 aircraft. At current production rates, production will therefore be fully utilized for almost nine years. Lastly, Airbus secured an order from Europe’s largest airline. Lufthansa converted purchase options for 27 A320 neo and A321 neo aircraft into concrete orders. Ten of the fuel-efficient aircraft from this order will go into service for SWISS. (Source: Airbus press release, 01.10.2018) At Boeing, the legendary 737 is the absolute bestseller. From January to August 2018, almost three-quarters of orders were for the classic aircraft, with the 737 MAX being most in demand. According to Boeing, never before has an airplane sold as well as this ultra-modern model in the company’s history, which stretches back for more than 100 years. The company has revealed that approximately 4,700 orders have been placed for the 737 MAX from more than 100 customers. (Source: Boeing.com) Investors will find out how well the industry leader has performed on October 24 when Boeing publishes its figures for the third quarter. Six days later, Airbus will provide an insight into the company’s latest business developments.

Opportunities: Shortly before the earnings releases, UBS will issue the ER Worst of Kick-In GOAL (symbol: KCOADU) on Airbus and Boeing. A coupon of 7.50% p.a. is available on the two shares. The barriers are set at 60% of the starting level of the two shares. As long as none of the underlyings touch or fall below this level, the product will end with a maximum return in line with the coupon. There is also the opportunity for early redemption at 100% plus the accrued coupon. The Early Redemption feature will take effect if the Airbus and Boeing shares are level with or above the initial price on one of the quarterly observation days (first date: 19.10.2019).

Risks: This product does not have capital protection. If the underlyings touch or fall below the respective Kick-In Level (barrier) and the early redemption feature does not apply, the amount repaid on the maturity date is reflecting the worst performance of the underlyings (but not more than notional value plus coupon). In this case, it is likely that losses will be incurred. Investors in structured products are also exposed to issuer risk, which means that the capital invested may be lost if UBS AG becomes insolvent, regardless of the performance of the underlying.

More UBS products and further information on the risks and opportunities are available at ubs.com/keyinvest.

Airbus vs. Boeing (5 years)¹

(for illustrative purposes only; figures in %)

Source: UBS AG, Bloomberg

As of: 03.10.2018

7.50% p.a. Early Redemption Worst of Kick-In GOAL on Airbus / Boeing

Symbol KCOADU
SVSP Name Barrier Reverse Convertible
SPVSP Code 1230 (Auto-Callable)
Underlyings Airbus / Boeing
Currency EUR
Coupon 7.50% p.a.
Kick-In Level 60.00%
Expiry 12.10.2020
Issuer UBS AG, London
Subscription until 10.10.2018, 15:00 h
 

More UBS products and further information on the risks and opportunities are available at ubs.com/keyinvest.

Source: UBS AG, Bloomberg

As of: 03.10.2018

¹) Please be aware that past performance does not indicate future results.
²) The conditions of ETTs are reviewed on a yearly basis and can be adjusted with a deadline of 13 months after the announcement.

This material has been prepared by UBS AG or one of its affiliates («UBS»). This material is for distribution only as permitted by law. It is not prepared for the needs of any specific recipient. It is published solely for information and is not a solicitation or offer to buy or sell any securities or related financial instruments (“Instruments”). UBS makes no representation or warranty, either express or implied, on the completeness or reliability of the information contained in this document (“Information”) except that concerning UBS AG and its affiliates. The Information should not be regarded by recipients as a substitute for using their own judgment. Any opinions expressed in this material may change without notice and may be contrary to opinions expressed by other business areas of UBS as a result of using different assumptions or criteria. UBS is under no obligation to update the Information. UBS, its officers, employees or clients may have or have had an interest in the Instruments and may at any time transact in them. UBS may have or have had a relationship with entities referred to in the Information. Neither UBS nor any of its affiliates, or their officers or employees, accepts any liability for any loss arising from use of the Information. This presentation is not a basis for entering into a transaction. Any transaction between you and UBS will be subject to the detailed provisions of the term sheet, confirmation or electronic matching systems relating to that transaction. Clients wishing to effect transactions should contact their local sales representative.
This information is communicated by UBS AG and/or its affiliates («UBS»). * (see below) UBS may from time to time, as principal or agent, have positions in, or may buy or sell, or make a market in any securities, currencies, financial instruments or other assets underlying the product to which this website relates (the «Structured Product»). UBS may provide investment banking and other services to and/or have officers who serve as directors of the companies referred to in this website. UBS’s trading and/or hedging activities related to the Structured Product may have an impact on the price of the underlying asset and may affect the likelihood that any relevant barrier or relevant trigger event is crossed or triggered. UBS has policies and procedures designed to minimise the risk that officers and employees are influenced by any conflicting interest or duty and that confidential information is improperly disclosed or made available. UBS may pay or receive brokerage or retrocession fees in connection with the Structured Product described herein. In respect of any Structured Product that is a security, UBS may, in certain circumstances, sell the Structured Product to dealers and other financial institutions at a discount to the issue price or rebate to them for their own account some proportion of the issue price. Further information is available on request. Structured Products are complex and may involve a high risk of loss. Prior to purchasing the Structured Product you should consult with your own legal, regulatory, tax, financial and accounting advisors to the extent you consider it necessary, and make your own investment, hedging and trading decisions (including decisions regarding the suitability of the Structured Product) based upon your own judgement and advice from those advisers you consider necessary. Save as otherwise expressly agreed in writing, UBS is not acting as your financial adviser or fiduciary in relation to the Product. UBS generally hedges its exposure to Structured Products, although it may elect not to hedge or to partially hedge any Structured Product. UBS’s hedging activity may be conducted through transactions in the underlying asset, index or instrument or in options, futures or other derivatives related to the underlying asset, index or instrument on publicly traded markets or otherwise, and may have an impact on the price of the under-lying asset. If a transaction is cash settled, UBS will generally unwind or offset any hedge it has for such Structured Product in close proximity to the relevant valuation time or period. In some cases, this activity may affect the value of the Structured Product. Unless stated otherwise in this document, (i) this document is for information purposes only and should not be construed as an offer, personal recommendation or solicitation to purchase the Structured Product and should not be treated as giving investment advice, and (ii) the terms of any investment in the Structured Product will be exclusively subject to the detailed provisions, including risk considerations, contained in the more detailed legal documentation that relates to the Structured Product (being the confirmation, information memorandum, prospectus or other issuer documentation as relevant). UBS makes no representation or warranty relating to any information herein which is derived from independent sources. This document shall not be copied or reproduced without UBS’s prior written permission. In respect of any Structured Product that is a security, no action has been or will be taken in any jurisdiction that would permit a public offering of the Product, save where explicitly stated in the issuer documentation. The Structured Product must be sold in accordance with all applicable selling restrictions in the jurisdictions in which it is sold.
© UBS 2018. All rights reserved. UBS prohibits the forwarding of this information without the approval of UBS.
Weekly-Hits edition of 08.10.20182018-10-08T07:06:13+02:00

Weekly-Hits édition de 28.09.2018

KeyInvest Weekly Hits

Vendredi, 28.09.2018

dax
  • Thème 1: Allemagne - L’automne sera chaud
  • Thème 2: Ferrari / Porsche - Un nouvel éclat pour les voitures de luxe

Allemagne
L’automne sera chaud

Précisément pour l’année de son 30e anniversaire, l’indice DAX™ a perdu la cadence. Depuis début 2018, l’indice DAX™ (Deutscher Aktienindex) lancé le 1er juillet 1988 affiche une baisse de 4,4%.¹ Comme sur d’autres places boursières également, l’inflation du conflit commercial constitue le frein le plus important pour le marché des actions allemand. Toutefois, l’indice ifo du climat des affaires actuel révèle que le moral reste relativement élevé au sein de l’économie allemande, en dépit de tous les facteurs d’incertitude. Avec un ETT (symbole : ETDAX), les investisseurs peuvent profiter de la faiblesse actuelle du cours de l’indice DAX™ pour un premier placement. Alors que le produit de participation est directement couplé aux hausses et aux baisses des 30 Large Caps, le nouveau Worst of Kick-In GOAL (symbole : KCMSDU) vise une évolution relativement stable de Bayer, SAP et Volkswagen. Le Trio DAX™ permet un coupon de 6,50% p.a. Cette opportunité de rendement est couplée à une marge de sécurité de 40%.

Chaque mois, l’institut ifo de Munich interroge quelque 9000 managers sur la situation actuelle et sur leurs prévisions pour les six prochains mois. L’indice du climat des affaires tiré de cette enquête compte parmi les indicateurs avancés les plus importants de l’économie allemande. En septembre, le baromètre s’est légèrement assombri, passant à 103,7 points contre 103,9 points au mois précédent. Toutefois, d’un point de vue historique, il se maintient à un niveau élevé. Clemens Fuest, président de l’institut ifo, commente ainsi les résultats actuels : « L’économie allemande reste stable, même si l’incertitude s’accroît ». (Source : Institut ifo, communiqué de presse, 24.09.2018)

A la bourse de Francfort, l’inflation du conflit douanier entre les Etats-Unis et la Chine pèse toujours sur le moral des investisseurs. S’ajoute à cela une situation politique instable inhabituelle pour l’Allemagne. Toutefois, la grande coalition CDU, CSU et SPD souhaite désormais se concentrer sur le travail objectif après les récentes querelles concernant le président de l’Office fédéral de la protection de la Constitution Hans-Georg Maassen. Les élections aux assemblées parlementaires de Bavière et de la Hesse qui auront lieu les 14 et 28 octobre donneront une indication à ce sujet. Outre les deux votations, les investisseurs DAX™ pourraient surtout observer la saison sous revue au cours des semaines à venir. Il apparaîtra dans ce contexte si et dans quelle mesure le nouveau protectionnisme influence les affaires des grands groupes allemands actifs dans l’exportation.

Opportunités: si les chiffres disponibles réveillent le DAX™ de sa léthargie récente, l’ETT (symbole : ETDAX) pourrait constituer un instrument de placement intéressant. Ce produit Open End reproduit l’indice directeur en proportion de 10 à 1. Dans ce contexte, l’investisseur profite également des conditions de participation aux bénéfices attrayantes des Large Caps allemandes, les dividendes étant réinvestis net. Comme souvent pour ce type de structure aucune commission de gestion n’est appliquée.² D’ailleurs, traditionnellement SAP ouvre la saison sous revue dans le DAX. Ce groupe informatique présentera ses résultats trimestriels le 18 octobre. Avec Bayer et Volkswagen, l’action SAP sert de sous-jacent pour un nouveau Worst of Kick-In GOAL (symbole : KCMSDU). Les investisseurs peuvent prévoir ici un versement ferme de coupon d’un montant de 6,50% p.a.
Si la condition suivante est réalisée, ils se voient en outre rembourser l’intégralité du nominal à l’échéance : aucune des trois actions n’atteint ou ne dépasse la barrière inférieure de 60% du niveau initial.

Risques: il n’existe aucune protection du capital pour les produits présentés. Avec un ETT, dès que l’indice sous-jacent tombe en-dessous du prix d’entrée, des pertes se produisent. Si, pendant la durée de l’investissement, l’un des sous-jacents du Worst of Kick-In GOAL atteint une seule fois la barrière respective («Kick-In Level») ou est inférieur à celle-ci, le remboursement par amortissement en espèces à l’échéance est basé sur la performance la plus faible (base Strike) du trio (au maximum toutefois à la valeur nominale majorée du coupon). Dans un tel cas, des pertes sont probables. De plus, avec les produits structurés, l’investisseur supporte le risque d’émetteur. Cela signifie qu’en cas d’insolvabilité d’UBS SA, le capital investi peut être perdu, indépendamment de l’évolution des sous-jacents.

Vous trouverez davantage de produits UBS et des informations sur les opportunités et les risques à l’adresse ubs.com/keyinvest.

DAX™ (5 ans)¹

Une consolidation à un niveau élevé : depuis plus d’un an, le DAX™ évolue latéralement. Pendant ce temps, le secteur autour des 12 000 points s’est cristallisé comme un soutien à l’indice.

Source: UBS AG, Bloomberg

Valeurs du: 27.09.2018

Bayer vs. SAP vs. Volkswagen (5 ans)¹

Trois actions, deux orientation : alors que Bayer et Volkswagen enregistrent des signaux négatifs à cinq ans, SAP, le poids lourd du DAX™ a nettement fait progressé sa valeur boursière.

Source: UBS AG, Bloomberg

Valeurs du: 27.09.2018

¹) La performance passée n’indique pas les résultats futures.
²) Les condition des ETTs sont vérifiés annuellement et peuvent être ajustées avec un délai de 13 mois après la publication.
ETT sur DAX™

Symbol ETDAX
SVSP Name Tracker certificat
SPVSP Code 1300
Sous-jacent DAX™
Rapport de souscription 10:1
Devise EUR
Frais de gestion 0.00% p.a.
Participation 100%
Echéance Open End
Émetteur UBS AG, London
Bid/Ask EUR 1’235.00 / 1’241.00
 

6.50% p.a. Worst of Kick-In GOAL sur Bayer / SAP / Volkswagen

Symbol KCMSDU
SVSP Name Barrier Reverse Convertible
SPVSP Code 1230
Sous-jacent Bayer / SAP / Volkswagen VZ
Devise EUR
Coupon 6.50% p.a.
Kick-In Level 60.00%
Echéance 03.04.2020
Émetteur UBS AG, London
Date de fixation du prix 03.10.2018, 15:00 h
 

Vous trouverez davantage de produits UBS et des informations sur les opportunités et les risques à l’adresse ubs.com/keyinvest.

Source: UBS AG, Bloomberg

Valeurs du: 27.09.2018

Apérçu du marché

Index Citation Semaine¹
SMI™ 9’080.14 1.6%
SLI™ 1’488.24 1.6%
S&P 500™ 2’905.97 -0.1%
Euro STOXX 50™ 3’433.15 1.9%
S&P™ BRIC 40 4’056.94 2.1%
CMCI™ Compos. 943.22 1.4%
Gold (once troy) 1’199.10 -0.8%

¹ Changement basé sur le cours de clôture du jour précédent par rapport au cours de clôture de la semaine dernière.

SMI™ vs. VSMI™ 1 année

L’index VSMI™ est calculé depuis 2005. Il affiche la volatilité des actions inclus dans le SMI™ index. Pour la calculation, un portefeuille est utilisé qui ne réagit qu’au variations de la volatilité au lieu des variations des prix. En le faisant, la méthodologie du VSMI™ utilise la volatilité carré, connu sous le terme variance, des options sur le SMI avec 30 jours jusqu’à l’échéance négociées à la Bourse Eurex.

Source: UBS AG, Bloomberg

Valeurs du: 27.09.2018

Ferrari / Porsche
Un nouvel éclat pour les voitures de luxe

Les événements se précipitent actuellement dans le segment de la voiture de sport : le constructeur de véhicules de luxe Ferrari souhaite lancer au total 15 nouveaux modèles sur le marché d’ici 2022. Quelque 60% des véhicules devront alors être équipés d’un moteur hybride. La motorisation alternative constitue également un thème important pour Porsche. Le groupe a été le premier constructeur automobile à faire connaître sa sortie du Diesel. Il se concentre désormais totalement sur les véhicules à essence, hybrides et électriques. Les investisseurs ont la possibilité d’intégrer les deux titres automobiles dans leur dépôt. Le Kick-In GOAL en souscription (symbole : KCOIDU) est pourvu d’un coupon intéressant de 8,00% p.a., et propose une marge de sécurité de 30%.

Le moteur traditionnel à combustion disparaît progressivement. Désormais, l’énergie électrique s’est également emparée définitivement du secteur des voitures de sport. Porsche bannit le Diesel de sa gamme de production et intensifie en revanche la mobilité hybride et électrique. D’ici 2022, plus de six milliards d’euros seront consacrés à ces technologies. En 2025 déjà, un véhicule neuf de Porsche sur deux devrait être équipé d’un moteur électrique, soit hybride, soit totalement électrique. Le groupe de tradition italien Ferrari suit la même voie. Lors de la récente présentation du nouveau plan de développement à moyen terme à Maranello, le PDG du groupe Louis Camilleri a dévoilé un feu d’artifice de modèles. Entre 2019 et 2022, 15 nouveaux modèles et variantes de modèles sont prévus dans les domaines Sport, GT et Special Series. On y trouvera aussi, après de longues hésitations, un véhicule tout terrain sportif. Cette offensive va donc élargir encore la gamme de produits actuelle. En 2022, quelque 60% des Ferrari seront des modèles hybrides. S’agissant des bénéfices, la tendance est à l’optimisme. On prévoit pour 2022 une marge opérationnelle de 38% pour le groupe. Elle s’établissait à 31,9% au deuxième trimestre 2018.

Opportunités: les personnes souhaitant intégrer les deux fabricants de voitures de luxe dans leur dépôt pourraient considérer le Worst of Kick-In GOAL (symbole : KCOIDU). Cette nouvelle émission est tout à fait honorable. Le produit en souscription dispose d’un coupon de 8,00% p.a. ainsi que d’une marge de sécurité initiale de 30%. Tant que ni Ferrari ni
Porsche n’atteint ou ne passe sous la barrière de 70% du niveau initial, le rendement maximal est obtenu. Le produit émis en francs suisses est couvert contre les risques de change. L’échéance est de précisément un an.

Risques: les Kick-In GOALS ne bénéficient d’aucune protection du capital. Si, pendant la durée de l’investissement, l’un des sous-jacents atteint une seule fois la barrière respective («Kick-In Level») ou est inférieur à celle-ci, le remboursement par amortissement en espèces à l’échéance est basé sur la performance la plus faible (base Strike) du duo (au maximum toutefois à la valeur nominale majorée du coupon). Dans un tel cas, des pertes sont probables. Par ailleurs, avec les produits structurés, l’investisseur supporte le risque d’émetteur. Cela signifie qu’en cas d’insolvabilité d’UBS SA, le capital investi peut être perdu, indépendamment de l’évolution du sous-jacent.

Vous trouverez davantage de produits UBS et des informations sur les opportunités et les risques à l’adresse ubs.com/keyinvest.

Ferrari vs. Porsche (depuis 04.01.2016, Start Ferrari-Listing à Milan)¹

Source: UBS AG, Bloomberg

Valeurs du: 27.09.2018

8.00% p.a. Worst of Kick-In GOAL sur Porsche / Ferrari

Symbol KCOIDU
SVSP Name Barrier Reverse Convertible
SPVSP Code 1230
Sous-jacent Ferrari / Porsche
Devise CHF (Quanto)
Coupon 8.00% p.a.
Kick-In Level 70.00%
Echéance 10.10.2019
Émetteur UBS AG, London
Date de fixation du prix 10.10.2018, 15:00 h
 

Vous trouverez davantage de produits UBS et des informations sur les opportunités et les risques à l’adresse ubs.com/keyinvest.

Source: UBS AG, Bloomberg

Valeurs du: 27.09.2018

¹) La performance passée n’indique pas les résultats futures.
²) Les condition des ETTs sont vérifiés annuellement et peuvent être ajustées avec un délai de 13 mois après la publication.
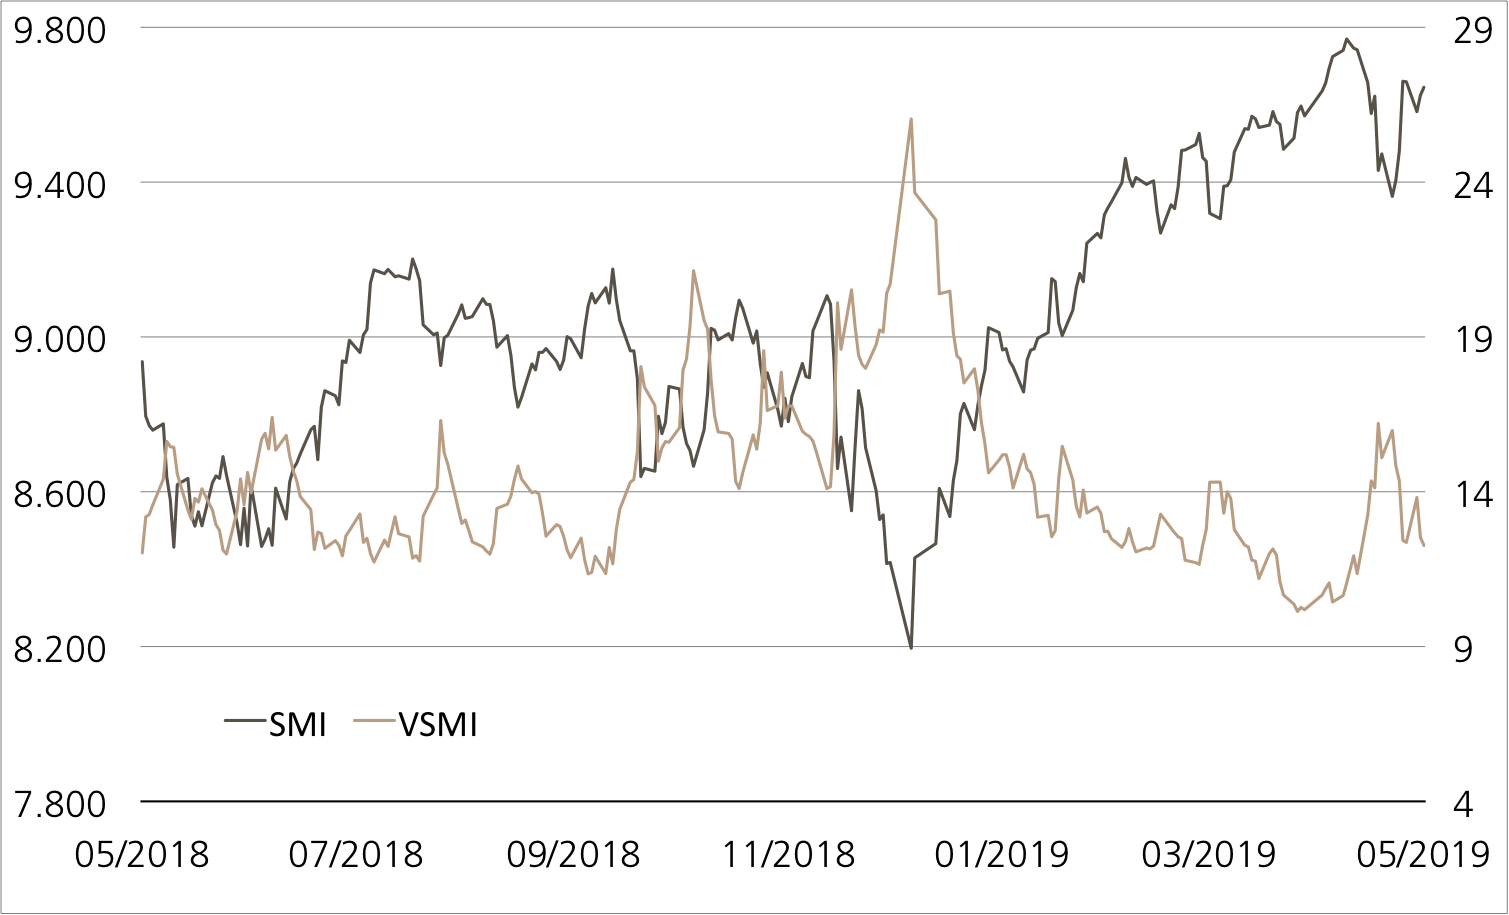
This material has been prepared by UBS AG or one of its affiliates («UBS»). This material is for distribution only as permitted by law. It is not prepared for the needs of any specific recipient. It is published solely for information and is not a solicitation or offer to buy or sell any securities or related financial instruments (“Instruments”). UBS makes no representation or warranty, either express or implied, on the completeness or reliability of the information contained in this document (“Information”) except that concerning UBS AG and its affiliates. The Information should not be regarded by recipients as a substitute for using their own judgment. Any opinions expressed in this material may change without notice and may be contrary to opinions expressed by other business areas of UBS as a result of using different assumptions or criteria. UBS is under no obligation to update the Information. UBS, its officers, employees or clients may have or have had an interest in the Instruments and may at any time transact in them. UBS may have or have had a relationship with entities referred to in the Information. Neither UBS nor any of its affiliates, or their officers or employees, accepts any liability for any loss arising from use of the Information. This presentation is not a basis for entering into a transaction. Any transaction between you and UBS will be subject to the detailed provisions of the term sheet, confirmation or electronic matching systems relating to that transaction. Clients wishing to effect transactions should contact their local sales representative.
This information is communicated by UBS AG and/or its affiliates («UBS»). * (see below) UBS may from time to time, as principal or agent, have positions in, or may buy or sell, or make a market in any securities, currencies, financial instruments or other assets underlying the product to which this website relates (the «Structured Product»). UBS may provide investment banking and other services to and/or have officers who serve as directors of the companies referred to in this website. UBS’s trading and/or hedging activities related to the Structured Product may have an impact on the price of the underlying asset and may affect the likelihood that any relevant barrier or relevant trigger event is crossed or triggered. UBS has policies and procedures designed to minimise the risk that officers and employees are influenced by any conflicting interest or duty and that confidential information is improperly disclosed or made available. UBS may pay or receive brokerage or retrocession fees in connection with the Structured Product described herein. In respect of any Structured Product that is a security, UBS may, in certain circumstances, sell the Structured Product to dealers and other financial institutions at a discount to the issue price or rebate to them for their own account some proportion of the issue price. Further information is available on request. Structured Products are complex and may involve a high risk of loss. Prior to purchasing the Structured Product you should consult with your own legal, regulatory, tax, financial and accounting advisors to the extent you consider it necessary, and make your own investment, hedging and trading decisions (including decisions regarding the suitability of the Structured Product) based upon your own judgement and advice from those advisers you consider necessary. Save as otherwise expressly agreed in writing, UBS is not acting as your financial adviser or fiduciary in relation to the Product. UBS generally hedges its exposure to Structured Products, although it may elect not to hedge or to partially hedge any Structured Product. UBS’s hedging activity may be conducted through transactions in the underlying asset, index or instrument or in options, futures or other derivatives related to the underlying asset, index or instrument on publicly traded markets or otherwise, and may have an impact on the price of the under-lying asset. If a transaction is cash settled, UBS will generally unwind or offset any hedge it has for such Structured Product in close proximity to the relevant valuation time or period. In some cases, this activity may affect the value of the Structured Product. Unless stated otherwise in this document, (i) this document is for information purposes only and should not be construed as an offer, personal recommendation or solicitation to purchase the Structured Product and should not be treated as giving investment advice, and (ii) the terms of any investment in the Structured Product will be exclusively subject to the detailed provisions, including risk considerations, contained in the more detailed legal documentation that relates to the Structured Product (being the confirmation, information memorandum, prospectus or other issuer documentation as relevant). UBS makes no representation or warranty relating to any information herein which is derived from independent sources. This document shall not be copied or reproduced without UBS’s prior written permission. In respect of any Structured Product that is a security, no action has been or will be taken in any jurisdiction that would permit a public offering of the Product, save where explicitly stated in the issuer documentation. The Structured Product must be sold in accordance with all applicable selling restrictions in the jurisdictions in which it is sold.
© UBS 2018. All rights reserved. UBS prohibits the forwarding of this information without the approval of UBS.
Weekly-Hits édition de 28.09.20182018-10-01T06:22:52+02:00

Weekly-Hits edition of 28.09.2018

KeyInvest Weekly Hits

Friday, 28.09.2018

dax
  • Topic 1: Germany – A warm fall
  • Topic 2: Ferrari/Porsche – Luxury car bodies in new splendor

Germany
A warm fall

Just as it enters the year of its 30th anniversary, the DAX™ has been thrown out of step. Since the start of the year, the Deutscher Aktienindex™, launched on July 1, 1988, has recorded a negative performance of 4.4%.¹ As is the case on other stock exchanges, the simmering trade conflict is regarded as the main source of friction for the German stock market. Nevertheless, the current ifo Business Climate Index shows that the mood within the German economy remains at a comparatively high level despite all of the factors contributing to the uncertainty. With an ETT (symbol: ETDAX), investors can use the current weakness in the DAX™ to enter the market. While the participation product is directly linked to the fluctuating performances of 30 large caps, the aim of the new Worst of Kick-In GOAL on Bayer, SAP and Volkswagen (symbol: KCMSDU) is to achieve a relatively stable performance. The DAX™ trio allow a coupon of 6.50 percent p.a. This return opportunity is linked to a 40% safety buffer.

Every month, the Munich-based ifo Institute asks around 9,000 managers about the current situation on the markets and their expectations for the next six months. This survey helps form the Business Climate Index, which is one of the most important early indicators for the German economy. Although the barometer became slightly gloomier in September, falling to 103.7 points after totaling 103.9 points in the previous month, the Index still remained at a historically high level. “The German economy is stable, even if there is increasing uncertainty,” commented Clemens Fuest, President of the ifo Institute, on the latest results. (Source: ifo Institute press release, 24.09.2018)

The customs dispute between the US and China that continues to simmer is weighing heavily on the mood on the Frankfurt Stock Exchange. Added to this is an instable political situation, which is unusual for Germany. Nevertheless, the Grand Coalition of the CDU, CSU and SPD would now like to focus on the business at hand after the recent quarrels regarding Hans-Georg Maassen, former President of the Federal Office for the Protection of the Constitution. The German regional elections in Bavaria and Hesse on October 14 and 28, respectively, could be indicatory in this respect. In addition to the two polls, DAX™ investors are likely to keep a close eye on the reporting season over the coming weeks, as this will show whether and to what extent the protectionism that is emerging worldwide is having an impact on the business of the major export-oriented German corporations.

Opportunities: Should the results of the elections cure the DAX™ of its recent lethargy, the ETT (symbol: ETDAX) would be an effective investment instrument. The open-end product tracks the key index with a conversion ratio of 10:1. Investors also benefit from the attractive profit sharing schemes of the German large caps, with dividends being reinvested in net terms. No management fees are typically incurred for this structure.² SAP traditionally kicks off the reporting season on the DAX, with the software group presenting its quarterly figures on October 18. Together with those of Bayer and Volkswagen, the SAP share serves as the underlyings for a new Worst of Kick-In GOAL (symbol: KCMSDU). Investors can make concrete plans here thanks to an annual coupon payment of 6.50%. If none of the shares fall level with or below the barrier of 60% of the initial fixings, investors will also receive their nominal amount back in full at the end of the term.

Risks: These products do not have capital protection. The ETT will make a loss if the underlying index falls below the initial price. If the underlyings of the Worst of Kick-In GOAL touch or fall below the respective Kick-In Level (barrier), the amount repaid on the maturity date is reflecting the worst performance of the underlyings (but not more than notional value plus coupon). In this case, it is likely that losses will be incurred. Investors in structured products are also exposed to issuer risk, which means that the capital invested may be lost if UBS AG becomes insolvent, regardless of the performance of the underlying.

More UBS products and further information on the risks and opportunities are available at ubs.com/keyinvest.

DAX™ (5 years)¹

Consolidation at a high level: The DAX™ has been trending sideward for more than a year. During this time, the area has emerged as a support level for the benchmark at around 12,000 points.

Source: UBS AG, Bloomberg

As of 27.09.2018

Bayer vs. SAP vs. Volkswagen (5 years)¹

Three equities, two directions: While Bayer and Volkswagen have posted a negative performance over the last five years, the DAX™ heavyweight SAP was able to significantly increase its market capitalization.

Source: UBS AG, Bloomberg

As of: 27.09.2018

¹) Please be aware that past performance does not indicate future results.
²) The conditions of ETTs are reviewed on a yearly basis and can be adjusted with a deadline of 13 months after the announcement.

ETT on DAX™

Symbol ETDAX
SVSP Name Tracker-Certificate
SPVSP Code 1300
Underlying DAX™
Ratio 10:1
Currency EUR
Administration fee 0.00% p.a.
Participation 100%
Expiry Open End
Issuer UBS AG, London
Bid/Ask EUR 1’235.00 / 1’241.00
 

6.50% p.a. Worst of Kick-In GOAL auf Bayer / SAP / Volkswagen

Symbol KCMSDU
SVSP Name Barrier Reverse Convertible
SPVSP Code 1230
Underlying Bayer / SAP / Volkswagen VZ
Currency EUR
Coupon 6.50% p.a.
Kick-In Level 60.00%
Expiry 03.04.2020
Issuer UBS AG, London
Subscription until 03.10.2018, 15:00 h
 

More UBS products and further information on the risks and opportunities are available at ubs.com/keyinvest.

Source: UBS AG, Bloomberg

As of: 27.09.2018

Market overview

Index Quotation Week¹
SMI™ 9’080.14 1.6%
SLI™ 1’488.24 1.6%
S&P 500™ 2’905.97 -0.1%
Euro STOXX 50™ 3’433.15 1.9%
S&P™ BRIC 40 4’056.94 2.1%
CMCI™ Compos. 943.22 1.4%
Gold (troy ounce) 1’199.10 -0.8%

¹ Change based on the closing price of the previous day compared to the closing price a week ago.

SMI™ vs. VSMI™ 1 year

smi vs vsmi

The VSMI™ Index is calculated since 2005. It shows the volatility of the stocks within the SMI™ index. A portfolio which reacts only to changes in volatility instead of volatility itself is relevant for the calculation. Thereby, the VSMI™ methodology uses the squared volatility, known as variance, of the SMI options with remaining time to expiry of 30 days traded at the Eurex.

Source: UBS AG, Bloomberg

As of: 27.09.2018

Ferrari/Porsche
Luxury car bodies in new splendor

The events in the sports car segment are coming thick and fast at the moment, as luxury manufacturer Ferrari wants to place 15 new models on the market by 2022. Their aim by this point in time is for some 60% of their cars to come equipped with a hybrid engine. Alternative engines are also a hot topic at rivals Porsche. The company was the first German car maker to announce its intention to withdraw from the diesel market. It now focuses solely on gasoline engines, hybrid models and electric vehicles. Investors have the option of including both of the car stocks in their portfolio. The new Worst of Kick-In GOAL (symbol: KCOIDU) in subscription has an attractive annual coupon of 8% and offers a safety buffer of 30%.

The traditional combustion engine is increasingly becoming obsolete. Electric engines are now also making waves in the sports car industry. Porsche has removed diesel engines from its product range and increased its focus in the areas of hybrid and electric mobility. It is estimated that more than EUR 6 billion will be pumped into these technologies by 2022. As early as 2025, every second new Porsche vehicle could be electrically powered, be it via a hybrid engine or a completely electric engine. The long-established Italian company Ferrari is also following this path. At its recent presentation of the new medium-term development plan in Maranello, CEO Louis Camilleri announced a plethora of new models – with 15 new models and model variants being planned to be released in the three areas of Sport, GT and Special Series between 2019 and 2022. This will also include a sporty all-terrain vehicle, which has suffered long delays. The aim of this offensive push is to further diversify the current product range. By 2022, some 60% of the Ferraris produced will be hybrid models. This should also see profits increasing further. The Group’s operating margin is expected to reach 38% in 2022, after totaling 31.9% in the second quarter of 2018.

Opportunities: Should any investors want the two luxury car body manufacturers to be part of their portfolio as a pair, they would be advised to take a look at the Worst of Kick-In GOAL (symbol: KCOIDU). The configuration of this new issue is very impressive – The product is in subscription and has an annual coupon of 8% as well as an initial risk buffer of 30%. Provided that neither the Ferrari share nor the Porsche share fall level with or below the barrier of 70% of the initial fixing level, the maximum return will be paid out. The product issued in Swiss francs includes currency hedging. The security matures after exactly one year.

Risks: This product does not have capital protection. If the underlyings touch or fall below the respective Kick-In Level (barrier), the amount repaid on the maturity date is reflecting the worst performance of the underlyings (but not more than notional value plus coupon). In this case, it is likely that losses will be incurred. Investors in structured products are also exposed to issuer risk, which means that the capital invested may be lost if UBS AG becomes insolvent, regardless of the performance of the underlying.

More UBS products and further information on the risks and opportunities are available at ubs.com/keyinvest.

Ferrari vs. Porsche (since 04.01.2016, Start Ferrari-Listing in Mailand)¹

Source: UBS AG, Bloomberg

As of: 27.09.2018

8.00% p.a. Worst of Kick-In GOAL on Porsche / Ferrari

Symbol KCOIDU
SVSP Name Barrier Reverse Convertible
SPVSP Code 1230
Underlyings Ferrari / Porsche
Currency CHF (Quanto)
Coupon 8.00% p.a.
Kick-In Level 70.00%
Expiry 10.10.2019
Issuer UBS AG, London
Subscription until 10.10.2018, 15:00 h
 

More UBS products and further information on the risks and opportunities are available at ubs.com/keyinvest.

Source: UBS AG, Bloomberg

As of: 27.09.2018

¹) Please be aware that past performance does not indicate future results.
²) The conditions of ETTs are reviewed on a yearly basis and can be adjusted with a deadline of 13 months after the announcement.

This material has been prepared by UBS AG or one of its affiliates («UBS»). This material is for distribution only as permitted by law. It is not prepared for the needs of any specific recipient. It is published solely for information and is not a solicitation or offer to buy or sell any securities or related financial instruments (“Instruments”). UBS makes no representation or warranty, either express or implied, on the completeness or reliability of the information contained in this document (“Information”) except that concerning UBS AG and its affiliates. The Information should not be regarded by recipients as a substitute for using their own judgment. Any opinions expressed in this material may change without notice and may be contrary to opinions expressed by other business areas of UBS as a result of using different assumptions or criteria. UBS is under no obligation to update the Information. UBS, its officers, employees or clients may have or have had an interest in the Instruments and may at any time transact in them. UBS may have or have had a relationship with entities referred to in the Information. Neither UBS nor any of its affiliates, or their officers or employees, accepts any liability for any loss arising from use of the Information. This presentation is not a basis for entering into a transaction. Any transaction between you and UBS will be subject to the detailed provisions of the term sheet, confirmation or electronic matching systems relating to that transaction. Clients wishing to effect transactions should contact their local sales representative.
This information is communicated by UBS AG and/or its affiliates («UBS»). * (see below) UBS may from time to time, as principal or agent, have positions in, or may buy or sell, or make a market in any securities, currencies, financial instruments or other assets underlying the product to which this website relates (the «Structured Product»). UBS may provide investment banking and other services to and/or have officers who serve as directors of the companies referred to in this website. UBS’s trading and/or hedging activities related to the Structured Product may have an impact on the price of the underlying asset and may affect the likelihood that any relevant barrier or relevant trigger event is crossed or triggered. UBS has policies and procedures designed to minimise the risk that officers and employees are influenced by any conflicting interest or duty and that confidential information is improperly disclosed or made available. UBS may pay or receive brokerage or retrocession fees in connection with the Structured Product described herein. In respect of any Structured Product that is a security, UBS may, in certain circumstances, sell the Structured Product to dealers and other financial institutions at a discount to the issue price or rebate to them for their own account some proportion of the issue price. Further information is available on request. Structured Products are complex and may involve a high risk of loss. Prior to purchasing the Structured Product you should consult with your own legal, regulatory, tax, financial and accounting advisors to the extent you consider it necessary, and make your own investment, hedging and trading decisions (including decisions regarding the suitability of the Structured Product) based upon your own judgement and advice from those advisers you consider necessary. Save as otherwise expressly agreed in writing, UBS is not acting as your financial adviser or fiduciary in relation to the Product. UBS generally hedges its exposure to Structured Products, although it may elect not to hedge or to partially hedge any Structured Product. UBS’s hedging activity may be conducted through transactions in the underlying asset, index or instrument or in options, futures or other derivatives related to the underlying asset, index or instrument on publicly traded markets or otherwise, and may have an impact on the price of the under-lying asset. If a transaction is cash settled, UBS will generally unwind or offset any hedge it has for such Structured Product in close proximity to the relevant valuation time or period. In some cases, this activity may affect the value of the Structured Product. Unless stated otherwise in this document, (i) this document is for information purposes only and should not be construed as an offer, personal recommendation or solicitation to purchase the Structured Product and should not be treated as giving investment advice, and (ii) the terms of any investment in the Structured Product will be exclusively subject to the detailed provisions, including risk considerations, contained in the more detailed legal documentation that relates to the Structured Product (being the confirmation, information memorandum, prospectus or other issuer documentation as relevant). UBS makes no representation or warranty relating to any information herein which is derived from independent sources. This document shall not be copied or reproduced without UBS’s prior written permission. In respect of any Structured Product that is a security, no action has been or will be taken in any jurisdiction that would permit a public offering of the Product, save where explicitly stated in the issuer documentation. The Structured Product must be sold in accordance with all applicable selling restrictions in the jurisdictions in which it is sold.
© UBS 2018. All rights reserved. UBS prohibits the forwarding of this information without the approval of UBS.
Weekly-Hits edition of 28.09.20182018-09-28T11:34:20+02:00

Börsenausblick: Worauf Anleger jetzt achten sollten

KeyInvest Blog

Montag, 24. September 2018

Börsenausblick: Worauf Anleger jetzt achten sollten

Während die starke Konjunktur und wachsende Unternehmensgewinne für steigende Kurse sprechen, stellt der Handelsstreit ein echtes Risiko für die globalen Akteinmärkte dar. Wir zeigen, wie UBS CIO GWM die weiteren Aussichten einschätzt und zu welcher Ausrichtung die Kapitalmarktprofis den Investoren raten.

An der Börse gibt es keine Verschnaufpausen. Nahezu ununterbrochen laufen Meldungen, Konjunkturindikatoren oder Unternehmensresultate über den Ticker. In den vergangenen Jahren überwogen dabei die positiven Schlagzeilen. So legte beispielsweise die Weltwirtschaft in 2016 um 3.2 Prozent zu, 2017 waren es 3.8 Prozent und nach Prognosen des Internationalen Währungsfonds soll das Bruttoinlandsprodukt im laufenden Jahr gar um 3.9 Prozent expandieren. In guter Form präsentierten sich zuletzt auch die Unternehmen. Laut Datenspezialist Factset haben die S&P 500TM-Unternehmen 2017 ihr Ergebnis je Aktie im Schnitt um 10.8 Prozent steigern können, beim STOXXTM 600 errechnet sich ein Plus von 14.5 Prozent. Das Wachstum der globalen Konjunktur und Unternehmensgewinnen bescherten den Aktienmärkten einen steten Aufwärtstrend. 2018 bestimmt dagegen ein negativ behaftetes Schlagwort zusehendes den Newsflow: Protektionismus. Der Handelsstreit und seine möglichen Folgen halten die Investoren rund um den Globus in Atem.

In der Zoll-Spirale

Getreu seinem Motto «America First!» verfolgt vor allem Donald Trump eine protektionistische Handelspolitik. Bereits im Januar 2018 kündigte der US-Präsident Zölle auf importierte Solarmodule und Waschmaschinen an, welche am 7. Februar in Kraft traten. Nachdem die Staaten im März Abgaben auf Stahl- und Aluminiumeinfuhren verhängt hatten, verschärfte der Präsident die Tonart immer weiter und nahm dabei China ins Visier: Anfang Juli führten die USA Zölle auf Waren im Wert von 34 Milliarden US-Dollar ein, die aus dem Reich der Mitte importiert werden. Peking verhängte postwendend einen Obolus auf US-Einfuhren in gleichem Umfang. (Quelle: Thomson Reuters Medienbericht, 06.07.2018)

Noch können die skizzierten Auseinandersetzungen den Börsen relativ wenig anhaben. Der MSCITM World Index bewegte sich Mitte August 2018 knapp über dem Niveau von Ende 2017. An der Wall Street herrschte sogar eine ausgeprägte Kauflaune. Der US-Leitindex S&P 500TM notierte zum Stichtag nur knapp unter dem Allzeithoch. Derweil verlaufen die Aktienmärkte auf dem alten Kontinent mehr oder weniger in einem Seitwärtstrend.* Mark Haefele, Chief Investment Officer (CIO) im Global Wealth Management (GWM) von UBS, führt den nach wie vor bestehenden Optimismus auf gute Unternehmensgewinne, ermutigenden US-Beschäftigungsdaten sowie eine geringere Zahl an negativen Konjunkturüberraschungen in der Eurozone zurück.

Das Negativ-Szenario

Allerdings könnten die Märkte seiner Ansicht nach die von den Zöllen ausgehende Gefahr unterschätzen. Das gilt laut Haefele vor allem für mögliche Zweitrundeneffekte oder zollfremde Massnahmen. Dem Experten zufolge werden die Zölle zwangsläufig die Versorgungsketten beeinträchtigen, sobald sie eine ausreichende Verbreitung erreichen. Da die US-Wirtschaft nicht besonders abhängig von der Nachfrage aus China ist, könnte Peking alternative Massnahmen ergreifen. Neben offensichtlichen Schritten wie der Schwächung der Währung oder dem Verkauf von US-Treasuries zählt Haefele die Drosselung der Lieferung wichtiger Komponenten in die USA sowie die Belastung von US-Unternehmen mit mehr Bürokratie zu Pekings Optionen.

Dem CIO zufolge könnten Zweitrunden- der zollfremde Massnahmen viel stärkere negative Auswirkungen auf das Wirtschaftswachstum und die Unternehmensgewinne haben. Das gelte vor allem dann, wenn sie Chinas Fähigkeiten beeinträchtigen, die notwendigen Strukturreformen oder den Schuldenabbau zu bewerkstelligen. UBS CIO GWM hat auf die skizzierten Risiken reagiert und die übergewichtete Position in globalen Aktien zurückgefahren.

Grund zum Optimismus

Grundsätzlich erachtet es Haefele jedoch als wichtig, investiert zu bleiben. Er hält es für durchaus möglich, dass sich jüngsten Zollandrohungen als Verhandlungstaktik erweisen. Wäre diese der Fall, blieben die Aussichten freundlich. In der Vergangenheit war es dem CIO zufolge eher falsch, zu vorsichtig als zu optimistisch zu agieren. Marc Haefele begründet diese These mit der historischen Entwicklung des S&PTM 500: In der Nachkriegszeit hat der US-Leitindex in Zeiträumen von sechs Monaten 2.3 Mal häufiger positive als negative Renditen erzielt. Bei einem Betrachtungszeitraum von fünf Jahren lag die entsprechende Quote sogar bei 5.8. (Quelle: UBS House View Monthly Letter, 19.07.2018)

Alles in allem käme es für Investoren nun zunächst darauf an, kein übermässiges Risiko einzugehen und sich auf das kurzfristige Abwärtspotenzial vorzubereiten. Haefele sieht verschiedene Möglichkeiten, mit denen sich Anleger für Portfoliowachstum positionieren, aber auch die kurzfristigen Risiken begrenzen können: Dazu zählt er beispielsweise die Beimischung von alternativen Anlagen wie Hedge Funds oder die Diversifikation über Länder und Sektoren. Als weiteres Instrument nennt der Kapitalmarktprofi die Anlage in Vermögenswerten, die von langfristigen Trends profitieren. Vor allem Aktien aus den Bereichen E-Commerce und Software haben zuletzt eine Outperformance erwirtschaft. Dahinter verbergen sich häufig Geschäftsmodelle, die von strukturellen Entwicklungen wie Bevölkerungswachstum und -alterung sowie Urbanisierung profitieren. Haefele hält solche Unternehmen für besser positioniert, um den Wachstums- und Handelssorgen standzuhalten, als stärker vom Konjunkturzyklus abhängige Gesellschaften. (Quelle: UBS House View Monthly Letter, 19.07.2018)

* Bitte beachten Sie, dass vergangene Wertentwicklungen keine Indikationen für künftige Wertentwicklungen sind.

Weitere Blogeinträge:

Wachablösung an der Wall Street

Mit Amazon.com und Apple verpassten in der vergangenen Woche zwei Wall Street-Schwergewichte der laufenden Berichtssaison einen Dämpfer.

Ein ausschlaggebendes Quintett

Von herbstlicher Ruhe an den Finanzmärkten kann derzeit keine Rede sein. Die Fünfergruppe aus Inflation, Zinsen, Wirtschaft, Firmenbilanzen und Evergrande prägt derzeit massgeblich das Geschehen.

Die Stimmung bleibt angespannt

Nach dem nervösen Auf und Ab in den vergangenen Wochen konnten Börsianer in den zurückliegenden Tagen etwas durchatmen.

Herbststürme

An den Märkten läuten derzeit die Alarmglocken: Probleme in den Lieferketten, Materialengpässe sowie eine nachlassende Nachfrage aus China auf der einen Seite.

Börsenausblick: Worauf Anleger jetzt achten sollten2018-10-25T07:50:39+02:00

Weekly-Hits édition de 21.09.2018

KeyInvest Weekly Hits

Vendredi, 21.09.2018

keyinvest titel
  • Thème 1: Electric Car Beneficiaries Basket - Une bonne charge d’électricité pour aborder l’avenir
  • Thème 2: Richemont / LVMH / Swatch - Un profil risque-opportunité intéressant

Fabricants de denrées alimentaires
La nourriture a toujours le vent en poupe

En plein tournant d’une époque, entre le moteur à essence et le moteur électrique, de nombreuses questions sur l’apparence de la voiture du futur se posent. Le constructeur allemand de véhicules haut de gamme BMW a récemment apporté une réponse en présentant l’iNext, une nouvelle voiture électrique autonome. Cette voiture devrait voir le jour en 2021, dans sa version de série. Et les constructeurs ne sont pas les seuls à se battre pour être en pole position. Les fournisseurs de même que l’industrie IT attendent beaucoup des nouveaux véhicules du futur sur quatre roues. Par exemple, le fabricant de puces Infineon suit depuis longtemps la tendance des voitures autonomes et des systèmes de conduite assistée ainsi que de l’e-mobilité. Désormais, la possibilité de participer aux opportunités de croissance de l’e-tendance dans le secteur automobile est ouverte aux investisseurs. Le PERLES sur l’« Electric Car Beneficiaries Basket » (symbole : ECARSU) participe totalement à l’évolution de cours du panier d’actions. Seuls des frais de gestion (0,50%) sont déduits. En contrepartie, d’éventuels dividendes nets sont réinvestis dans les membres du panier.

Même si l’automobile électrique n’est pas encore devenue un produit de masse, et loin s’en faut, la croissance est énorme. Le meilleur exemple en est la Chine : en matière d’e-mobilité, le pays est nettement un précurseur mondial. Ainsi, au premier semestre 2018, quelque 412 000 voitures électriques, c’est-à-dire plus du double qu’au premier semestre 2017, ont été vendues dans l’empire du Milieu. Sur le deuxième marché mondial des voitures électriques, les États-Unis, le taux de croissance s’est établi à tout de même 34%. Si tout se passe comme les experts du Center of Automotive Management (CAM) le prévoient, les véhicules électriques s’empareront progressivement des rues. Selon ces spécialistes, en 2020, leur part de marché globale sera de 6%. Elle devrait déjà atteindre 25% en 2025, puis même 40% en 2030. (Source : www.auto-institut.de) Les constructeurs ne sont pas les seuls à souhaiter participer à cette tendance. Les entreprises sous-traitantes et les groupes informatiques s’impliquent fortement. Par exemple Continental qui, s’agissant de l’e-mobilité, a déjà de nombreux produits techniques en gestation. Et parmi ceux-ci, le New-Wheel-Concept. Il permet, grâce à un freinage plus efficace et une puissance de récupération d’énergie supérieure, de faire circuler les véhicules électriques presque sans utiliser les freins en ville. Le fournisseur automobile Aptiv, une branche séparée de Delphi Automotive, utilise actuellement une flotte de 30 véhicules autonomes dans le réseau du service de transport Lyft à Las Vegas.

Et pour l’industrie des puces, la demande est également très forte avec la numérisation sur quatre roues. Les spécialistes de Mordor Intelligence prévoient que le marché des semi-conducteurs automobiles passera de 34,6 milliards de dollars US en 2017 à 92,9 milliards de dollars US en 2023, c’est-à-dire qu’il connaîtra un taux de croissance moyen de 17,9%. La société Infineon déjà mentionnée plus haut compte parmi les bénéficiaires de cette évolution. Les experts d’UBS considèrent que le fabricant allemand de semi-conducteurs est bien positionné, tant pour la technologie silicium que pour la technologie carbure de silicium. (Source : UBS CIO WM, Semis : Who’s powering Tesla’s Model 3 ?, 15.08.2018)

Opportunités: Les experts en recherche primaire de l’UBS Evidence Lab se sont mis à la recherche des gagnants de la tendance à la voiture électrique et examiné en détail les composants des véhicules électriques. Une commission spécialisée a finalement identifié huit groupes prometteurs du secteur des fournisseurs et de l’industrie IT qu’elle a réunis dans l’« Electric Car Beneficiaries Basket ». Avec le PERLES (symbole : ECARSU), les investisseurs ont désormais la possibilité d’investir de manière diversifiée dans ce thème d’avenir. Le produit en souscription participe intégralement à l’évolution des cours des sous-jacents, après déduction d’une commission de gestion de 0,50% p.a. Les dividendes nets sont réinvestis dans le panier. L’échéance est à sept ans. Toutefois, l’émetteur peut prolonger cette échéance de sept ans supplémentaires.

Risques: Les PERLES ne bénéficient d’aucune protection du capital. En conséquence, une évolution négative des sous-jacents génère les pertes correspondantes pour le produit structuré. Par ailleurs, avec les produits structurés, l’investisseur supporte le risque d’émetteur. Cela signifie qu’en cas d’insolvabilité d’UBS SA, le capital investi peut être perdu, indépendamment de l’évolution du sous-jacent.

Vous trouverez davantage de produits UBS et des informations sur les opportunités et les risques à l’adresse ubs.com/keyinvest.

Continental vs. Denso vs. Valeo (5 ans)¹

chart continental

Les trois fournisseurs automobiles Continental, Denso et Valeo de l’Electric Car Beneficiaries Basket présentent, sur une période de cinq ans, une évolution globalement positive. La société française Valeo a réalisé la plus forte croissance.

Source: UBS AG, Bloomberg

Valeurs du: 20.09.2018

Infineon vs. Intel (5 ans)¹

chart infineon

Le rôle des semi-conducteurs dans l’industrie automobile va croissant. L’Electric Car Beneficiaries Basket contient en conséquence les deux géants de la puce électronique Infineon et Intel. Les actions de ces deux sociétés présentent une tendance à la hausse.

Source: UBS AG, Bloomberg

Valeurs du: 20.09.2018

¹) La performance passée n’indique pas les résultats futures.
²) Les condition des ETTs sont vérifiés annuellement et peuvent être ajustées avec un délai de 13 mois après la publication.
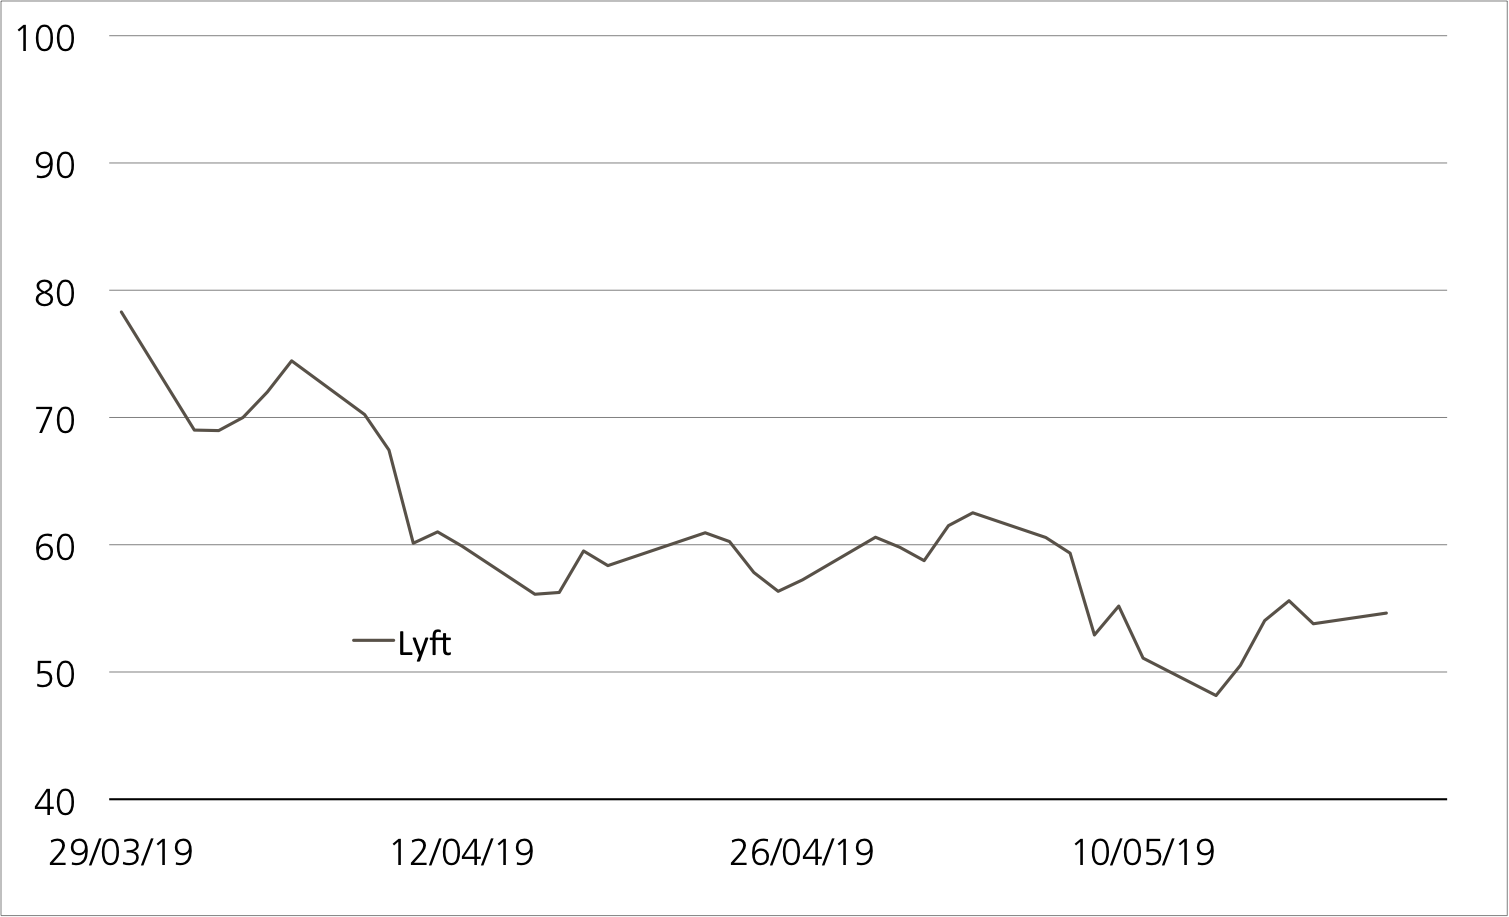
PERLES sur Electric Car Beneficiaries Basket

Symbol ECARSU
SVSP Name Tracker-Zertifikat
SPVSP Code 1300
Sous-jacent Electric Car Beneficiaries Basket
Rapport de souscription 1:1
Devise CHF
Frais de gestion 0.50% p.a.
Participation 100%
Echéance 26.09.2025
Émetteur UBS AG, London
Date de fixation du prix 27.09.2018, 15:00 Uhr
 

Composition commencer et pondération d’Electric Car Beneficiaries Baskets und Gewichtung

Continental AG 12.50%
Denso Corp 12.50%
Valeo SA 12.50%
Aptiv PLC 12.50%
Lear Corp 12.50%
Tenneco Inc 12.50%
Infineon Tec. AG 12.50%
Intel Corp 12.50%

Vous trouverez davantage de produits UBS et des informations sur les opportunités et les risques à l’adresse ubs.com/keyinvest.

Source: UBS AG, Bloomberg

Valeurs du: 20.09.2018

Apérçu du marché

Index Citation Semaine¹
SMI™ 8’939.85 -0.2%
SLI™ 1’465.10 0.2%
S&P 500™ 2’907.95 0.7%
Euro STOXX 50™ 3’368.56 1.3%
S&P™ BRIC 40 3’972.45 3.6%
CMCI™ Compos. 930.19 -0.4%
Gold (once troy) 1’208.30 -0.2%

¹ Changement basé sur le cours de clôture du jour précédent par rapport au cours de clôture de la semaine dernière.

SMI™ vs. VSMI™ 1 année

L’index VSMI™ est calculé depuis 2005. Il affiche la volatilité des actions inclus dans le SMI™ index. Pour la calculation, un portefeuille est utilisé qui ne réagit qu’au variations de la volatilité au lieu des variations des prix. En le faisant, la méthodologie du VSMI™ utilise la volatilité carré, connu sous le terme variance, des options sur le SMI avec 30 jours jusqu’à l’échéance négociées à la Bourse Eurex.

Source: UBS AG, Bloomberg

Valeurs du: 20.09.2018

Richemont / LVMH / Swatch
Un profil risque-opportunité intéressant

Les fournisseurs d’articles de luxe connaissent actuellement un contexte favorable. Selon UBS CIO WM, outre des marchés d’actions forts, la hausse des prix de l’immobilier ainsi que la progression de la classe moyenne, surtout en Asie, favorisent ce secteur. Toutefois, l’amplification du conflit commercial constitue une menace pour tout le secteur des biens de consommation, et donc également pour le segment du luxe. Un positionnement partiellement couvert pourrait donc être intéressant pour les investisseurs. Avec le nouveau Callable Kick-In GOAL (symbole : KCMHDU), Richemont, LVMH et Swatch disposent d’une marge de sécurité de 40% chacun. Tant qu’aucune de ces trois actions de luxe n’utilise l’intégralité de cette marge pendant la durée de deux ans, le produit générera le rendement maximal de 7,00% par an à l’échéance.

UBS CIO WM prévoit que les facteurs présentés plus haut resteront solides jusqu’à nouvel ordre. De plus, à moyen terme, la Chine pourrait stimuler la croissance du secteur du luxe. Dans le même temps, le marché des montres connaîtrait un nouvel élan. Toutefois, les analystes soulignent aussi que les incertitudes politiques pourraient peser sur le climat des affaires et la confiance des consommateurs. UBS CIO WM privilégie actuellement les entreprises du luxe disposant de bonnes perspectives de croissance organique ou d’un potentiel de restructuration performante et d’évaluations attractives. (Source : UBS CIO WM European Consumer Discretionary, Equity preferences, 28.08.2018). Avec ses derniers résultats, LVMH a apporté la preuve d’un environnement positif pour le secteur. Au premier semestre, le groupe français a connu une augmentation de 28% de son bénéfice, dépassant ainsi les prévisions des analystes. En particulier en Chine, la demande a été forte pour les montres et vêtements de luxe ainsi que les bijoux de valeur de ce géant de la branche. (Source : Thomson Reuters, revue de presse, 24.07.2018).

Opportunités: Avec les deux fabricants de montres suisses Richemont et Swatch, LVMH fait office de sous-jacent pour un nouveau Callable Kick-In GOAL (symbole : KCMHDU). Indépendamment de l’évolution des cours des trois actions, ce nouveau produit verse un coupon correspondant à 7,00% par an. Cette opportunité de rendement va de pair avec des barrières basses de 60% du niveau de cours initial. Nous attirons votre attention sur le fait qu’avec ce Kick-In GOAL, un remboursement anticipé avec coupon au pro rata est possible. L’émetteur pourra dénoncer le produit pour la première fois au 26 septembre 2019, puis ensuite tous les trois mois.

Risques: Les Worst of Kick-In GOALS ne bénéficient d’aucune protection du capital. Si, pendant la durée de l’investissement, l’un des sous-jacents atteint une seule fois la barrière respective («Kick-In Level») ou est inférieur à celle-ci, et que la fonction de Callable ne s’applique pas, le remboursement à l’échéance par remboursement en espèces est basé sur la performance la plus faible (base Strike) du quatuor (au maximum toutefois à la valeur nominale majorée du coupon). Dans un tel cas, des pertes sont probables. Par ailleurs, avec les produits structurés, l’investisseur supporte le risque d’émetteur. Cela signifie qu’en cas d’insolvabilité d’UBS SA, le capital investi peut être perdu, indépendamment de l’évolution des sous-jacents.

Vous trouverez davantage de produits UBS et des informations sur les opportunités et les risques à l’adresse ubs.com/keyinvest.

Richemont vs. LVMH vs. Swatch (5 ans)¹

Source: UBS AG, Bloomberg

Valeurs du: 20.09.2018

7.00% p.a. Callable Kick-In GOAL sur Richemont/ LVMH/ Swatch

Symbol KCMHDU
SVSP Name Barrier Reverse Convertible
SPVSP Code 1230 (Callable)
Sous-jacent Richemont / LVMH / Swatch
Devise CHF (Quanto)
Coupon 7.00% p.a.
Kick-In Level 60.00%
Echéance 28.09.2020
Émetteur UBS AG, London
Date de fixation du prix 26.09.2018, 15:00 h
 

Vous trouverez davantage de produits UBS et des informations sur les opportunités et les risques à l’adresse ubs.com/keyinvest.

Source: UBS AG, Bloomberg

Valeurs du: 20.09.2018

¹) La performance passée n’indique pas les résultats futures.
²) Les condition des ETTs sont vérifiés annuellement et peuvent être ajustées avec un délai de 13 mois après la publication.
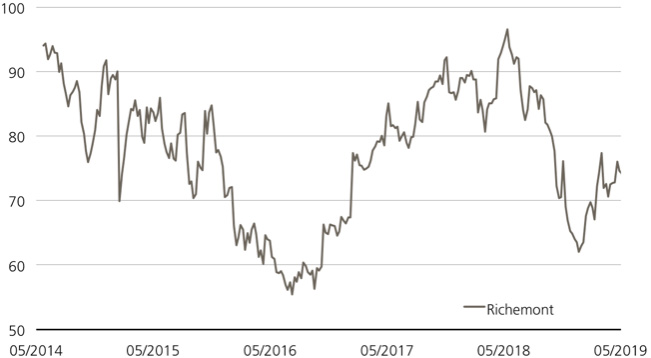
This material has been prepared by UBS AG or one of its affiliates («UBS»). This material is for distribution only as permitted by law. It is not prepared for the needs of any specific recipient. It is published solely for information and is not a solicitation or offer to buy or sell any securities or related financial instruments (“Instruments”). UBS makes no representation or warranty, either express or implied, on the completeness or reliability of the information contained in this document (“Information”) except that concerning UBS AG and its affiliates. The Information should not be regarded by recipients as a substitute for using their own judgment. Any opinions expressed in this material may change without notice and may be contrary to opinions expressed by other business areas of UBS as a result of using different assumptions or criteria. UBS is under no obligation to update the Information. UBS, its officers, employees or clients may have or have had an interest in the Instruments and may at any time transact in them. UBS may have or have had a relationship with entities referred to in the Information. Neither UBS nor any of its affiliates, or their officers or employees, accepts any liability for any loss arising from use of the Information. This presentation is not a basis for entering into a transaction. Any transaction between you and UBS will be subject to the detailed provisions of the term sheet, confirmation or electronic matching systems relating to that transaction. Clients wishing to effect transactions should contact their local sales representative.
This information is communicated by UBS AG and/or its affiliates («UBS»). * (see below) UBS may from time to time, as principal or agent, have positions in, or may buy or sell, or make a market in any securities, currencies, financial instruments or other assets underlying the product to which this website relates (the «Structured Product»). UBS may provide investment banking and other services to and/or have officers who serve as directors of the companies referred to in this website. UBS’s trading and/or hedging activities related to the Structured Product may have an impact on the price of the underlying asset and may affect the likelihood that any relevant barrier or relevant trigger event is crossed or triggered. UBS has policies and procedures designed to minimise the risk that officers and employees are influenced by any conflicting interest or duty and that confidential information is improperly disclosed or made available. UBS may pay or receive brokerage or retrocession fees in connection with the Structured Product described herein. In respect of any Structured Product that is a security, UBS may, in certain circumstances, sell the Structured Product to dealers and other financial institutions at a discount to the issue price or rebate to them for their own account some proportion of the issue price. Further information is available on request. Structured Products are complex and may involve a high risk of loss. Prior to purchasing the Structured Product you should consult with your own legal, regulatory, tax, financial and accounting advisors to the extent you consider it necessary, and make your own investment, hedging and trading decisions (including decisions regarding the suitability of the Structured Product) based upon your own judgement and advice from those advisers you consider necessary. Save as otherwise expressly agreed in writing, UBS is not acting as your financial adviser or fiduciary in relation to the Product. UBS generally hedges its exposure to Structured Products, although it may elect not to hedge or to partially hedge any Structured Product. UBS’s hedging activity may be conducted through transactions in the underlying asset, index or instrument or in options, futures or other derivatives related to the underlying asset, index or instrument on publicly traded markets or otherwise, and may have an impact on the price of the under-lying asset. If a transaction is cash settled, UBS will generally unwind or offset any hedge it has for such Structured Product in close proximity to the relevant valuation time or period. In some cases, this activity may affect the value of the Structured Product. Unless stated otherwise in this document, (i) this document is for information purposes only and should not be construed as an offer, personal recommendation or solicitation to purchase the Structured Product and should not be treated as giving investment advice, and (ii) the terms of any investment in the Structured Product will be exclusively subject to the detailed provisions, including risk considerations, contained in the more detailed legal documentation that relates to the Structured Product (being the confirmation, information memorandum, prospectus or other issuer documentation as relevant). UBS makes no representation or warranty relating to any information herein which is derived from independent sources. This document shall not be copied or reproduced without UBS’s prior written permission. In respect of any Structured Product that is a security, no action has been or will be taken in any jurisdiction that would permit a public offering of the Product, save where explicitly stated in the issuer documentation. The Structured Product must be sold in accordance with all applicable selling restrictions in the jurisdictions in which it is sold.
© UBS 2018. All rights reserved. UBS prohibits the forwarding of this information without the approval of UBS.
Weekly-Hits édition de 21.09.20182018-09-21T09:10:48+02:00

Weekly-Hits edition of 21.09.2018

KeyInvest Weekly Hits

Friday, 20.09.2018

keyinvest titel
  • Topic 1: Electric Car Beneficiaries Basket - Charged for the future
  • Topic 2: Richemont/LVMH/Swatch - Attractive risk-reward profile

Electric Car Beneficiaries Basket
Charged for the future

At the dawn of a new era marked by the change from the gasoline engine to electric cars, many people are wondering what the car of tomorrow will look like. The German premium manufacturer BMW recently provided an answer to this question with the unveiling of the iNext, a new self-driving electric car. The car is scheduled to enter series production from 2021 onwards. Nevertheless, it is not just manufacturers who are vying for pole position in this new sector; suppliers and the IT industry also have high hopes for the future innovations on four wheels. For example, chip manufacturer Infineon has long been following the trend of autonomous driving and driver assistance systems as well as e-mobility. Investors now have the opportunity to diversify and participate in the growth opportunities offered by the trend toward electric vehicles in the automotive industry. The PERLES on the “Electric Car Beneficiaries Basket” (symbol: ECARSU) fully participates in the performance of the share basket. The only deduction is an annual management fee of 0.5%. In return, any net dividends are reinvested in the basket members.

Although the electric car has not yet become a staple product, it has enjoyed enormous growth. The best example of this is China, which is by far the world’s foremost pioneer in terms of e-mobility. In the first half of 2018, around 412,000 electric cars were sold in the Middle Kingdom, more than twice as many as in the previous year. In the US, the world’s second-largest market for electric cars, the growth rate stood unmoving at 34%. According to the experts at the Center of Automotive Management (CAM), electric cars will gradually take over the roads. In 2020, they anticipate a global market share of 6%, which is expected to increase to 25% by 2025 and even to 40% by 2030. (Source: www.auto-institut.de) It is not only manufacturers who are wanting to get on-board with this trend – suppliers and IT corporations are also muscling in. For example, Continental has numerous technical products focused on e-mobility in the pipeline. These include the “New Wheel Concept”. By utilizing the strong braking effect in the energy recovery system, electric vehicles can move through city traffic almost without using the brakes. Automotive supplier, Aptiv – a spin-off of Delphi Automotive – already has a fleet of 30 self-driving vehicles in operation in the Lyft carpool network in Las Vegas.

The chip industry is also experiencing demand for the digitization of automobiles. The experts at Mordor Intelligence predict that the automotive semiconductor market will expand from USD 34.6 billion in 2017 to USD 92.9 billion in 2023 with an average annual growth rate of 17.9%. One of the beneficiaries of this trend is the previously mentioned Infineon. UBS experts believe the German semiconductor manufacturer to be well positioned in both silicon and silicon carbide technology. (Source: UBS CIO WM, Semis: Who’s powering Tesla’s Model 3?, 15.08.2018)

Opportunities: The primary research experts at the UBS Evidence Lab attempted to identify the winners in the electric car trend, breaking down electric vehicles into their component parts. In the end, a committee of experts filtered out eight promising groups from the supplier industry and the IT industry. Based on these results the “Electric Car Beneficiaries Basket” has been combined. With the PERLES (symbol: ECARSU) on the new share basket, investors now have the opportunity to make a diversified investment in this future-oriented area. The product currently in subscription tracks the performance of the underlying basket – after the deduction of the annual management fee of 0.5%. The net dividends are reinvested in the basket. The security matures after seven years. However, the issuer has the option of extending the term by a further seven years.

Risks: PERLES do not have capital protection. If the underlying asset records a negative performance, this would therefore result in commensurate losses in the structured product. Investors in structured products are also exposed to issuer risk, which means that the capital invested may be lost if UBS AG becomes insolvent, regardless of the performance of the underlying.

More UBS products and further information on the risks and opportunities are available at ubs.com/keyinvest.

Continental vs. Denso vs. Valeo (5 years)¹

chart continental

Continental, Denso and Valeo – the three automotive suppliers for the Electric Car Beneficiaries Basket show positive development on a five-year basis. The French company, Valeo, recorded the largest growth.

Source: UBS AG, Bloomberg

As of 20.09.2018

Infineon vs. Intel (5 years)¹

chart infineon

Semiconductors are playing an increasingly important role in the automotive industry. The two giants in the world of chip manufacturing, Infineon and Intel, are thus included in the Electric Car Beneficiaries Basket. Both shares are trending upwards.

Source: UBS AG, Bloomberg

As of: 20.09.2018

¹) Please be aware that past performance does not indicate future results.
²) The conditions of ETTs are reviewed on a yearly basis and can be adjusted with a deadline of 13 months after the announcement.

PERLES on Electric Car Beneficiaries Basket

Symbol ECARSU
SVSP Name Tracker-Certificate
SPVSP Code 1300
Underlying Electric Car Beneficiaries Basket
Ratio 1:1
Currency CHF
Administration fee 0.50% p.a.
Participation 100%
Expiry 26.09.2025
Issuer UBS AG, London
Subscription until 27.09.2018, 15:00h
 

Starting composition and weighting of the Electric Car Beneficiaries Baskets

Continental AG 12.50%
Denso Corp 12.50%
VALEO SA 12.50%
Aptiv PLC 12.50%
Lear Corp 12.50%
Tenneco Inc 12.50%
Infineon Tec. AG 12.50%
Intel Corp 12.50%

More UBS products and further information on the risks and opportunities are available at ubs.com/keyinvest.

Source: UBS AG, Bloomberg

As of: 20.09.2018

Market overview

Index Quotation Week¹
SMI™ 8’939.85 -0.2%
SLI™ 1’465.10 0.2%
S&P 500™ 2’907.95 0.7%
Euro STOXX 50™ 3’368.56 1.3%
S&P™ BRIC 40 3’972.45 3.6%
CMCI™ Compos. 930.19 -0.4%
Gold (troy ounce) 1’208.30 -0.2%

¹ Change based on the closing price of the previous day compared to the closing price a week ago.

SMI™ vs. VSMI™ 1 year

smi vs vsmi

The VSMI™ Index is calculated since 2005. It shows the volatility of the stocks within the SMI™ index. A portfolio which reacts only to changes in volatility instead of volatility itself is relevant for the calculation. Thereby, the VSMI™ methodology uses the squared volatility, known as variance, of the SMI options with remaining time to expiry of 30 days traded at the Eurex.

Source: UBS AG, Bloomberg

As of: 20.09.2018

Richemont/LVMH/Swatch
Attractive risk-reward profile

Suppliers of luxury goods are currently operating in a favorable environment: In addition to strong equity markets, UBS CIO WM believes that rising real estate prices and a growing middle class, particularly in Asia, are playing into the hands of the sector. However, the simmering trade dispute represents a threat to the entire consumer goods industry and thus also for the luxury segment. In this respect, a partially protected positioning might be interesting for investors. The new Callable Kick-In GOAL on Richemont, LVMH and Swatch (symbol: KCMHDU) offers a safety buffer of 40%. Provided that none of the three luxury equities impinge on this buffer during the two-year term, the product will yield the maximum return of 7.00% p.a. upon maturity.

UBS CIO WM assumes that the factors outlined above will remain robust for the time being. In addition, China is likely to remain a growth driver for the luxury sector in the medium term. In parallel to this, the watch market should experience a healthy revival. However, analysts also stress that political uncertainties could negatively impact the economic climate and consumer confidence. UBS CIO WM currently prefers luxury companies with good organic growth prospects or the potential for successful restructuring, as well as attractive valuations. (Source: UBS CIO WM European Consumer Discretionary, Equity preferences, 28.08.2018) The latest figures from LVMH provide evidence of the positive industry environment. The French group enjoyed a 28% increase in profits in the first six months of 2018 and thus exceeded analysts’ expectations. There has been great demand for the luxury watches, clothing and high-priced jewelry sold by this industry giant, particularly in China. (Source: Thomson Reuters media report, 24.07.2018)

Opportunities: Together with the two Swiss watch manufacturers Richemont and Swatch, LVMH acts as the underlying for a new Callable Kick-In GOAL (symbol: KCMHDU). Irrespective of the performance of the three equities, the new issue will pay out a coupon of 7% p.a. This return opportunity enjoys low barriers of 60% of the initial price level. Please note that an early redemption including a proportionate coupon amount is possible with this Kick-In GOAL. The issuer is entitled to cancel the product for the first time on September 26, 2019, and subsequently every three months thereafter.

Risks: This product does not have capital protection. If the underlyings touch or fall below the respective Kick-In Level (barrier) and the callable feature does not apply, the amount repaid on the maturity date is reflecting the worst performance of the underlyings (but not more than notional value plus coupon). In this case, it is likely that losses will be incurred. Investors in structured products are also exposed to issuer risk, which means that the capital invested may be lost if UBS AG becomes insolvent, regardless of the performance of the underlying.

More UBS products and further information on the risks and opportunities are available at ubs.com/keyinvest.

Richemont vs. LVMH vs. Swatch (5 years)¹

Source: UBS AG, Bloomberg

As of: 20.09.2018

7.00% p.a. Callable Kick-In GOAL on Richemont/ LVMH/ Swatch

Symbol KCMHDU
SVSP Name Barrier Reverse Convertible
SPVSP Code 1230 (Callable)
Underlyings Richemont / LVMH / Swatch
Currency CHF (Quanto)
Coupon 7.00% p.a.
Kick-In Level 60.00%
Expiry 28.09.2020
Issuer UBS AG, London
Subscription until 26.09.2018, 15:00 Uhr
 

More UBS products and further information on the risks and opportunities are available at ubs.com/keyinvest.

Source: UBS AG, Bloomberg

As of: 20.09.2018

¹) Please be aware that past performance does not indicate future results.
²) The conditions of ETTs are reviewed on a yearly basis and can be adjusted with a deadline of 13 months after the announcement.

This material has been prepared by UBS AG or one of its affiliates («UBS»). This material is for distribution only as permitted by law. It is not prepared for the needs of any specific recipient. It is published solely for information and is not a solicitation or offer to buy or sell any securities or related financial instruments (“Instruments”). UBS makes no representation or warranty, either express or implied, on the completeness or reliability of the information contained in this document (“Information”) except that concerning UBS AG and its affiliates. The Information should not be regarded by recipients as a substitute for using their own judgment. Any opinions expressed in this material may change without notice and may be contrary to opinions expressed by other business areas of UBS as a result of using different assumptions or criteria. UBS is under no obligation to update the Information. UBS, its officers, employees or clients may have or have had an interest in the Instruments and may at any time transact in them. UBS may have or have had a relationship with entities referred to in the Information. Neither UBS nor any of its affiliates, or their officers or employees, accepts any liability for any loss arising from use of the Information. This presentation is not a basis for entering into a transaction. Any transaction between you and UBS will be subject to the detailed provisions of the term sheet, confirmation or electronic matching systems relating to that transaction. Clients wishing to effect transactions should contact their local sales representative.
This information is communicated by UBS AG and/or its affiliates («UBS»). * (see below) UBS may from time to time, as principal or agent, have positions in, or may buy or sell, or make a market in any securities, currencies, financial instruments or other assets underlying the product to which this website relates (the «Structured Product»). UBS may provide investment banking and other services to and/or have officers who serve as directors of the companies referred to in this website. UBS’s trading and/or hedging activities related to the Structured Product may have an impact on the price of the underlying asset and may affect the likelihood that any relevant barrier or relevant trigger event is crossed or triggered. UBS has policies and procedures designed to minimise the risk that officers and employees are influenced by any conflicting interest or duty and that confidential information is improperly disclosed or made available. UBS may pay or receive brokerage or retrocession fees in connection with the Structured Product described herein. In respect of any Structured Product that is a security, UBS may, in certain circumstances, sell the Structured Product to dealers and other financial institutions at a discount to the issue price or rebate to them for their own account some proportion of the issue price. Further information is available on request. Structured Products are complex and may involve a high risk of loss. Prior to purchasing the Structured Product you should consult with your own legal, regulatory, tax, financial and accounting advisors to the extent you consider it necessary, and make your own investment, hedging and trading decisions (including decisions regarding the suitability of the Structured Product) based upon your own judgement and advice from those advisers you consider necessary. Save as otherwise expressly agreed in writing, UBS is not acting as your financial adviser or fiduciary in relation to the Product. UBS generally hedges its exposure to Structured Products, although it may elect not to hedge or to partially hedge any Structured Product. UBS’s hedging activity may be conducted through transactions in the underlying asset, index or instrument or in options, futures or other derivatives related to the underlying asset, index or instrument on publicly traded markets or otherwise, and may have an impact on the price of the under-lying asset. If a transaction is cash settled, UBS will generally unwind or offset any hedge it has for such Structured Product in close proximity to the relevant valuation time or period. In some cases, this activity may affect the value of the Structured Product. Unless stated otherwise in this document, (i) this document is for information purposes only and should not be construed as an offer, personal recommendation or solicitation to purchase the Structured Product and should not be treated as giving investment advice, and (ii) the terms of any investment in the Structured Product will be exclusively subject to the detailed provisions, including risk considerations, contained in the more detailed legal documentation that relates to the Structured Product (being the confirmation, information memorandum, prospectus or other issuer documentation as relevant). UBS makes no representation or warranty relating to any information herein which is derived from independent sources. This document shall not be copied or reproduced without UBS’s prior written permission. In respect of any Structured Product that is a security, no action has been or will be taken in any jurisdiction that would permit a public offering of the Product, save where explicitly stated in the issuer documentation. The Structured Product must be sold in accordance with all applicable selling restrictions in the jurisdictions in which it is sold.
© UBS 2018. All rights reserved. UBS prohibits the forwarding of this information without the approval of UBS.
Weekly-Hits edition of 21.09.20182018-09-21T09:10:06+02:00

Weekly-Hits édition de 14.09.2018

KeyInvest Weekly Hits

Vendredi, 14.09.2018

keyinvest Nahrungsmittel
  • Thème 1: Fabricants de denrées alimentaires - La nourriture a toujours le vent en poupe
  • Thème 2: Grands groupes suisses - De nombreuses surprises positives

Fabricants de denrées alimentaires
La nourriture a toujours le vent en poupe

Nous régalons nos papilles tout au long de l’année. En été, ce sont les grillades, en hiver, les menus de fête se multiplient à l’approche de Noël, au printemps et en automne, on retrouve sur notre table des délices culinaires tels que le lapin de Pâques en chocolat ou le potiron. La nourriture a donc toujours le vent en poupe, et ce même lorsque l’économie est plus morose. En conséquence, on considère volontiers ce secteur comme défensif, avec une sensibilité relativement modeste à la conjoncture. En outre, la hausse de la population mondiale et l’accroissement de la prospérité dans les pays émergents en stimulent la croissance. Avec l’UBS ETT (symbole: ETFOO) sur le STOXX™ Europe 600 Food & Beverage Index, il est possible de participer à l’évolution des cours des plus grands groupes agroalimentaires européens de manière diversifiée.² Les investisseurs souhaitant optimiser leur rendement pourraient apprécier le nouveau Callable Worst of Kick-In GOAL (symbole: KCKHDU) sur Danone, Mondelez, Nestlé et Lindt & Sprüngli. Le produit proposé en souscription dispose d’une barrière de 55 pour cent des valeurs initiales et d’un coupon de 5,00 pour cent par an.

Aux quatre coins de la planète, les grands groupes agroalimentaires se portent bien actuellement. Pour la période sous revue qui vient de s’achever, Nestlé a créé l’événement (cf. également page 3). Mark Schneider, son nouveau PDG, remet en forme le leader mondial grâce à une transformation ciblée. Au cours des six premiers mois de 2018, la croissance organique corrigée des effets exceptionnels a augmenté de 2,8 pour cent. Et ce rythme pourrait même s’accélérer au second semestre. Mark Schneider prévoit en effet une hausse d’environ 3 pour cent. Compatriote Lindt & Sprüngli est également en pleine expansion. Notamment grâce à une bonne évolution dans les pays émergents, les recettes en monnaies locales ont progressé de 5,1 pour cent, le bénéfice semestriel a même augmenté de manière disproportionnée (+ 12,7 pour cent). Pour le moyen à long terme, Lindt & Sprüngli vise à renforcer sa rentabilité de 20 à 40 points de base. De plus, Mondelez a créé la surprise. Le deuxième fabricant mondial de sucreries a dépassé les attentes avec son rapport intermédiaire au deuxième trimestre. Le groupe américain bénéficie actuellement d’une part de la politique stricte de la direction en matière de dépenses, et d’autre part de l’augmentation des ventes de chocolats Cadbury et de gâteaux Oreo. Le fabricant de yogourts leader, Danone, a également continué à développer son activité en 2018. Toutefois, le Français connaît actuellement des difficultés au Maroc. Les utilisateurs reprochent à l’entreprise d’abuser de sa situation dominante sur le marché pour pratiquer des prix excessifs. Cécile Cabanis, CFO du groupe, garde son sang-froid et prévoit que les pertes de chiffre d’affaires marocaines pourront être compensées ailleurs. En conséquence, les objectifs globaux pour l’année ont été confirmés.

Opportunités: les grands groupes agroalimentaires cités constituent le quatuor sous-jacent du nouveau Callable Worst of Kick-In GOAL (symbole: KCKHDU). Le produit proposé en souscription est doté d’une échéance maximale de trois ans et d’un coupon de 5,00 pour cent par an. Le remboursement anticipé du produit peut avoir lieu pour la première fois au bout d’un an, puis tous les trois mois. Le Kick-In Level s’établit à 64 pour cent de chaque sous-jacent. Les investisseurs recherchant un placement encore plus diversifié disposeront d’un instrument très adapté avec l’ETT (symbole: ETFOO) sur le STOXX™ Europe 600 Food & Beverage Index. Le produit participe à l’identique et sans limitation de durée à l’évolution du secteur européen des denrées alimentaires. Actuellement, il englobe 22 titres.

Risques: il n’existe aucune protection du capital pour les produits. Une évolution négative de la valeur des sous-jacents génère des pertes correspondantes pour l’ETT. En revanche, les Worst of Kick-In GOAL bénéficient d’une protection du capital sous conditions. Si, pendant la durée de l’investissement, l’un des sous-jacents atteint une seule fois la barrière respective («Kick-In Level») ou est inférieur à celle-ci, et que la fonction de Callable ne s’applique pas, le remboursement par amortissement en espèces à l’échéance est basé sur la performance la plus faible (base Strike) du quatuor (au maximum toutefois à la valeur nominale majorée du coupon). Dans un tel cas, des pertes sont probables. Par ailleurs, avec les produits structurés, l’investisseur supporte le risque d’émetteur. Cela signifie qu’en cas d’insolvabilité d’UBS SA, le capital investi peut être perdu, indépendamment de l’évolution du sous-jacent.

Vous trouverez davantage de produits UBS et des informations sur les opportunités et les risques à l’adresse ubs.com/keyinvest.

STOXX™ Europe 600 Food & Beverage Index (5 ans)¹

stoxxEurope600

Même si la dynamique a quelque peu faibli récemment, sur cinq ans, le STOXX™ Europe 600 Food & Beverage Index affiche un mouvement régulier à la hausse.

Source: UBS AG, Bloomberg

Valeurs du: 13.09.2018

Danone vs. Mondelez vs. Nestlé vs. Lindt & Sprüngli (5 ans)¹

danone

Les grands groupes alimentaires Danone, Mondelez, Nestlé et Lindt & Sprüngli
ont évolué à la hausse à des rythmes différents. Avec un plus de 78 pour cent, le fabricant de chocolats de qualité a une longueur d’avance.

Source: UBS AG, Bloomberg

Valeurs du: 13.09.2018

¹) La performance passée n’indique pas les résultats futures.
²) Les condition des ETTs sont vérifiés annuellement et peuvent être ajustées avec un délai de 13 mois après la publication.

ETT sur STOXX™ Europe 600 Food & Beverage Index

Symbol ETFOO
SVSP Name Tracker-Zertifikat
SPVSP Code 1300
Sous-jacent STOXX™ Europe 600 Food & Beverage NR Index
Rapport de souscription 1:1
Devise EUR
Frais de gestion 0.00% p.a.
Participation 100%
Echéance Open End
Émetteur UBS AG, London
Bid/Ask EUR 1’225.00 / 1’232.00
 

5.00% p.a. Callable Worst of Kick-In GOAL sur Danone, Mondelez, Nestlé, Lindt & Sprüngli

Symbol KCKHDU
SVSP Name Barrier Reverse Convertible
SPVSP Code 1230 (Callable)
Sous-jacent Danone, Mondelez, Nestlé, Lindt & Sprüngli
Devise CHF (Quanto)
Coupon 5.00% p.a.
Kick-In Level 55.00%
Echéance 20.09.2021
Émetteur UBS AG, London
Date de fixation du prix 19.09.2018, 15:00h
 

Vous trouverez davantage de produits UBS et des informations sur les opportunités et les risques à l’adresse ubs.com/keyinvest.

Source: UBS AG, Bloomberg

Valeurs du: 13.09.2018

Apérçu du marché

Index Citation Semaine¹
SMI™ 8’960.13 1.0%
SLI™ 1’462.36 0.8%
S&P 500™ 2’888.92 0.0%
Euro STOXX 50™ 3’326.60 0.3%
S&P™ BRIC 40 3’833.53 -1.8%
CMCI™ Compos. 933.75 1.3%
Gold (once troy) 1’210.90 0.8%

¹ Changement basé sur le cours de clôture du jour précédent par rapport au cours de clôture de la semaine dernière.

SMI™ vs. VSMI™ 1 année

smi vs vsmi

L’index VSMI™ est calculé depuis 2005. Il affiche la volatilité des actions inclus dans le SMI™ index. Pour la calculation, un portefeuille est utilisé qui ne réagit qu’au variations de la volatilité au lieu des variations des prix. En le faisant, la méthodologie du VSMI™ utilise la volatilité carré, connu sous le terme variance, des options sur le SMI avec 30 jours jusqu’à l’échéance négociées à la Bourse Eurex.

Source: UBS AG, Bloomberg

Valeurs du: 13.09.2018

Grands groupes suisses
De nombreuses surprises positives

Lundi, avec Richemont, le dernier des 20 membres du SMI™ a présenté son rapport intermédiaire pour la saison sous revue en cours. La conclusion globale parle d’elle-même: les résultats des trois quarts des Blue Chips suisses ont dépassé les attentes de la communauté financière. Cela concerne aussi bien les trois poids lourds que sont Nestlé, Novartis et Roche, que par exemple le groupe d’assurances Zurich Insurance. Le nouveau Callable Worst of Kick-In GOAL (symbole: KCKEDU) a été composé sur la base de ces quatre titres du SMI™. Le produit est encore disponible en souscription jusqu’au 19 septembre et propose un coupon correspondant à 5,00 pour cent en versements trimestriels. Cette opportunité de rendement est associée à une marge de sécurité initiale de 46 pour cent.

Roche a créé l’événement de cette période de bilan la plus récente. Le premier fabricant mondial de médicaments anti-cancéreux a non seulement enregistré sa plus forte croissance depuis presque cinq ans, mais il a également relevé ses perspectives. Pour l’exercice en cours, il s’attend désormais à une hausse du chiffre d’affaires d’un pourcentage moyen à un chiffre. En avril déjà, Roche avait relevé ses prévisions de croissance des bénéfices d’un pourcentage faible à un chiffre. Pour son concurrent local Novartis, le premier semestre s’est également bien déroulé. Par exemple, le secteur des médicaments pour les yeux, qui devrait entrer en bourse au premier semestre 2019, a enregistré une hausse de 14 pour cent de son bénéfice opérationnel corrigé. Compte tenu du succès remporté ces six premiers mois, les prévisions de chiffre d’affaires et de bénéfices pour l’année ont été confirmées. Alors que Nestlé a abaissé son objectif de croissance de «2 à 4 pour cent» à désormais «3 pour cent», Zurich Insurance est resté fidèle à ses objectifs à moyen terme. «À la mi-temps de la période stratégique triennale, nous sommes sur la bonne voie pour réaliser tous les objectifs fixés d’ici fin 2019», a expliqué Mario Greco, directeur général du groupe. (Source: Thomson Reuters, revue de presse, 09.08.2018)

Opportunités: les quatre titres SMI™ sous-jacents du Callable Worst of Kick-In GOAL (symbole: KCKEDU) permettent de bénéficier d’un coupon de 5,00 par an qui sera versé pour la première fois le 27 décembre, sur une base trimestrielle et indépendamment de l’évolution du cours des sous-jacents. Actuellement, le remboursement du nominal (1000 francs) est couplé aux actions. Le quatuor dispose d’une marge confortable de sécurité de 46 pour cent. Si ce matelas résiste jusqu’à échéance, le rendement maximal sera atteint. Compte tenu de la fonction Callable, le produit peut être remboursé de manière anticipée, pour la première fois après un an.

Risques: il n’existe aucune protection du capital pour le produit présenté. Si, pendant la durée de l’investissement, l’un des sous-jacents atteint une seule fois la barrière respective («Kick-In Level») ou est inférieur à celle-ci, et que la fonction de Callable ne s’applique pas, le remboursement par amortissement en espèces à l’échéance est basé sur la performance la plus faible (base Strike) du quatuor (au maximum toutefois à la valeur nominale majorée du coupon). Dans un tel cas, des pertes sont probables. Par ailleurs, avec les produits structurés, l’investisseur supporte le risque d’émetteur. Cela signifie qu’en cas d’insolvabilité d’UBS SA, le capital investi peut être perdu, indépendamment de l’évolution du sous-jacent.

Vous trouverez davantage de produits UBS et des informations sur les opportunités et les risques à l’adresse ubs.com/keyinvest.

Nestlé vs. Novartis vs. Roche vs. Zurich Insurance (5 ans)¹

nestle

Source: UBS AG, Bloomberg

Valeurs du: 13.09.2018

5.00% p.a. Callable Worst of Kick-In GOAL sur Nestlé, Novartis, Roche, Zurich Insurance

Symbol KCKEDU
SVSP Name Barrier Reverse Convertible
SPVSP Code 1230 (Callable)
Sous-jacent Nestlé, Novartis, Roche, Zurich Insurance
Devise CHF
Coupon 5.00% p.a.
Kick-In Level 54.00%
Echéance 20.09.2021
Émetteur UBS AG, London
Date de fixation du prix 19.09.2018, 15:00h
 

Vous trouverez davantage de produits UBS et des informations sur les opportunités et les risques à l’adresse ubs.com/keyinvest.

Source: UBS AG, Bloomberg

Valeurs du: 13.09.2018

¹) La performance passée n’indique pas les résultats futures.
²) Les condition des ETTs sont vérifiés annuellement et peuvent être ajustées avec un délai de 13 mois après la publication.
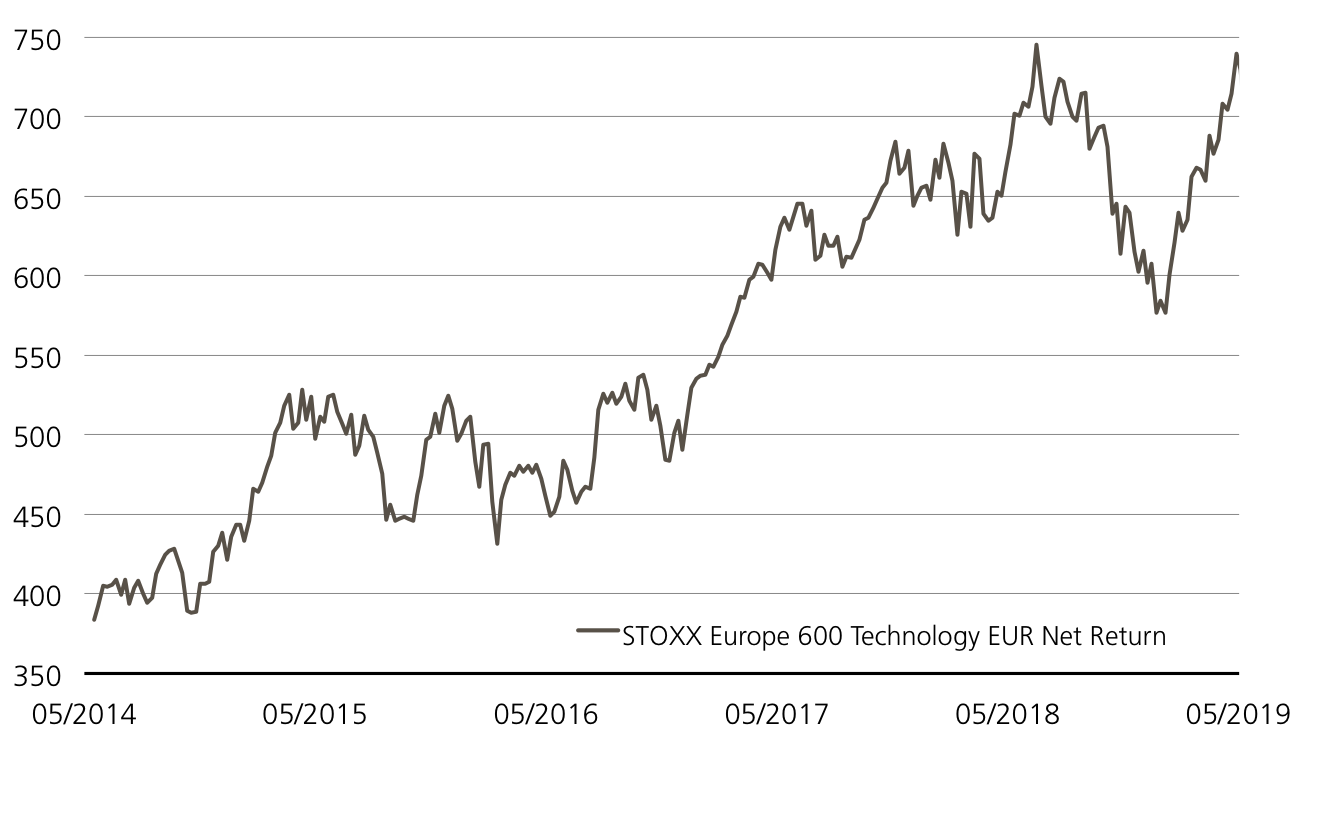
This material has been prepared by UBS AG or one of its affiliates («UBS»). This material is for distribution only as permitted by law. It is not prepared for the needs of any specific recipient. It is published solely for information and is not a solicitation or offer to buy or sell any securities or related financial instruments (“Instruments”). UBS makes no representation or warranty, either express or implied, on the completeness or reliability of the information contained in this document (“Information”) except that concerning UBS AG and its affiliates. The Information should not be regarded by recipients as a substitute for using their own judgment. Any opinions expressed in this material may change without notice and may be contrary to opinions expressed by other business areas of UBS as a result of using different assumptions or criteria. UBS is under no obligation to update the Information. UBS, its officers, employees or clients may have or have had an interest in the Instruments and may at any time transact in them. UBS may have or have had a relationship with entities referred to in the Information. Neither UBS nor any of its affiliates, or their officers or employees, accepts any liability for any loss arising from use of the Information. This presentation is not a basis for entering into a transaction. Any transaction between you and UBS will be subject to the detailed provisions of the term sheet, confirmation or electronic matching systems relating to that transaction. Clients wishing to effect transactions should contact their local sales representative.
This information is communicated by UBS AG and/or its affiliates («UBS»). * (see below) UBS may from time to time, as principal or agent, have positions in, or may buy or sell, or make a market in any securities, currencies, financial instruments or other assets underlying the product to which this website relates (the «Structured Product»). UBS may provide investment banking and other services to and/or have officers who serve as directors of the companies referred to in this website. UBS’s trading and/or hedging activities related to the Structured Product may have an impact on the price of the underlying asset and may affect the likelihood that any relevant barrier or relevant trigger event is crossed or triggered. UBS has policies and procedures designed to minimise the risk that officers and employees are influenced by any conflicting interest or duty and that confidential information is improperly disclosed or made available. UBS may pay or receive brokerage or retrocession fees in connection with the Structured Product described herein. In respect of any Structured Product that is a security, UBS may, in certain circumstances, sell the Structured Product to dealers and other financial institutions at a discount to the issue price or rebate to them for their own account some proportion of the issue price. Further information is available on request. Structured Products are complex and may involve a high risk of loss. Prior to purchasing the Structured Product you should consult with your own legal, regulatory, tax, financial and accounting advisors to the extent you consider it necessary, and make your own investment, hedging and trading decisions (including decisions regarding the suitability of the Structured Product) based upon your own judgement and advice from those advisers you consider necessary. Save as otherwise expressly agreed in writing, UBS is not acting as your financial adviser or fiduciary in relation to the Product. UBS generally hedges its exposure to Structured Products, although it may elect not to hedge or to partially hedge any Structured Product. UBS’s hedging activity may be conducted through transactions in the underlying asset, index or instrument or in options, futures or other derivatives related to the underlying asset, index or instrument on publicly traded markets or otherwise, and may have an impact on the price of the under-lying asset. If a transaction is cash settled, UBS will generally unwind or offset any hedge it has for such Structured Product in close proximity to the relevant valuation time or period. In some cases, this activity may affect the value of the Structured Product. Unless stated otherwise in this document, (i) this document is for information purposes only and should not be construed as an offer, personal recommendation or solicitation to purchase the Structured Product and should not be treated as giving investment advice, and (ii) the terms of any investment in the Structured Product will be exclusively subject to the detailed provisions, including risk considerations, contained in the more detailed legal documentation that relates to the Structured Product (being the confirmation, information memorandum, prospectus or other issuer documentation as relevant). UBS makes no representation or warranty relating to any information herein which is derived from independent sources. This document shall not be copied or reproduced without UBS’s prior written permission. In respect of any Structured Product that is a security, no action has been or will be taken in any jurisdiction that would permit a public offering of the Product, save where explicitly stated in the issuer documentation. The Structured Product must be sold in accordance with all applicable selling restrictions in the jurisdictions in which it is sold.
© UBS 2018. All rights reserved. UBS prohibits the forwarding of this information without the approval of UBS.
Weekly-Hits édition de 14.09.20182018-09-14T09:36:54+02:00
Go to Top