About ubs-ch

This author has not yet filled in any details.
So far ubs-ch has created 398 blog entries.

Börsenausblick: Worauf Anleger jetzt achten sollten

KeyInvest Blog

Montag, 24. September 2018

Börsenausblick: Worauf Anleger jetzt achten sollten

Während die starke Konjunktur und wachsende Unternehmensgewinne für steigende Kurse sprechen, stellt der Handelsstreit ein echtes Risiko für die globalen Akteinmärkte dar. Wir zeigen, wie UBS CIO GWM die weiteren Aussichten einschätzt und zu welcher Ausrichtung die Kapitalmarktprofis den Investoren raten.

An der Börse gibt es keine Verschnaufpausen. Nahezu ununterbrochen laufen Meldungen, Konjunkturindikatoren oder Unternehmensresultate über den Ticker. In den vergangenen Jahren überwogen dabei die positiven Schlagzeilen. So legte beispielsweise die Weltwirtschaft in 2016 um 3.2 Prozent zu, 2017 waren es 3.8 Prozent und nach Prognosen des Internationalen Währungsfonds soll das Bruttoinlandsprodukt im laufenden Jahr gar um 3.9 Prozent expandieren. In guter Form präsentierten sich zuletzt auch die Unternehmen. Laut Datenspezialist Factset haben die S&P 500TM-Unternehmen 2017 ihr Ergebnis je Aktie im Schnitt um 10.8 Prozent steigern können, beim STOXXTM 600 errechnet sich ein Plus von 14.5 Prozent. Das Wachstum der globalen Konjunktur und Unternehmensgewinnen bescherten den Aktienmärkten einen steten Aufwärtstrend. 2018 bestimmt dagegen ein negativ behaftetes Schlagwort zusehendes den Newsflow: Protektionismus. Der Handelsstreit und seine möglichen Folgen halten die Investoren rund um den Globus in Atem.

In der Zoll-Spirale

Getreu seinem Motto «America First!» verfolgt vor allem Donald Trump eine protektionistische Handelspolitik. Bereits im Januar 2018 kündigte der US-Präsident Zölle auf importierte Solarmodule und Waschmaschinen an, welche am 7. Februar in Kraft traten. Nachdem die Staaten im März Abgaben auf Stahl- und Aluminiumeinfuhren verhängt hatten, verschärfte der Präsident die Tonart immer weiter und nahm dabei China ins Visier: Anfang Juli führten die USA Zölle auf Waren im Wert von 34 Milliarden US-Dollar ein, die aus dem Reich der Mitte importiert werden. Peking verhängte postwendend einen Obolus auf US-Einfuhren in gleichem Umfang. (Quelle: Thomson Reuters Medienbericht, 06.07.2018)

Noch können die skizzierten Auseinandersetzungen den Börsen relativ wenig anhaben. Der MSCITM World Index bewegte sich Mitte August 2018 knapp über dem Niveau von Ende 2017. An der Wall Street herrschte sogar eine ausgeprägte Kauflaune. Der US-Leitindex S&P 500TM notierte zum Stichtag nur knapp unter dem Allzeithoch. Derweil verlaufen die Aktienmärkte auf dem alten Kontinent mehr oder weniger in einem Seitwärtstrend.* Mark Haefele, Chief Investment Officer (CIO) im Global Wealth Management (GWM) von UBS, führt den nach wie vor bestehenden Optimismus auf gute Unternehmensgewinne, ermutigenden US-Beschäftigungsdaten sowie eine geringere Zahl an negativen Konjunkturüberraschungen in der Eurozone zurück.

Das Negativ-Szenario

Allerdings könnten die Märkte seiner Ansicht nach die von den Zöllen ausgehende Gefahr unterschätzen. Das gilt laut Haefele vor allem für mögliche Zweitrundeneffekte oder zollfremde Massnahmen. Dem Experten zufolge werden die Zölle zwangsläufig die Versorgungsketten beeinträchtigen, sobald sie eine ausreichende Verbreitung erreichen. Da die US-Wirtschaft nicht besonders abhängig von der Nachfrage aus China ist, könnte Peking alternative Massnahmen ergreifen. Neben offensichtlichen Schritten wie der Schwächung der Währung oder dem Verkauf von US-Treasuries zählt Haefele die Drosselung der Lieferung wichtiger Komponenten in die USA sowie die Belastung von US-Unternehmen mit mehr Bürokratie zu Pekings Optionen.

Dem CIO zufolge könnten Zweitrunden- der zollfremde Massnahmen viel stärkere negative Auswirkungen auf das Wirtschaftswachstum und die Unternehmensgewinne haben. Das gelte vor allem dann, wenn sie Chinas Fähigkeiten beeinträchtigen, die notwendigen Strukturreformen oder den Schuldenabbau zu bewerkstelligen. UBS CIO GWM hat auf die skizzierten Risiken reagiert und die übergewichtete Position in globalen Aktien zurückgefahren.

Grund zum Optimismus

Grundsätzlich erachtet es Haefele jedoch als wichtig, investiert zu bleiben. Er hält es für durchaus möglich, dass sich jüngsten Zollandrohungen als Verhandlungstaktik erweisen. Wäre diese der Fall, blieben die Aussichten freundlich. In der Vergangenheit war es dem CIO zufolge eher falsch, zu vorsichtig als zu optimistisch zu agieren. Marc Haefele begründet diese These mit der historischen Entwicklung des S&PTM 500: In der Nachkriegszeit hat der US-Leitindex in Zeiträumen von sechs Monaten 2.3 Mal häufiger positive als negative Renditen erzielt. Bei einem Betrachtungszeitraum von fünf Jahren lag die entsprechende Quote sogar bei 5.8. (Quelle: UBS House View Monthly Letter, 19.07.2018)

Alles in allem käme es für Investoren nun zunächst darauf an, kein übermässiges Risiko einzugehen und sich auf das kurzfristige Abwärtspotenzial vorzubereiten. Haefele sieht verschiedene Möglichkeiten, mit denen sich Anleger für Portfoliowachstum positionieren, aber auch die kurzfristigen Risiken begrenzen können: Dazu zählt er beispielsweise die Beimischung von alternativen Anlagen wie Hedge Funds oder die Diversifikation über Länder und Sektoren. Als weiteres Instrument nennt der Kapitalmarktprofi die Anlage in Vermögenswerten, die von langfristigen Trends profitieren. Vor allem Aktien aus den Bereichen E-Commerce und Software haben zuletzt eine Outperformance erwirtschaft. Dahinter verbergen sich häufig Geschäftsmodelle, die von strukturellen Entwicklungen wie Bevölkerungswachstum und -alterung sowie Urbanisierung profitieren. Haefele hält solche Unternehmen für besser positioniert, um den Wachstums- und Handelssorgen standzuhalten, als stärker vom Konjunkturzyklus abhängige Gesellschaften. (Quelle: UBS House View Monthly Letter, 19.07.2018)

* Bitte beachten Sie, dass vergangene Wertentwicklungen keine Indikationen für künftige Wertentwicklungen sind.

Weitere Blogeinträge:

Ungewisses Finale

Von einem Endspurt kann an den Börsen noch keine Rede sein. Im Gegenteil, in der vergangenen Woche setzte sich die Phase der Verunsicherungen weiter fort.

Emsige Betriebsamkeit an den Märkten

Am Sonntag läutete der erste Advent die eigentlich ruhige und besinnliche Zeit des Jahres ein. Doch von Ruhe können Börsianer nur träumen, viel zu viele bewegende Ereignisse prasseln derzeit auf die Märkte ein.

Entflechtung in Basel

Follow us on LinkedIn 22. November 2021 Entflechtung in Basel Die Gewinnserie beim SMI® Index hat gehalten. Der heimische Benchmark konnte die siebte Handelswoche nacheinander mit positiven [...]

Börsenausblick: Worauf Anleger jetzt achten sollten2018-10-25T07:50:39+02:00

Weekly-Hits édition de 21.09.2018

KeyInvest Weekly Hits

Vendredi, 21.09.2018

keyinvest titel
  • Thème 1: Electric Car Beneficiaries Basket - Une bonne charge d’électricité pour aborder l’avenir
  • Thème 2: Richemont / LVMH / Swatch - Un profil risque-opportunité intéressant

Fabricants de denrées alimentaires
La nourriture a toujours le vent en poupe

En plein tournant d’une époque, entre le moteur à essence et le moteur électrique, de nombreuses questions sur l’apparence de la voiture du futur se posent. Le constructeur allemand de véhicules haut de gamme BMW a récemment apporté une réponse en présentant l’iNext, une nouvelle voiture électrique autonome. Cette voiture devrait voir le jour en 2021, dans sa version de série. Et les constructeurs ne sont pas les seuls à se battre pour être en pole position. Les fournisseurs de même que l’industrie IT attendent beaucoup des nouveaux véhicules du futur sur quatre roues. Par exemple, le fabricant de puces Infineon suit depuis longtemps la tendance des voitures autonomes et des systèmes de conduite assistée ainsi que de l’e-mobilité. Désormais, la possibilité de participer aux opportunités de croissance de l’e-tendance dans le secteur automobile est ouverte aux investisseurs. Le PERLES sur l’« Electric Car Beneficiaries Basket » (symbole : ECARSU) participe totalement à l’évolution de cours du panier d’actions. Seuls des frais de gestion (0,50%) sont déduits. En contrepartie, d’éventuels dividendes nets sont réinvestis dans les membres du panier.

Même si l’automobile électrique n’est pas encore devenue un produit de masse, et loin s’en faut, la croissance est énorme. Le meilleur exemple en est la Chine : en matière d’e-mobilité, le pays est nettement un précurseur mondial. Ainsi, au premier semestre 2018, quelque 412 000 voitures électriques, c’est-à-dire plus du double qu’au premier semestre 2017, ont été vendues dans l’empire du Milieu. Sur le deuxième marché mondial des voitures électriques, les États-Unis, le taux de croissance s’est établi à tout de même 34%. Si tout se passe comme les experts du Center of Automotive Management (CAM) le prévoient, les véhicules électriques s’empareront progressivement des rues. Selon ces spécialistes, en 2020, leur part de marché globale sera de 6%. Elle devrait déjà atteindre 25% en 2025, puis même 40% en 2030. (Source : www.auto-institut.de) Les constructeurs ne sont pas les seuls à souhaiter participer à cette tendance. Les entreprises sous-traitantes et les groupes informatiques s’impliquent fortement. Par exemple Continental qui, s’agissant de l’e-mobilité, a déjà de nombreux produits techniques en gestation. Et parmi ceux-ci, le New-Wheel-Concept. Il permet, grâce à un freinage plus efficace et une puissance de récupération d’énergie supérieure, de faire circuler les véhicules électriques presque sans utiliser les freins en ville. Le fournisseur automobile Aptiv, une branche séparée de Delphi Automotive, utilise actuellement une flotte de 30 véhicules autonomes dans le réseau du service de transport Lyft à Las Vegas.

Et pour l’industrie des puces, la demande est également très forte avec la numérisation sur quatre roues. Les spécialistes de Mordor Intelligence prévoient que le marché des semi-conducteurs automobiles passera de 34,6 milliards de dollars US en 2017 à 92,9 milliards de dollars US en 2023, c’est-à-dire qu’il connaîtra un taux de croissance moyen de 17,9%. La société Infineon déjà mentionnée plus haut compte parmi les bénéficiaires de cette évolution. Les experts d’UBS considèrent que le fabricant allemand de semi-conducteurs est bien positionné, tant pour la technologie silicium que pour la technologie carbure de silicium. (Source : UBS CIO WM, Semis : Who’s powering Tesla’s Model 3 ?, 15.08.2018)

Opportunités: Les experts en recherche primaire de l’UBS Evidence Lab se sont mis à la recherche des gagnants de la tendance à la voiture électrique et examiné en détail les composants des véhicules électriques. Une commission spécialisée a finalement identifié huit groupes prometteurs du secteur des fournisseurs et de l’industrie IT qu’elle a réunis dans l’« Electric Car Beneficiaries Basket ». Avec le PERLES (symbole : ECARSU), les investisseurs ont désormais la possibilité d’investir de manière diversifiée dans ce thème d’avenir. Le produit en souscription participe intégralement à l’évolution des cours des sous-jacents, après déduction d’une commission de gestion de 0,50% p.a. Les dividendes nets sont réinvestis dans le panier. L’échéance est à sept ans. Toutefois, l’émetteur peut prolonger cette échéance de sept ans supplémentaires.

Risques: Les PERLES ne bénéficient d’aucune protection du capital. En conséquence, une évolution négative des sous-jacents génère les pertes correspondantes pour le produit structuré. Par ailleurs, avec les produits structurés, l’investisseur supporte le risque d’émetteur. Cela signifie qu’en cas d’insolvabilité d’UBS SA, le capital investi peut être perdu, indépendamment de l’évolution du sous-jacent.

Vous trouverez davantage de produits UBS et des informations sur les opportunités et les risques à l’adresse ubs.com/keyinvest.

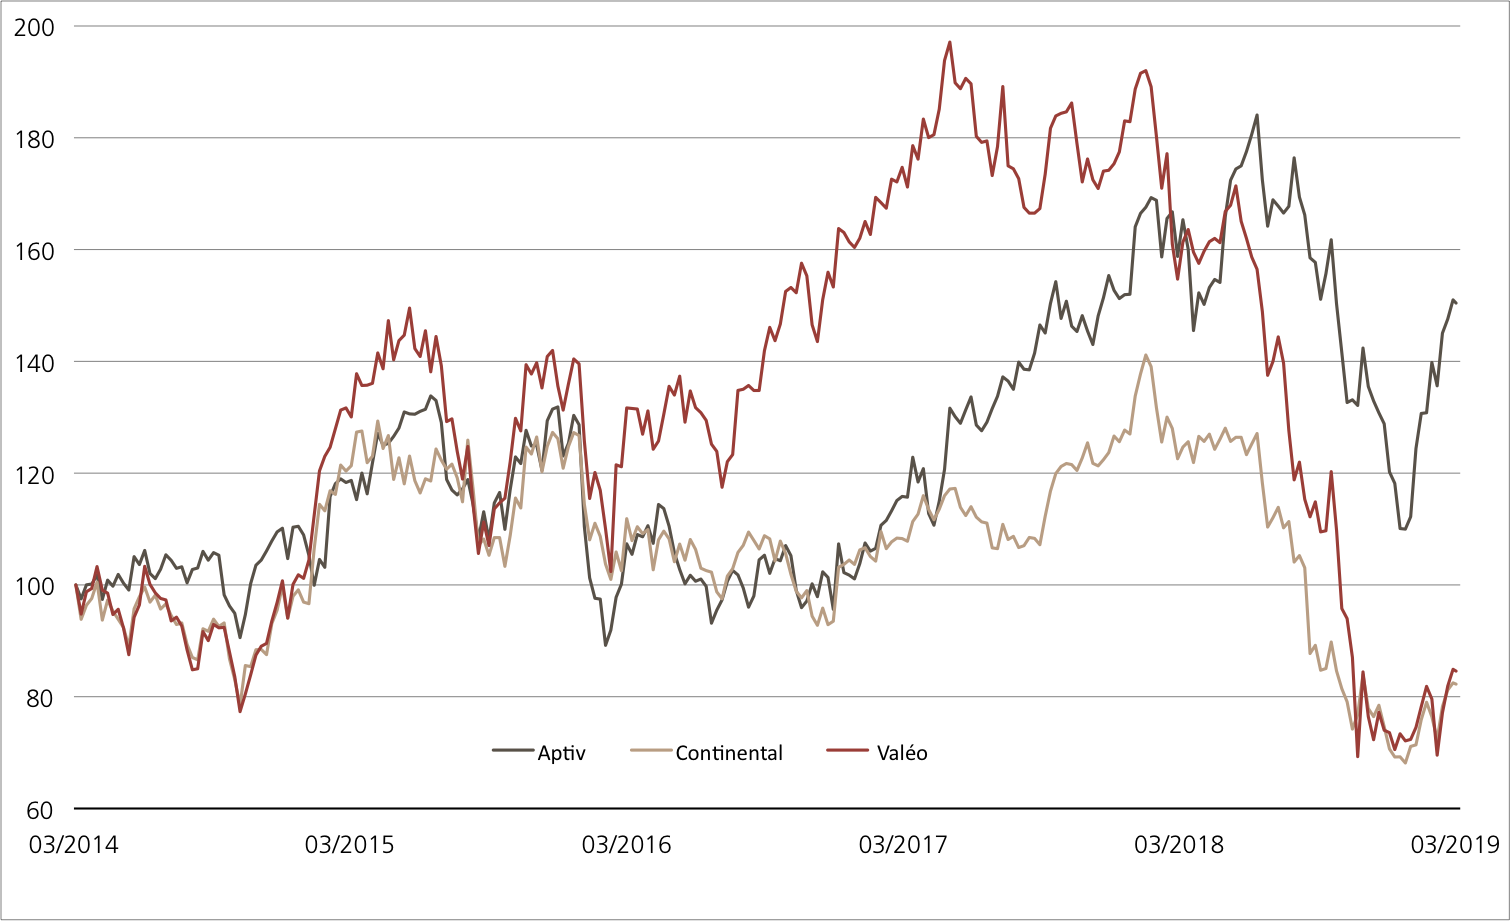
Continental vs. Denso vs. Valeo (5 ans)¹

chart continental

Les trois fournisseurs automobiles Continental, Denso et Valeo de l’Electric Car Beneficiaries Basket présentent, sur une période de cinq ans, une évolution globalement positive. La société française Valeo a réalisé la plus forte croissance.

Source: UBS AG, Bloomberg

Valeurs du: 20.09.2018

Infineon vs. Intel (5 ans)¹

chart infineon

Le rôle des semi-conducteurs dans l’industrie automobile va croissant. L’Electric Car Beneficiaries Basket contient en conséquence les deux géants de la puce électronique Infineon et Intel. Les actions de ces deux sociétés présentent une tendance à la hausse.

Source: UBS AG, Bloomberg

Valeurs du: 20.09.2018

¹) La performance passée n’indique pas les résultats futures.
²) Les condition des ETTs sont vérifiés annuellement et peuvent être ajustées avec un délai de 13 mois après la publication.

PERLES sur Electric Car Beneficiaries Basket

Symbol ECARSU
SVSP Name Tracker-Zertifikat
SPVSP Code 1300
Sous-jacent Electric Car Beneficiaries Basket
Rapport de souscription 1:1
Devise CHF
Frais de gestion 0.50% p.a.
Participation 100%
Echéance 26.09.2025
Émetteur UBS AG, London
Date de fixation du prix 27.09.2018, 15:00 Uhr
 

Composition commencer et pondération d’Electric Car Beneficiaries Baskets und Gewichtung

Continental AG 12.50%
Denso Corp 12.50%
Valeo SA 12.50%
Aptiv PLC 12.50%
Lear Corp 12.50%
Tenneco Inc 12.50%
Infineon Tec. AG 12.50%
Intel Corp 12.50%

Vous trouverez davantage de produits UBS et des informations sur les opportunités et les risques à l’adresse ubs.com/keyinvest.

Source: UBS AG, Bloomberg

Valeurs du: 20.09.2018

Apérçu du marché

Index Citation Semaine¹
SMI™ 8’939.85 -0.2%
SLI™ 1’465.10 0.2%
S&P 500™ 2’907.95 0.7%
Euro STOXX 50™ 3’368.56 1.3%
S&P™ BRIC 40 3’972.45 3.6%
CMCI™ Compos. 930.19 -0.4%
Gold (once troy) 1’208.30 -0.2%

¹ Changement basé sur le cours de clôture du jour précédent par rapport au cours de clôture de la semaine dernière.

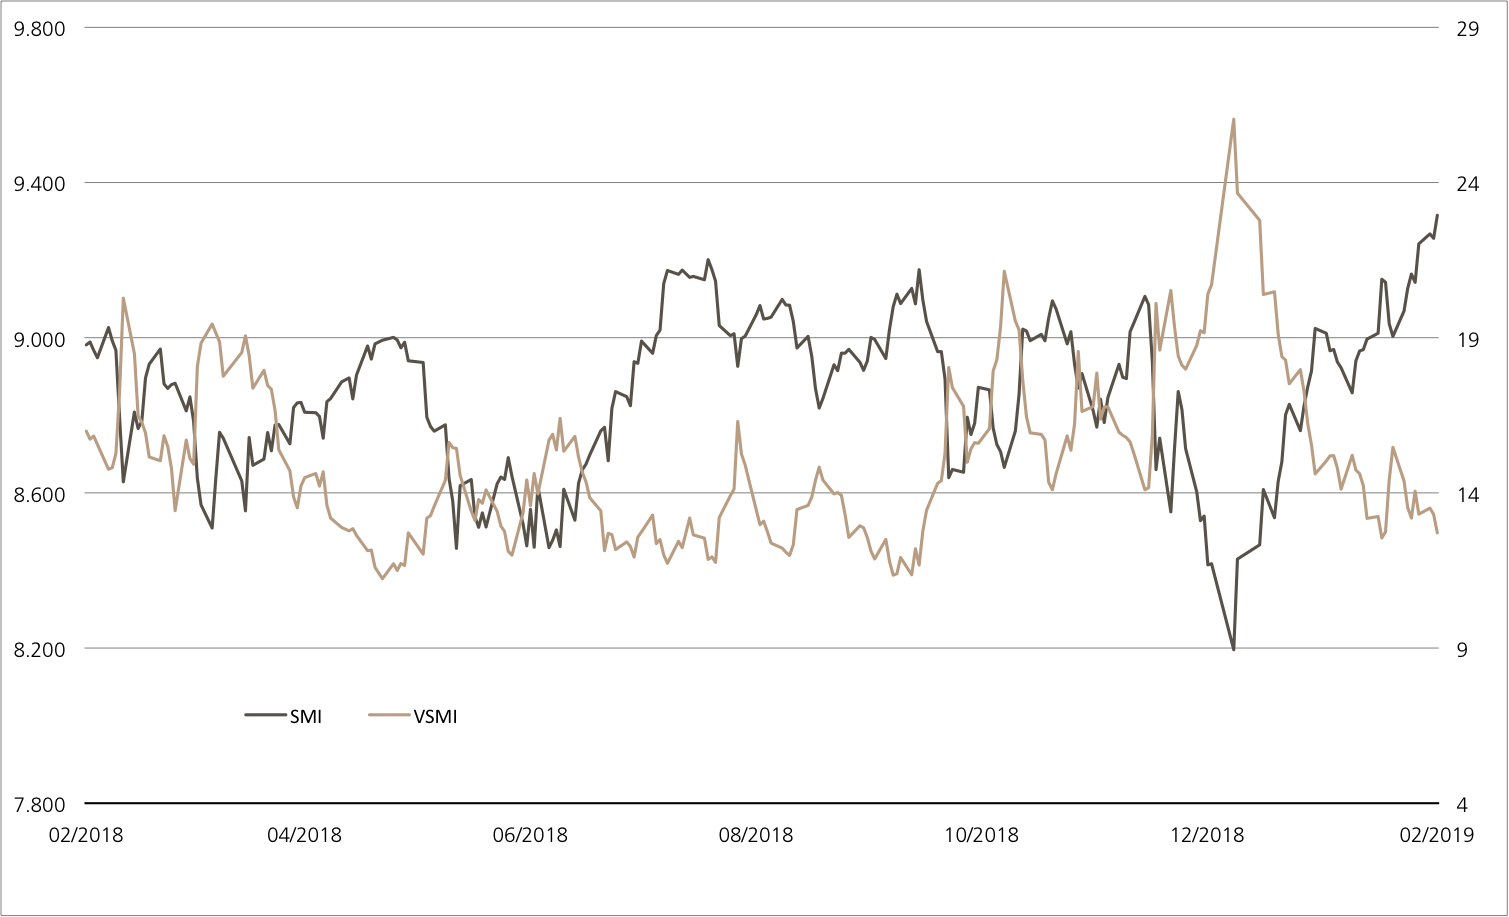
SMI™ vs. VSMI™ 1 année
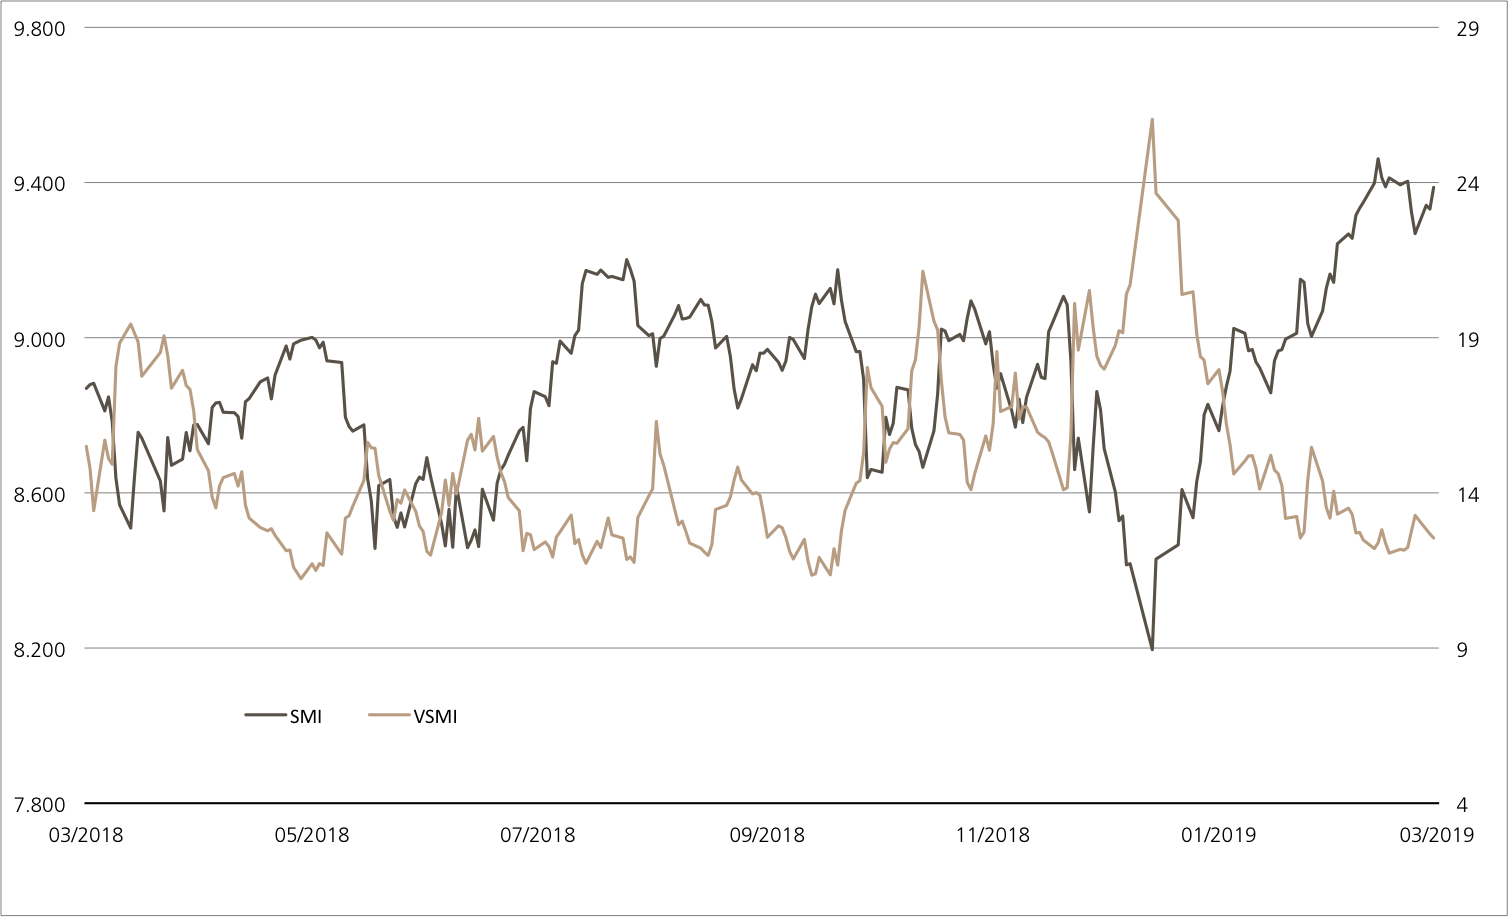
L’index VSMI™ est calculé depuis 2005. Il affiche la volatilité des actions inclus dans le SMI™ index. Pour la calculation, un portefeuille est utilisé qui ne réagit qu’au variations de la volatilité au lieu des variations des prix. En le faisant, la méthodologie du VSMI™ utilise la volatilité carré, connu sous le terme variance, des options sur le SMI avec 30 jours jusqu’à l’échéance négociées à la Bourse Eurex.

Source: UBS AG, Bloomberg

Valeurs du: 20.09.2018

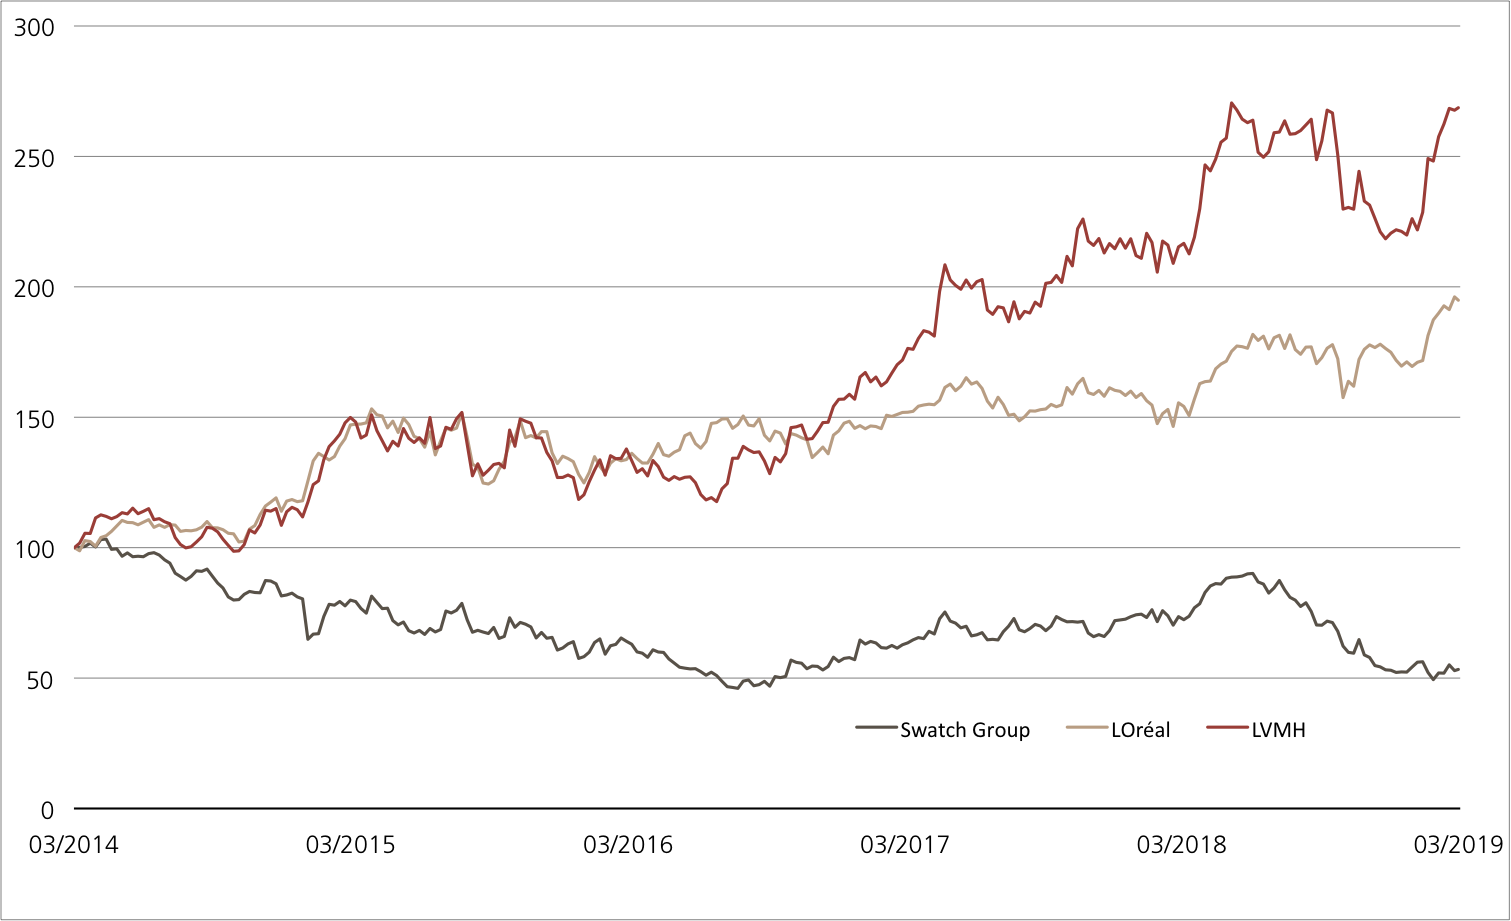
Richemont / LVMH / Swatch
Un profil risque-opportunité intéressant

Les fournisseurs d’articles de luxe connaissent actuellement un contexte favorable. Selon UBS CIO WM, outre des marchés d’actions forts, la hausse des prix de l’immobilier ainsi que la progression de la classe moyenne, surtout en Asie, favorisent ce secteur. Toutefois, l’amplification du conflit commercial constitue une menace pour tout le secteur des biens de consommation, et donc également pour le segment du luxe. Un positionnement partiellement couvert pourrait donc être intéressant pour les investisseurs. Avec le nouveau Callable Kick-In GOAL (symbole : KCMHDU), Richemont, LVMH et Swatch disposent d’une marge de sécurité de 40% chacun. Tant qu’aucune de ces trois actions de luxe n’utilise l’intégralité de cette marge pendant la durée de deux ans, le produit générera le rendement maximal de 7,00% par an à l’échéance.

UBS CIO WM prévoit que les facteurs présentés plus haut resteront solides jusqu’à nouvel ordre. De plus, à moyen terme, la Chine pourrait stimuler la croissance du secteur du luxe. Dans le même temps, le marché des montres connaîtrait un nouvel élan. Toutefois, les analystes soulignent aussi que les incertitudes politiques pourraient peser sur le climat des affaires et la confiance des consommateurs. UBS CIO WM privilégie actuellement les entreprises du luxe disposant de bonnes perspectives de croissance organique ou d’un potentiel de restructuration performante et d’évaluations attractives. (Source : UBS CIO WM European Consumer Discretionary, Equity preferences, 28.08.2018). Avec ses derniers résultats, LVMH a apporté la preuve d’un environnement positif pour le secteur. Au premier semestre, le groupe français a connu une augmentation de 28% de son bénéfice, dépassant ainsi les prévisions des analystes. En particulier en Chine, la demande a été forte pour les montres et vêtements de luxe ainsi que les bijoux de valeur de ce géant de la branche. (Source : Thomson Reuters, revue de presse, 24.07.2018).

Opportunités: Avec les deux fabricants de montres suisses Richemont et Swatch, LVMH fait office de sous-jacent pour un nouveau Callable Kick-In GOAL (symbole : KCMHDU). Indépendamment de l’évolution des cours des trois actions, ce nouveau produit verse un coupon correspondant à 7,00% par an. Cette opportunité de rendement va de pair avec des barrières basses de 60% du niveau de cours initial. Nous attirons votre attention sur le fait qu’avec ce Kick-In GOAL, un remboursement anticipé avec coupon au pro rata est possible. L’émetteur pourra dénoncer le produit pour la première fois au 26 septembre 2019, puis ensuite tous les trois mois.

Risques: Les Worst of Kick-In GOALS ne bénéficient d’aucune protection du capital. Si, pendant la durée de l’investissement, l’un des sous-jacents atteint une seule fois la barrière respective («Kick-In Level») ou est inférieur à celle-ci, et que la fonction de Callable ne s’applique pas, le remboursement à l’échéance par remboursement en espèces est basé sur la performance la plus faible (base Strike) du quatuor (au maximum toutefois à la valeur nominale majorée du coupon). Dans un tel cas, des pertes sont probables. Par ailleurs, avec les produits structurés, l’investisseur supporte le risque d’émetteur. Cela signifie qu’en cas d’insolvabilité d’UBS SA, le capital investi peut être perdu, indépendamment de l’évolution des sous-jacents.

Vous trouverez davantage de produits UBS et des informations sur les opportunités et les risques à l’adresse ubs.com/keyinvest.

Richemont vs. LVMH vs. Swatch (5 ans)¹

Source: UBS AG, Bloomberg

Valeurs du: 20.09.2018

7.00% p.a. Callable Kick-In GOAL sur Richemont/ LVMH/ Swatch

Symbol KCMHDU
SVSP Name Barrier Reverse Convertible
SPVSP Code 1230 (Callable)
Sous-jacent Richemont / LVMH / Swatch
Devise CHF (Quanto)
Coupon 7.00% p.a.
Kick-In Level 60.00%
Echéance 28.09.2020
Émetteur UBS AG, London
Date de fixation du prix 26.09.2018, 15:00 h
 

Vous trouverez davantage de produits UBS et des informations sur les opportunités et les risques à l’adresse ubs.com/keyinvest.

Source: UBS AG, Bloomberg

Valeurs du: 20.09.2018

¹) La performance passée n’indique pas les résultats futures.
²) Les condition des ETTs sont vérifiés annuellement et peuvent être ajustées avec un délai de 13 mois après la publication.

This material has been prepared by UBS AG or one of its affiliates («UBS»). This material is for distribution only as permitted by law. It is not prepared for the needs of any specific recipient. It is published solely for information and is not a solicitation or offer to buy or sell any securities or related financial instruments (“Instruments”). UBS makes no representation or warranty, either express or implied, on the completeness or reliability of the information contained in this document (“Information”) except that concerning UBS AG and its affiliates. The Information should not be regarded by recipients as a substitute for using their own judgment. Any opinions expressed in this material may change without notice and may be contrary to opinions expressed by other business areas of UBS as a result of using different assumptions or criteria. UBS is under no obligation to update the Information. UBS, its officers, employees or clients may have or have had an interest in the Instruments and may at any time transact in them. UBS may have or have had a relationship with entities referred to in the Information. Neither UBS nor any of its affiliates, or their officers or employees, accepts any liability for any loss arising from use of the Information. This presentation is not a basis for entering into a transaction. Any transaction between you and UBS will be subject to the detailed provisions of the term sheet, confirmation or electronic matching systems relating to that transaction. Clients wishing to effect transactions should contact their local sales representative.
This information is communicated by UBS AG and/or its affiliates («UBS»). * (see below) UBS may from time to time, as principal or agent, have positions in, or may buy or sell, or make a market in any securities, currencies, financial instruments or other assets underlying the product to which this website relates (the «Structured Product»). UBS may provide investment banking and other services to and/or have officers who serve as directors of the companies referred to in this website. UBS’s trading and/or hedging activities related to the Structured Product may have an impact on the price of the underlying asset and may affect the likelihood that any relevant barrier or relevant trigger event is crossed or triggered. UBS has policies and procedures designed to minimise the risk that officers and employees are influenced by any conflicting interest or duty and that confidential information is improperly disclosed or made available. UBS may pay or receive brokerage or retrocession fees in connection with the Structured Product described herein. In respect of any Structured Product that is a security, UBS may, in certain circumstances, sell the Structured Product to dealers and other financial institutions at a discount to the issue price or rebate to them for their own account some proportion of the issue price. Further information is available on request. Structured Products are complex and may involve a high risk of loss. Prior to purchasing the Structured Product you should consult with your own legal, regulatory, tax, financial and accounting advisors to the extent you consider it necessary, and make your own investment, hedging and trading decisions (including decisions regarding the suitability of the Structured Product) based upon your own judgement and advice from those advisers you consider necessary. Save as otherwise expressly agreed in writing, UBS is not acting as your financial adviser or fiduciary in relation to the Product. UBS generally hedges its exposure to Structured Products, although it may elect not to hedge or to partially hedge any Structured Product. UBS’s hedging activity may be conducted through transactions in the underlying asset, index or instrument or in options, futures or other derivatives related to the underlying asset, index or instrument on publicly traded markets or otherwise, and may have an impact on the price of the under-lying asset. If a transaction is cash settled, UBS will generally unwind or offset any hedge it has for such Structured Product in close proximity to the relevant valuation time or period. In some cases, this activity may affect the value of the Structured Product. Unless stated otherwise in this document, (i) this document is for information purposes only and should not be construed as an offer, personal recommendation or solicitation to purchase the Structured Product and should not be treated as giving investment advice, and (ii) the terms of any investment in the Structured Product will be exclusively subject to the detailed provisions, including risk considerations, contained in the more detailed legal documentation that relates to the Structured Product (being the confirmation, information memorandum, prospectus or other issuer documentation as relevant). UBS makes no representation or warranty relating to any information herein which is derived from independent sources. This document shall not be copied or reproduced without UBS’s prior written permission. In respect of any Structured Product that is a security, no action has been or will be taken in any jurisdiction that would permit a public offering of the Product, save where explicitly stated in the issuer documentation. The Structured Product must be sold in accordance with all applicable selling restrictions in the jurisdictions in which it is sold.
© UBS 2018. All rights reserved. UBS prohibits the forwarding of this information without the approval of UBS.
Weekly-Hits édition de 21.09.20182018-09-21T09:10:48+02:00

Weekly-Hits edition of 21.09.2018

KeyInvest Weekly Hits

Friday, 20.09.2018

keyinvest titel
  • Topic 1: Electric Car Beneficiaries Basket - Charged for the future
  • Topic 2: Richemont/LVMH/Swatch - Attractive risk-reward profile

Electric Car Beneficiaries Basket
Charged for the future

At the dawn of a new era marked by the change from the gasoline engine to electric cars, many people are wondering what the car of tomorrow will look like. The German premium manufacturer BMW recently provided an answer to this question with the unveiling of the iNext, a new self-driving electric car. The car is scheduled to enter series production from 2021 onwards. Nevertheless, it is not just manufacturers who are vying for pole position in this new sector; suppliers and the IT industry also have high hopes for the future innovations on four wheels. For example, chip manufacturer Infineon has long been following the trend of autonomous driving and driver assistance systems as well as e-mobility. Investors now have the opportunity to diversify and participate in the growth opportunities offered by the trend toward electric vehicles in the automotive industry. The PERLES on the “Electric Car Beneficiaries Basket” (symbol: ECARSU) fully participates in the performance of the share basket. The only deduction is an annual management fee of 0.5%. In return, any net dividends are reinvested in the basket members.

Although the electric car has not yet become a staple product, it has enjoyed enormous growth. The best example of this is China, which is by far the world’s foremost pioneer in terms of e-mobility. In the first half of 2018, around 412,000 electric cars were sold in the Middle Kingdom, more than twice as many as in the previous year. In the US, the world’s second-largest market for electric cars, the growth rate stood unmoving at 34%. According to the experts at the Center of Automotive Management (CAM), electric cars will gradually take over the roads. In 2020, they anticipate a global market share of 6%, which is expected to increase to 25% by 2025 and even to 40% by 2030. (Source: www.auto-institut.de) It is not only manufacturers who are wanting to get on-board with this trend – suppliers and IT corporations are also muscling in. For example, Continental has numerous technical products focused on e-mobility in the pipeline. These include the “New Wheel Concept”. By utilizing the strong braking effect in the energy recovery system, electric vehicles can move through city traffic almost without using the brakes. Automotive supplier, Aptiv – a spin-off of Delphi Automotive – already has a fleet of 30 self-driving vehicles in operation in the Lyft carpool network in Las Vegas.

The chip industry is also experiencing demand for the digitization of automobiles. The experts at Mordor Intelligence predict that the automotive semiconductor market will expand from USD 34.6 billion in 2017 to USD 92.9 billion in 2023 with an average annual growth rate of 17.9%. One of the beneficiaries of this trend is the previously mentioned Infineon. UBS experts believe the German semiconductor manufacturer to be well positioned in both silicon and silicon carbide technology. (Source: UBS CIO WM, Semis: Who’s powering Tesla’s Model 3?, 15.08.2018)

Opportunities: The primary research experts at the UBS Evidence Lab attempted to identify the winners in the electric car trend, breaking down electric vehicles into their component parts. In the end, a committee of experts filtered out eight promising groups from the supplier industry and the IT industry. Based on these results the “Electric Car Beneficiaries Basket” has been combined. With the PERLES (symbol: ECARSU) on the new share basket, investors now have the opportunity to make a diversified investment in this future-oriented area. The product currently in subscription tracks the performance of the underlying basket – after the deduction of the annual management fee of 0.5%. The net dividends are reinvested in the basket. The security matures after seven years. However, the issuer has the option of extending the term by a further seven years.

Risks: PERLES do not have capital protection. If the underlying asset records a negative performance, this would therefore result in commensurate losses in the structured product. Investors in structured products are also exposed to issuer risk, which means that the capital invested may be lost if UBS AG becomes insolvent, regardless of the performance of the underlying.

More UBS products and further information on the risks and opportunities are available at ubs.com/keyinvest.

Continental vs. Denso vs. Valeo (5 years)¹

chart continental

Continental, Denso and Valeo – the three automotive suppliers for the Electric Car Beneficiaries Basket show positive development on a five-year basis. The French company, Valeo, recorded the largest growth.

Source: UBS AG, Bloomberg

As of 20.09.2018

Infineon vs. Intel (5 years)¹

chart infineon

Semiconductors are playing an increasingly important role in the automotive industry. The two giants in the world of chip manufacturing, Infineon and Intel, are thus included in the Electric Car Beneficiaries Basket. Both shares are trending upwards.

Source: UBS AG, Bloomberg

As of: 20.09.2018

¹) Please be aware that past performance does not indicate future results.
²) The conditions of ETTs are reviewed on a yearly basis and can be adjusted with a deadline of 13 months after the announcement.

PERLES on Electric Car Beneficiaries Basket

Symbol ECARSU
SVSP Name Tracker-Certificate
SPVSP Code 1300
Underlying Electric Car Beneficiaries Basket
Ratio 1:1
Currency CHF
Administration fee 0.50% p.a.
Participation 100%
Expiry 26.09.2025
Issuer UBS AG, London
Subscription until 27.09.2018, 15:00h
 

Starting composition and weighting of the Electric Car Beneficiaries Baskets

Continental AG 12.50%
Denso Corp 12.50%
VALEO SA 12.50%
Aptiv PLC 12.50%
Lear Corp 12.50%
Tenneco Inc 12.50%
Infineon Tec. AG 12.50%
Intel Corp 12.50%

More UBS products and further information on the risks and opportunities are available at ubs.com/keyinvest.

Source: UBS AG, Bloomberg

As of: 20.09.2018

Market overview

Index Quotation Week¹
SMI™ 8’939.85 -0.2%
SLI™ 1’465.10 0.2%
S&P 500™ 2’907.95 0.7%
Euro STOXX 50™ 3’368.56 1.3%
S&P™ BRIC 40 3’972.45 3.6%
CMCI™ Compos. 930.19 -0.4%
Gold (troy ounce) 1’208.30 -0.2%

¹ Change based on the closing price of the previous day compared to the closing price a week ago.

SMI™ vs. VSMI™ 1 year

smi vs vsmi

The VSMI™ Index is calculated since 2005. It shows the volatility of the stocks within the SMI™ index. A portfolio which reacts only to changes in volatility instead of volatility itself is relevant for the calculation. Thereby, the VSMI™ methodology uses the squared volatility, known as variance, of the SMI options with remaining time to expiry of 30 days traded at the Eurex.

Source: UBS AG, Bloomberg

As of: 20.09.2018

Richemont/LVMH/Swatch
Attractive risk-reward profile

Suppliers of luxury goods are currently operating in a favorable environment: In addition to strong equity markets, UBS CIO WM believes that rising real estate prices and a growing middle class, particularly in Asia, are playing into the hands of the sector. However, the simmering trade dispute represents a threat to the entire consumer goods industry and thus also for the luxury segment. In this respect, a partially protected positioning might be interesting for investors. The new Callable Kick-In GOAL on Richemont, LVMH and Swatch (symbol: KCMHDU) offers a safety buffer of 40%. Provided that none of the three luxury equities impinge on this buffer during the two-year term, the product will yield the maximum return of 7.00% p.a. upon maturity.

UBS CIO WM assumes that the factors outlined above will remain robust for the time being. In addition, China is likely to remain a growth driver for the luxury sector in the medium term. In parallel to this, the watch market should experience a healthy revival. However, analysts also stress that political uncertainties could negatively impact the economic climate and consumer confidence. UBS CIO WM currently prefers luxury companies with good organic growth prospects or the potential for successful restructuring, as well as attractive valuations. (Source: UBS CIO WM European Consumer Discretionary, Equity preferences, 28.08.2018) The latest figures from LVMH provide evidence of the positive industry environment. The French group enjoyed a 28% increase in profits in the first six months of 2018 and thus exceeded analysts’ expectations. There has been great demand for the luxury watches, clothing and high-priced jewelry sold by this industry giant, particularly in China. (Source: Thomson Reuters media report, 24.07.2018)

Opportunities: Together with the two Swiss watch manufacturers Richemont and Swatch, LVMH acts as the underlying for a new Callable Kick-In GOAL (symbol: KCMHDU). Irrespective of the performance of the three equities, the new issue will pay out a coupon of 7% p.a. This return opportunity enjoys low barriers of 60% of the initial price level. Please note that an early redemption including a proportionate coupon amount is possible with this Kick-In GOAL. The issuer is entitled to cancel the product for the first time on September 26, 2019, and subsequently every three months thereafter.

Risks: This product does not have capital protection. If the underlyings touch or fall below the respective Kick-In Level (barrier) and the callable feature does not apply, the amount repaid on the maturity date is reflecting the worst performance of the underlyings (but not more than notional value plus coupon). In this case, it is likely that losses will be incurred. Investors in structured products are also exposed to issuer risk, which means that the capital invested may be lost if UBS AG becomes insolvent, regardless of the performance of the underlying.

More UBS products and further information on the risks and opportunities are available at ubs.com/keyinvest.

Richemont vs. LVMH vs. Swatch (5 years)¹

Source: UBS AG, Bloomberg

As of: 20.09.2018

7.00% p.a. Callable Kick-In GOAL on Richemont/ LVMH/ Swatch

Symbol KCMHDU
SVSP Name Barrier Reverse Convertible
SPVSP Code 1230 (Callable)
Underlyings Richemont / LVMH / Swatch
Currency CHF (Quanto)
Coupon 7.00% p.a.
Kick-In Level 60.00%
Expiry 28.09.2020
Issuer UBS AG, London
Subscription until 26.09.2018, 15:00 Uhr
 

More UBS products and further information on the risks and opportunities are available at ubs.com/keyinvest.

Source: UBS AG, Bloomberg

As of: 20.09.2018

¹) Please be aware that past performance does not indicate future results.
²) The conditions of ETTs are reviewed on a yearly basis and can be adjusted with a deadline of 13 months after the announcement.

This material has been prepared by UBS AG or one of its affiliates («UBS»). This material is for distribution only as permitted by law. It is not prepared for the needs of any specific recipient. It is published solely for information and is not a solicitation or offer to buy or sell any securities or related financial instruments (“Instruments”). UBS makes no representation or warranty, either express or implied, on the completeness or reliability of the information contained in this document (“Information”) except that concerning UBS AG and its affiliates. The Information should not be regarded by recipients as a substitute for using their own judgment. Any opinions expressed in this material may change without notice and may be contrary to opinions expressed by other business areas of UBS as a result of using different assumptions or criteria. UBS is under no obligation to update the Information. UBS, its officers, employees or clients may have or have had an interest in the Instruments and may at any time transact in them. UBS may have or have had a relationship with entities referred to in the Information. Neither UBS nor any of its affiliates, or their officers or employees, accepts any liability for any loss arising from use of the Information. This presentation is not a basis for entering into a transaction. Any transaction between you and UBS will be subject to the detailed provisions of the term sheet, confirmation or electronic matching systems relating to that transaction. Clients wishing to effect transactions should contact their local sales representative.
This information is communicated by UBS AG and/or its affiliates («UBS»). * (see below) UBS may from time to time, as principal or agent, have positions in, or may buy or sell, or make a market in any securities, currencies, financial instruments or other assets underlying the product to which this website relates (the «Structured Product»). UBS may provide investment banking and other services to and/or have officers who serve as directors of the companies referred to in this website. UBS’s trading and/or hedging activities related to the Structured Product may have an impact on the price of the underlying asset and may affect the likelihood that any relevant barrier or relevant trigger event is crossed or triggered. UBS has policies and procedures designed to minimise the risk that officers and employees are influenced by any conflicting interest or duty and that confidential information is improperly disclosed or made available. UBS may pay or receive brokerage or retrocession fees in connection with the Structured Product described herein. In respect of any Structured Product that is a security, UBS may, in certain circumstances, sell the Structured Product to dealers and other financial institutions at a discount to the issue price or rebate to them for their own account some proportion of the issue price. Further information is available on request. Structured Products are complex and may involve a high risk of loss. Prior to purchasing the Structured Product you should consult with your own legal, regulatory, tax, financial and accounting advisors to the extent you consider it necessary, and make your own investment, hedging and trading decisions (including decisions regarding the suitability of the Structured Product) based upon your own judgement and advice from those advisers you consider necessary. Save as otherwise expressly agreed in writing, UBS is not acting as your financial adviser or fiduciary in relation to the Product. UBS generally hedges its exposure to Structured Products, although it may elect not to hedge or to partially hedge any Structured Product. UBS’s hedging activity may be conducted through transactions in the underlying asset, index or instrument or in options, futures or other derivatives related to the underlying asset, index or instrument on publicly traded markets or otherwise, and may have an impact on the price of the under-lying asset. If a transaction is cash settled, UBS will generally unwind or offset any hedge it has for such Structured Product in close proximity to the relevant valuation time or period. In some cases, this activity may affect the value of the Structured Product. Unless stated otherwise in this document, (i) this document is for information purposes only and should not be construed as an offer, personal recommendation or solicitation to purchase the Structured Product and should not be treated as giving investment advice, and (ii) the terms of any investment in the Structured Product will be exclusively subject to the detailed provisions, including risk considerations, contained in the more detailed legal documentation that relates to the Structured Product (being the confirmation, information memorandum, prospectus or other issuer documentation as relevant). UBS makes no representation or warranty relating to any information herein which is derived from independent sources. This document shall not be copied or reproduced without UBS’s prior written permission. In respect of any Structured Product that is a security, no action has been or will be taken in any jurisdiction that would permit a public offering of the Product, save where explicitly stated in the issuer documentation. The Structured Product must be sold in accordance with all applicable selling restrictions in the jurisdictions in which it is sold.
© UBS 2018. All rights reserved. UBS prohibits the forwarding of this information without the approval of UBS.
Weekly-Hits edition of 21.09.20182018-09-21T09:10:06+02:00

Weekly-Hits édition de 14.09.2018

KeyInvest Weekly Hits

Vendredi, 14.09.2018

keyinvest Nahrungsmittel
  • Thème 1: Fabricants de denrées alimentaires - La nourriture a toujours le vent en poupe
  • Thème 2: Grands groupes suisses - De nombreuses surprises positives

Fabricants de denrées alimentaires
La nourriture a toujours le vent en poupe

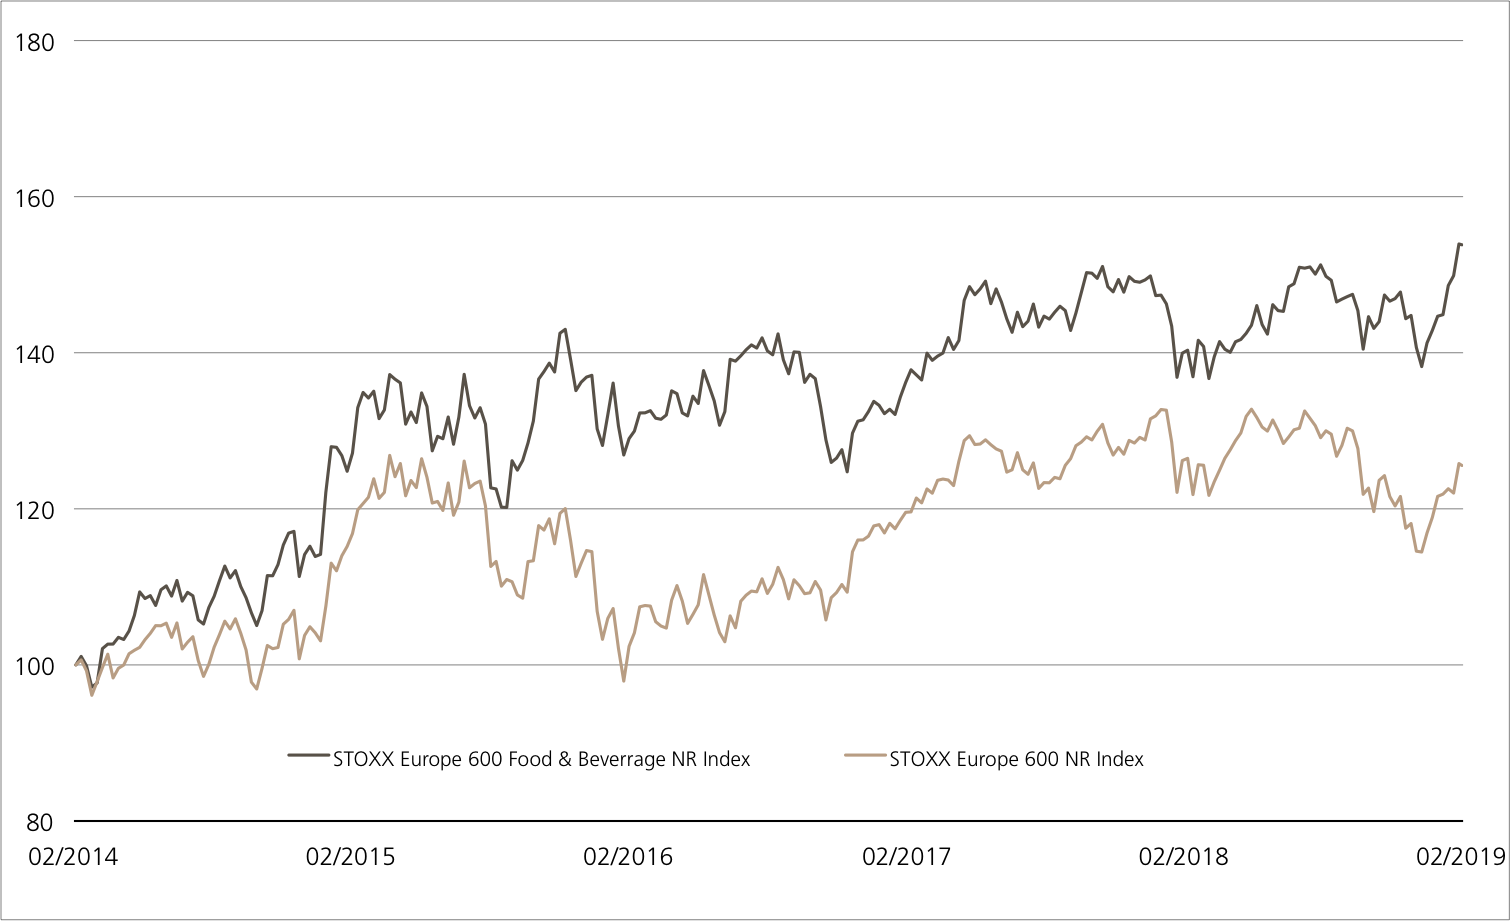
Nous régalons nos papilles tout au long de l’année. En été, ce sont les grillades, en hiver, les menus de fête se multiplient à l’approche de Noël, au printemps et en automne, on retrouve sur notre table des délices culinaires tels que le lapin de Pâques en chocolat ou le potiron. La nourriture a donc toujours le vent en poupe, et ce même lorsque l’économie est plus morose. En conséquence, on considère volontiers ce secteur comme défensif, avec une sensibilité relativement modeste à la conjoncture. En outre, la hausse de la population mondiale et l’accroissement de la prospérité dans les pays émergents en stimulent la croissance. Avec l’UBS ETT (symbole: ETFOO) sur le STOXX™ Europe 600 Food & Beverage Index, il est possible de participer à l’évolution des cours des plus grands groupes agroalimentaires européens de manière diversifiée.² Les investisseurs souhaitant optimiser leur rendement pourraient apprécier le nouveau Callable Worst of Kick-In GOAL (symbole: KCKHDU) sur Danone, Mondelez, Nestlé et Lindt & Sprüngli. Le produit proposé en souscription dispose d’une barrière de 55 pour cent des valeurs initiales et d’un coupon de 5,00 pour cent par an.

Aux quatre coins de la planète, les grands groupes agroalimentaires se portent bien actuellement. Pour la période sous revue qui vient de s’achever, Nestlé a créé l’événement (cf. également page 3). Mark Schneider, son nouveau PDG, remet en forme le leader mondial grâce à une transformation ciblée. Au cours des six premiers mois de 2018, la croissance organique corrigée des effets exceptionnels a augmenté de 2,8 pour cent. Et ce rythme pourrait même s’accélérer au second semestre. Mark Schneider prévoit en effet une hausse d’environ 3 pour cent. Compatriote Lindt & Sprüngli est également en pleine expansion. Notamment grâce à une bonne évolution dans les pays émergents, les recettes en monnaies locales ont progressé de 5,1 pour cent, le bénéfice semestriel a même augmenté de manière disproportionnée (+ 12,7 pour cent). Pour le moyen à long terme, Lindt & Sprüngli vise à renforcer sa rentabilité de 20 à 40 points de base. De plus, Mondelez a créé la surprise. Le deuxième fabricant mondial de sucreries a dépassé les attentes avec son rapport intermédiaire au deuxième trimestre. Le groupe américain bénéficie actuellement d’une part de la politique stricte de la direction en matière de dépenses, et d’autre part de l’augmentation des ventes de chocolats Cadbury et de gâteaux Oreo. Le fabricant de yogourts leader, Danone, a également continué à développer son activité en 2018. Toutefois, le Français connaît actuellement des difficultés au Maroc. Les utilisateurs reprochent à l’entreprise d’abuser de sa situation dominante sur le marché pour pratiquer des prix excessifs. Cécile Cabanis, CFO du groupe, garde son sang-froid et prévoit que les pertes de chiffre d’affaires marocaines pourront être compensées ailleurs. En conséquence, les objectifs globaux pour l’année ont été confirmés.

Opportunités: les grands groupes agroalimentaires cités constituent le quatuor sous-jacent du nouveau Callable Worst of Kick-In GOAL (symbole: KCKHDU). Le produit proposé en souscription est doté d’une échéance maximale de trois ans et d’un coupon de 5,00 pour cent par an. Le remboursement anticipé du produit peut avoir lieu pour la première fois au bout d’un an, puis tous les trois mois. Le Kick-In Level s’établit à 64 pour cent de chaque sous-jacent. Les investisseurs recherchant un placement encore plus diversifié disposeront d’un instrument très adapté avec l’ETT (symbole: ETFOO) sur le STOXX™ Europe 600 Food & Beverage Index. Le produit participe à l’identique et sans limitation de durée à l’évolution du secteur européen des denrées alimentaires. Actuellement, il englobe 22 titres.

Risques: il n’existe aucune protection du capital pour les produits. Une évolution négative de la valeur des sous-jacents génère des pertes correspondantes pour l’ETT. En revanche, les Worst of Kick-In GOAL bénéficient d’une protection du capital sous conditions. Si, pendant la durée de l’investissement, l’un des sous-jacents atteint une seule fois la barrière respective («Kick-In Level») ou est inférieur à celle-ci, et que la fonction de Callable ne s’applique pas, le remboursement par amortissement en espèces à l’échéance est basé sur la performance la plus faible (base Strike) du quatuor (au maximum toutefois à la valeur nominale majorée du coupon). Dans un tel cas, des pertes sont probables. Par ailleurs, avec les produits structurés, l’investisseur supporte le risque d’émetteur. Cela signifie qu’en cas d’insolvabilité d’UBS SA, le capital investi peut être perdu, indépendamment de l’évolution du sous-jacent.

Vous trouverez davantage de produits UBS et des informations sur les opportunités et les risques à l’adresse ubs.com/keyinvest.

STOXX™ Europe 600 Food & Beverage Index (5 ans)¹

stoxxEurope600

Même si la dynamique a quelque peu faibli récemment, sur cinq ans, le STOXX™ Europe 600 Food & Beverage Index affiche un mouvement régulier à la hausse.

Source: UBS AG, Bloomberg

Valeurs du: 13.09.2018

Danone vs. Mondelez vs. Nestlé vs. Lindt & Sprüngli (5 ans)¹

danone

Les grands groupes alimentaires Danone, Mondelez, Nestlé et Lindt & Sprüngli
ont évolué à la hausse à des rythmes différents. Avec un plus de 78 pour cent, le fabricant de chocolats de qualité a une longueur d’avance.

Source: UBS AG, Bloomberg

Valeurs du: 13.09.2018

¹) La performance passée n’indique pas les résultats futures.
²) Les condition des ETTs sont vérifiés annuellement et peuvent être ajustées avec un délai de 13 mois après la publication.

ETT sur STOXX™ Europe 600 Food & Beverage Index

Symbol ETFOO
SVSP Name Tracker-Zertifikat
SPVSP Code 1300
Sous-jacent STOXX™ Europe 600 Food & Beverage NR Index
Rapport de souscription 1:1
Devise EUR
Frais de gestion 0.00% p.a.
Participation 100%
Echéance Open End
Émetteur UBS AG, London
Bid/Ask EUR 1’225.00 / 1’232.00
 

5.00% p.a. Callable Worst of Kick-In GOAL sur Danone, Mondelez, Nestlé, Lindt & Sprüngli

Symbol KCKHDU
SVSP Name Barrier Reverse Convertible
SPVSP Code 1230 (Callable)
Sous-jacent Danone, Mondelez, Nestlé, Lindt & Sprüngli
Devise CHF (Quanto)
Coupon 5.00% p.a.
Kick-In Level 55.00%
Echéance 20.09.2021
Émetteur UBS AG, London
Date de fixation du prix 19.09.2018, 15:00h
 

Vous trouverez davantage de produits UBS et des informations sur les opportunités et les risques à l’adresse ubs.com/keyinvest.

Source: UBS AG, Bloomberg

Valeurs du: 13.09.2018

Apérçu du marché

Index Citation Semaine¹
SMI™ 8’960.13 1.0%
SLI™ 1’462.36 0.8%
S&P 500™ 2’888.92 0.0%
Euro STOXX 50™ 3’326.60 0.3%
S&P™ BRIC 40 3’833.53 -1.8%
CMCI™ Compos. 933.75 1.3%
Gold (once troy) 1’210.90 0.8%

¹ Changement basé sur le cours de clôture du jour précédent par rapport au cours de clôture de la semaine dernière.

SMI™ vs. VSMI™ 1 année

smi vs vsmi

L’index VSMI™ est calculé depuis 2005. Il affiche la volatilité des actions inclus dans le SMI™ index. Pour la calculation, un portefeuille est utilisé qui ne réagit qu’au variations de la volatilité au lieu des variations des prix. En le faisant, la méthodologie du VSMI™ utilise la volatilité carré, connu sous le terme variance, des options sur le SMI avec 30 jours jusqu’à l’échéance négociées à la Bourse Eurex.

Source: UBS AG, Bloomberg

Valeurs du: 13.09.2018

Grands groupes suisses
De nombreuses surprises positives

Lundi, avec Richemont, le dernier des 20 membres du SMI™ a présenté son rapport intermédiaire pour la saison sous revue en cours. La conclusion globale parle d’elle-même: les résultats des trois quarts des Blue Chips suisses ont dépassé les attentes de la communauté financière. Cela concerne aussi bien les trois poids lourds que sont Nestlé, Novartis et Roche, que par exemple le groupe d’assurances Zurich Insurance. Le nouveau Callable Worst of Kick-In GOAL (symbole: KCKEDU) a été composé sur la base de ces quatre titres du SMI™. Le produit est encore disponible en souscription jusqu’au 19 septembre et propose un coupon correspondant à 5,00 pour cent en versements trimestriels. Cette opportunité de rendement est associée à une marge de sécurité initiale de 46 pour cent.

Roche a créé l’événement de cette période de bilan la plus récente. Le premier fabricant mondial de médicaments anti-cancéreux a non seulement enregistré sa plus forte croissance depuis presque cinq ans, mais il a également relevé ses perspectives. Pour l’exercice en cours, il s’attend désormais à une hausse du chiffre d’affaires d’un pourcentage moyen à un chiffre. En avril déjà, Roche avait relevé ses prévisions de croissance des bénéfices d’un pourcentage faible à un chiffre. Pour son concurrent local Novartis, le premier semestre s’est également bien déroulé. Par exemple, le secteur des médicaments pour les yeux, qui devrait entrer en bourse au premier semestre 2019, a enregistré une hausse de 14 pour cent de son bénéfice opérationnel corrigé. Compte tenu du succès remporté ces six premiers mois, les prévisions de chiffre d’affaires et de bénéfices pour l’année ont été confirmées. Alors que Nestlé a abaissé son objectif de croissance de «2 à 4 pour cent» à désormais «3 pour cent», Zurich Insurance est resté fidèle à ses objectifs à moyen terme. «À la mi-temps de la période stratégique triennale, nous sommes sur la bonne voie pour réaliser tous les objectifs fixés d’ici fin 2019», a expliqué Mario Greco, directeur général du groupe. (Source: Thomson Reuters, revue de presse, 09.08.2018)

Opportunités: les quatre titres SMI™ sous-jacents du Callable Worst of Kick-In GOAL (symbole: KCKEDU) permettent de bénéficier d’un coupon de 5,00 par an qui sera versé pour la première fois le 27 décembre, sur une base trimestrielle et indépendamment de l’évolution du cours des sous-jacents. Actuellement, le remboursement du nominal (1000 francs) est couplé aux actions. Le quatuor dispose d’une marge confortable de sécurité de 46 pour cent. Si ce matelas résiste jusqu’à échéance, le rendement maximal sera atteint. Compte tenu de la fonction Callable, le produit peut être remboursé de manière anticipée, pour la première fois après un an.

Risques: il n’existe aucune protection du capital pour le produit présenté. Si, pendant la durée de l’investissement, l’un des sous-jacents atteint une seule fois la barrière respective («Kick-In Level») ou est inférieur à celle-ci, et que la fonction de Callable ne s’applique pas, le remboursement par amortissement en espèces à l’échéance est basé sur la performance la plus faible (base Strike) du quatuor (au maximum toutefois à la valeur nominale majorée du coupon). Dans un tel cas, des pertes sont probables. Par ailleurs, avec les produits structurés, l’investisseur supporte le risque d’émetteur. Cela signifie qu’en cas d’insolvabilité d’UBS SA, le capital investi peut être perdu, indépendamment de l’évolution du sous-jacent.

Vous trouverez davantage de produits UBS et des informations sur les opportunités et les risques à l’adresse ubs.com/keyinvest.

Nestlé vs. Novartis vs. Roche vs. Zurich Insurance (5 ans)¹

nestle

Source: UBS AG, Bloomberg

Valeurs du: 13.09.2018

5.00% p.a. Callable Worst of Kick-In GOAL sur Nestlé, Novartis, Roche, Zurich Insurance

Symbol KCKEDU
SVSP Name Barrier Reverse Convertible
SPVSP Code 1230 (Callable)
Sous-jacent Nestlé, Novartis, Roche, Zurich Insurance
Devise CHF
Coupon 5.00% p.a.
Kick-In Level 54.00%
Echéance 20.09.2021
Émetteur UBS AG, London
Date de fixation du prix 19.09.2018, 15:00h
 

Vous trouverez davantage de produits UBS et des informations sur les opportunités et les risques à l’adresse ubs.com/keyinvest.

Source: UBS AG, Bloomberg

Valeurs du: 13.09.2018

¹) La performance passée n’indique pas les résultats futures.
²) Les condition des ETTs sont vérifiés annuellement et peuvent être ajustées avec un délai de 13 mois après la publication.
This material has been prepared by UBS AG or one of its affiliates («UBS»). This material is for distribution only as permitted by law. It is not prepared for the needs of any specific recipient. It is published solely for information and is not a solicitation or offer to buy or sell any securities or related financial instruments (“Instruments”). UBS makes no representation or warranty, either express or implied, on the completeness or reliability of the information contained in this document (“Information”) except that concerning UBS AG and its affiliates. The Information should not be regarded by recipients as a substitute for using their own judgment. Any opinions expressed in this material may change without notice and may be contrary to opinions expressed by other business areas of UBS as a result of using different assumptions or criteria. UBS is under no obligation to update the Information. UBS, its officers, employees or clients may have or have had an interest in the Instruments and may at any time transact in them. UBS may have or have had a relationship with entities referred to in the Information. Neither UBS nor any of its affiliates, or their officers or employees, accepts any liability for any loss arising from use of the Information. This presentation is not a basis for entering into a transaction. Any transaction between you and UBS will be subject to the detailed provisions of the term sheet, confirmation or electronic matching systems relating to that transaction. Clients wishing to effect transactions should contact their local sales representative.
This information is communicated by UBS AG and/or its affiliates («UBS»). * (see below) UBS may from time to time, as principal or agent, have positions in, or may buy or sell, or make a market in any securities, currencies, financial instruments or other assets underlying the product to which this website relates (the «Structured Product»). UBS may provide investment banking and other services to and/or have officers who serve as directors of the companies referred to in this website. UBS’s trading and/or hedging activities related to the Structured Product may have an impact on the price of the underlying asset and may affect the likelihood that any relevant barrier or relevant trigger event is crossed or triggered. UBS has policies and procedures designed to minimise the risk that officers and employees are influenced by any conflicting interest or duty and that confidential information is improperly disclosed or made available. UBS may pay or receive brokerage or retrocession fees in connection with the Structured Product described herein. In respect of any Structured Product that is a security, UBS may, in certain circumstances, sell the Structured Product to dealers and other financial institutions at a discount to the issue price or rebate to them for their own account some proportion of the issue price. Further information is available on request. Structured Products are complex and may involve a high risk of loss. Prior to purchasing the Structured Product you should consult with your own legal, regulatory, tax, financial and accounting advisors to the extent you consider it necessary, and make your own investment, hedging and trading decisions (including decisions regarding the suitability of the Structured Product) based upon your own judgement and advice from those advisers you consider necessary. Save as otherwise expressly agreed in writing, UBS is not acting as your financial adviser or fiduciary in relation to the Product. UBS generally hedges its exposure to Structured Products, although it may elect not to hedge or to partially hedge any Structured Product. UBS’s hedging activity may be conducted through transactions in the underlying asset, index or instrument or in options, futures or other derivatives related to the underlying asset, index or instrument on publicly traded markets or otherwise, and may have an impact on the price of the under-lying asset. If a transaction is cash settled, UBS will generally unwind or offset any hedge it has for such Structured Product in close proximity to the relevant valuation time or period. In some cases, this activity may affect the value of the Structured Product. Unless stated otherwise in this document, (i) this document is for information purposes only and should not be construed as an offer, personal recommendation or solicitation to purchase the Structured Product and should not be treated as giving investment advice, and (ii) the terms of any investment in the Structured Product will be exclusively subject to the detailed provisions, including risk considerations, contained in the more detailed legal documentation that relates to the Structured Product (being the confirmation, information memorandum, prospectus or other issuer documentation as relevant). UBS makes no representation or warranty relating to any information herein which is derived from independent sources. This document shall not be copied or reproduced without UBS’s prior written permission. In respect of any Structured Product that is a security, no action has been or will be taken in any jurisdiction that would permit a public offering of the Product, save where explicitly stated in the issuer documentation. The Structured Product must be sold in accordance with all applicable selling restrictions in the jurisdictions in which it is sold.
© UBS 2018. All rights reserved. UBS prohibits the forwarding of this information without the approval of UBS.
Weekly-Hits édition de 14.09.20182018-09-14T09:36:54+02:00

Weekly-Hits edition of 14.09.2018

KeyInvest Weekly Hits

Friday, 14.09.2018

keyinvest Nahrungsmittel
  • Topic 1: Food producers - Food is always in demand
  • Topic 2: Major Swiss corporations - Many positive surprises

Food producers
Food is always in demand

We feast all year round – barbecues are lit in summer, winter is filled with one Christmas dinner after another, and there are plenty of culinary treats like chocolate Easter bunnies and pumpkins to enjoy in spring and fall too. So food is always in demand. As this is the case even in difficult economic times, the industry is often described as defensive with comparatively low economic sensitivity. The growing world population and increasing prosperity in emerging markets are also proving to be growth drivers, too. With the UBS ETT (symbol: ETFOO) on the STOXX™ Europe 600 Food & Beverage Index, you can participate in the share performance of the major European food groups in a diversified manner.² For those interested in optimizing their return, the new Callable Worst of Kick-In GOAL (symbol: KCKHDU) on Danone, Mondelez, Nestlé and Lindt & Sprüngli could prove appealing. The subscription product has a barrier of 55% of the initial fixing as well as an annual coupon of 5%.

Food companies around the world are currently in good health. One of the highlights of the reporting season just ended was provided by Nestlé (see also page 3). New CEO Mark Schneider has brought the world market leader back on track with a targeted reorganization of the company. In the first six months of 2018, organic growth adjusted for one-off effects increased by 2.8%. We expect this to pick up even more in the second half of the year. Schneider expects a positive performance of around 3%. Fellow compatriot Lindt & Sprüngli is likewise enjoying growth. Revenues in local currencies improved by 5.1%, in particular due to a good performance in emerging markets, while half-year profits rose by a disproportionate 12.7%. In the medium to long term, Lindt & Sprüngli wants to increase its profitability by 20 to 40 basis points.

Mondelez has also proved to be a positive surprise. The world’s second-largest confectionery producer exceeded expectations in its interim report for the second quarter. The US group is currently benefiting from a disciplined spending policy set out by its management as well as strong sales of Cadbury chocolate and Oreo cookies. Leading yogurt manufacturer Danone has also further expanded its business in 2018; however, the French company is currently experiencing headwinds in Morocco. Consumers are accusing the company of abusing its market power and charging excessive prices. CFO Cecile Cabanis is nevertheless remaining calm on this issue and expects to be able to compensate for the losses in sales elsewhere. The targets for the year as a whole were therefore confirmed at the half-year stage.

Opportunities: The abovementioned food groups make up the four underlying assets of the new Callable Worst of Kick-In GOAL (symbol: KCKHDU). The subscription product has a maximum term of three years and an annual coupon of 5%. The product can be repaid early for the first time after one year – and then every three months. The Kick-In Level is at 64% of the underlying prices. Investors wanting an even more-diversified investment will find the ETT (symbol: ETFOO) on the STOXX™ Europe 600 Food & Beverage Index is just what they are looking for. The product fully participates in the performance of the European food industry without any maturity constraints. The product currently contains 22 stocks.

Risks: The products do not have capital protection. Should the underlying assets deliver a negative performance, the ETT will incur commensurate losses. Worst of Kick-In GOALs, however, have conditional capital protection. If the underlyings touch or fall below the respective Kick-In Level (barrier) and the callable feature does not apply, the amount repaid on the maturity date is reflecting the worst performance of the four shares (but not more than notional value plus coupon). In this case, it is likely that losses will be incurred. Investors in structured products are also exposed to issuer risk, which means that the capital invested may be lost if UBS AG becomes insolvent, regardless of the performance of the underlying.

More UBS products and further information on the risks and opportunities are available at ubs.com/keyinvest.

STOXX™ Europe 600 Food & Beverage Index (5 years)¹

stoxxEurope600

Although its momentum has slowed somewhat recently, the STOXX™ Europe 600 Food & Beverage Index has enjoyed a steady upward trend over the last five years.

Source: UBS AG, Bloomberg

As of 13.09.2018

Danone vs. Mondelez vs. Nestlé vs. Lindt & Sprüngli (5 years)¹

danone

The food companies Danone, Mondelez, Nestlé and Lindt & Sprüngli enjoyed varying rates of growth, with the premium chocolate producer leading the pack with a positive performance of 78%.

Source: UBS AG, Bloomberg

As of: 13.09.2018

¹) Please be aware that past performance does not indicate future results.
²) The conditions of ETTs are reviewed on a yearly basis and can be adjusted with a deadline of 13 months after the announcement.

ETT on STOXX™ Europe 600 Food & Beverage Index

Symbol ETFOO
SVSP Name Tracker-Certificate
SPVSP Code 1300
Underlying STOXX™ Europe 600 Food & Beverage NR Index
Ratio 1:1
Currency EUR
Administration fee 0.00% p.a.
Participation 100%
Expiry Open End
Issuer UBS AG, London
Bid/ask EUR 1’225.00 / 1’232.00
 

5.00% p.a. Callable Worst of Kick-In GOAL on Danone, Mondelez, Nestlé, Lindt & Sprüngli

Symbol KCKHDU
SVSP Name Barrier Reverse Convertible
SPVSP Code 1230 (Callable)
Underlyings Danone, Mondelez, Nestlé, Lindt & Sprüngli
Currency CHF (Quanto)
Coupon 5.00% p.a.
Kick-In Level 55.00%
Expiry 20.09.2021
Issuer UBS AG, London
Subscription until 19.09.2018, 15:00 Uhr
 

More UBS products and further information on the risks and opportunities are available at ubs.com/keyinvest.

Source: UBS AG, Bloomberg

As of: 13.09.2018

Market overview

Index Quotation Week¹
SMI™ 8’960.13 1.0%
SLI™ 1’462.36 0.8%
S&P 500™ 2’888.92 0.0%
Euro STOXX 50™ 3’326.60 0.3%
S&P™ BRIC 40 3’833.53 -1.8%
CMCI™ Compos. 933.75 1.3%
Gold (troy ounce) 1’210.90 0.8%

¹ Change based on the closing price of the previous day compared to the closing price a week ago.

SMI™ vs. VSMI™ 1 year

smi vs vsmi

The VSMI™ Index is calculated since 2005. It shows the volatility of the stocks within the SMI™ index. A portfolio which reacts only to changes in volatility instead of volatility itself is relevant for the calculation. Thereby, the VSMI™ methodology uses the squared volatility, known as variance, of the SMI options with remaining time to expiry of 30 days traded at the Eurex.

Source: UBS AG, Bloomberg

As of: 13.09.2018

Major Swiss corporations
Many positive surprises

Richemont presented its interim report for the current reporting season on Monday, making it the last of the 20 SMI™ members to do so. The overall conclusion is impressive – the results of three-quarters of Swiss blue chips exceeded the expectations of the financial community, including those of the three heavyweights Nestlé, Novartis and Roche as well as Zurich Insurance Group. These four SMI™ stocks make up the new Callable Worst of Kick-In GOAL (symbol: KCKEDU). The product, which is in subscription until September 19, pays out an annual coupon of 5% on a quarterly basis. This return opportunity comes with an initial risk buffer of 46%.

Roche proved to be one of the highlights of the recent reporting season. The largest manufacturer of cancer medication in the world not only posted its highest growth in almost five years, it also raised its outlook once again. An increase in sales by a moderate single-digit percentage is now expected in the current financial year, after it had only raised its forecast revenue growth rate to a low single-digit percentage in April. Domestic competitor Novartis also performed well in the first half. For example, the ophthalmic division, which is due to go public in the first half of 2019, increased its adjusted operating income by 14%. Due to the successful first six months, the sales and profit forecast for the full year has been confirmed. While Nestlé narrowed its growth target from 2–4% to 3%, Zurich Insurance stuck to its medium-term objectives. “At the midpoint of our three-year plan, we stand well on track to achieve all indicated targets by the end of 2019,” said Group Chief Executive Officer Mario Greco. (Source: Thomson Reuters media report, August 9, 2018)

Opportunities: With the four SMI™ stocks serving as the underlyings for the Callable Worst of Kick-In GOAL (symbol: KCKEDU), an annual coupon of 5% is possible. Starting on December 27, this coupon will be paid out quarterly irrespective of the performance of the underlying assets. Meanwhile, the repayment of the CHF 1,000 notional is linked to the underlying shares. The quartet has a comfortable safety buffer of 46%. If the buffer holds out until the end of the term, the maximum return will be paid out. Due to the callable function, the product can be repaid prematurely – for the first time after one year.

Risks: This product does not have capital protection. If the underlyings touch or fall below the respective Kick-In Level (barrier) and the callable feature does not apply, the amount repaid on the maturity date is reflecting the worst performance of the underlyings (but not more than notional value plus coupon). In this case, it is likely that losses will be incurred. Investors in structured products are also exposed to issuer risk, which means that the capital invested may be lost if UBS AG becomes insolvent, regardless of the performance of the underlying.

More UBS products and further information on the risks and opportunities are available at ubs.com/keyinvest.

Nestlé vs. Novartis vs. Roche vs. Zurich Insurance (5 years)¹

nestle

Source: UBS AG, Bloomberg

As of: 13.09.2018

5.00% p.a. Callable Worst of Kick-In GOAL on Nestlé, Novartis, Roche, Zurich Insurance

Symbol KCKEDU
SVSP Name Barrier Reverse Convertible
SPVSP Code 1230 (Callable)
Underlyings Nestlé, Novartis, Roche, Zurich Insurance
Currency CHF
Coupon 5.00% p.a.
Kick-In Level 54.00%
Expiry 20.09.2021
Issuer UBS AG, London
Subscription until 19.09.2018, 15:00 Uhr
 

More UBS products and further information on the risks and opportunities are available at ubs.com/keyinvest.

Source: UBS AG, Bloomberg

As of: 13.09.2018

¹) Please be aware that past performance does not indicate future results.
²) The conditions of ETTs are reviewed on a yearly basis and can be adjusted with a deadline of 13 months after the announcement.

This material has been prepared by UBS AG or one of its affiliates («UBS»). This material is for distribution only as permitted by law. It is not prepared for the needs of any specific recipient. It is published solely for information and is not a solicitation or offer to buy or sell any securities or related financial instruments (“Instruments”). UBS makes no representation or warranty, either express or implied, on the completeness or reliability of the information contained in this document (“Information”) except that concerning UBS AG and its affiliates. The Information should not be regarded by recipients as a substitute for using their own judgment. Any opinions expressed in this material may change without notice and may be contrary to opinions expressed by other business areas of UBS as a result of using different assumptions or criteria. UBS is under no obligation to update the Information. UBS, its officers, employees or clients may have or have had an interest in the Instruments and may at any time transact in them. UBS may have or have had a relationship with entities referred to in the Information. Neither UBS nor any of its affiliates, or their officers or employees, accepts any liability for any loss arising from use of the Information. This presentation is not a basis for entering into a transaction. Any transaction between you and UBS will be subject to the detailed provisions of the term sheet, confirmation or electronic matching systems relating to that transaction. Clients wishing to effect transactions should contact their local sales representative.
This information is communicated by UBS AG and/or its affiliates («UBS»). * (see below) UBS may from time to time, as principal or agent, have positions in, or may buy or sell, or make a market in any securities, currencies, financial instruments or other assets underlying the product to which this website relates (the «Structured Product»). UBS may provide investment banking and other services to and/or have officers who serve as directors of the companies referred to in this website. UBS’s trading and/or hedging activities related to the Structured Product may have an impact on the price of the underlying asset and may affect the likelihood that any relevant barrier or relevant trigger event is crossed or triggered. UBS has policies and procedures designed to minimise the risk that officers and employees are influenced by any conflicting interest or duty and that confidential information is improperly disclosed or made available. UBS may pay or receive brokerage or retrocession fees in connection with the Structured Product described herein. In respect of any Structured Product that is a security, UBS may, in certain circumstances, sell the Structured Product to dealers and other financial institutions at a discount to the issue price or rebate to them for their own account some proportion of the issue price. Further information is available on request. Structured Products are complex and may involve a high risk of loss. Prior to purchasing the Structured Product you should consult with your own legal, regulatory, tax, financial and accounting advisors to the extent you consider it necessary, and make your own investment, hedging and trading decisions (including decisions regarding the suitability of the Structured Product) based upon your own judgement and advice from those advisers you consider necessary. Save as otherwise expressly agreed in writing, UBS is not acting as your financial adviser or fiduciary in relation to the Product. UBS generally hedges its exposure to Structured Products, although it may elect not to hedge or to partially hedge any Structured Product. UBS’s hedging activity may be conducted through transactions in the underlying asset, index or instrument or in options, futures or other derivatives related to the underlying asset, index or instrument on publicly traded markets or otherwise, and may have an impact on the price of the under-lying asset. If a transaction is cash settled, UBS will generally unwind or offset any hedge it has for such Structured Product in close proximity to the relevant valuation time or period. In some cases, this activity may affect the value of the Structured Product. Unless stated otherwise in this document, (i) this document is for information purposes only and should not be construed as an offer, personal recommendation or solicitation to purchase the Structured Product and should not be treated as giving investment advice, and (ii) the terms of any investment in the Structured Product will be exclusively subject to the detailed provisions, including risk considerations, contained in the more detailed legal documentation that relates to the Structured Product (being the confirmation, information memorandum, prospectus or other issuer documentation as relevant). UBS makes no representation or warranty relating to any information herein which is derived from independent sources. This document shall not be copied or reproduced without UBS’s prior written permission. In respect of any Structured Product that is a security, no action has been or will be taken in any jurisdiction that would permit a public offering of the Product, save where explicitly stated in the issuer documentation. The Structured Product must be sold in accordance with all applicable selling restrictions in the jurisdictions in which it is sold.
© UBS 2018. All rights reserved. UBS prohibits the forwarding of this information without the approval of UBS.
Weekly-Hits edition of 14.09.20182018-09-14T10:15:27+02:00

Weekly-Hits édition de 07.09.2018

KeyInvest Weekly Hits

Vendredi, 07.09.2018

ubs_weeklyhits_japan
  • Thème 1: Japon – Ombres et lumières au Japon
  • Thème 2: Jeu vidéo – Le marché du gaming en plein boom

Japon
Ombres et lumières au Japon

L’économie japonaise évolue en dents de scie. Si, jusqu’à fin 2017, la conjoncture enregistrait sa plus longue période de croissance de plus de deux ans depuis la fin des années 1980, elle a connu un recul au premier trimestre 2018. En dépit de tous les efforts du premier ministre Shinzo Abe, la reprise peine à s’établir. Mais le gouvernement ne s’avoue pas vaincu. Il peut en effet compter sur la banque centrale et espérer une politique monétaire expansionniste. «Il n’y aura pas de relèvement des taux pendant un certain temps», a précisé récemment son gouverneur, Haruhiko Kuroda, lors d’une interview accordée au journal «Yomiuri Shimbun». (Source: Thomson Reuters, Revue de presse, 01.09.2018). L’Open End PERLES (symbole: NIKKY) sur le NIKKEI 225™ permet une participation directe – sans déduction de frais – à l’indice directeur japonais. Avec le Callable Worst of Kick-In GOAL (symbole: KCITDU), les investisseurs plus circonspects peuvent bénéficier d’une protection partielle sous condition dans le NIKKEI 225™ ainsi que le S&P 500™, le SMI™ et l’Euro STOXX 50™. Le produit offre une marge de sécurité de 40 pour cent et une opportunité de rendement de 4,50 pour cent par an.

Actuellement, l’économie japonaise est en proie à un jeu d’ombres et de lumières. Par exemple, la situation de l’emploi y a évolué négativement en août. Le taux de chômage a progressé légèrement plus que prévu, de 2,4 pour cent en juillet à 2,5 pour cent. De plus, la production industrielle nipponne a perdu 0,1 pour cent en comparaison mensuelle en juillet alors que l’on attendait généralement une progression de 0,2 pour cent. Ce recul s’explique notamment par la faiblesse des exportations de véhicules et d’acier. La conjoncture japonaise émet toutefois aussi des signaux encourageants. Après le recul du produit intérieur brut (PIB) au premier trimestre, l’économie s’est ressaisie pendant la période suivante, entre avril et juin. Grâce à des dépenses de consommation en hausse et à des investissements plus élevés, le pays a retrouvé la voie de la croissance. Selon de premières estimations, le PIB progresse de 0,5 pour cent par rapport au trimestre précédent alors que les économistes ne prévoyaient qu’une augmentation de 0,3 pour cent.

Le différend commercial avec les États-Unis fait peser une épée de Damoclès sur le Japon. Le président américain Donald Trump exige de Tokyo la signature d’un accord de libre-échange bilatéral, et menace, à défaut, d’augmenter les droits de douane. Mais le gouvernement nippon fait de la résistance et mise toujours sur des accords de libre-échange multilatéraux. Ainsi, mi-juillet, l’UE et le Japon ont conclu un accord de libre-échange complet après cinq ans de négociations. Cet accord crée un espace économique commun de plus de 600 millions de personnes, dans lequel plus d’un quart du PIB global est réalisé. Les deux parties ont souligné qu’il s’agissait d’un signal en faveur d’un commerce «libre, équitable et régulé, et contre le protectionnisme».

Opportunités: depuis que le premier ministre en titre Shinzo Abe a pris ses fonctions fin 2012, le NIKKEI 225™ a plus que doublé. ¹ L’Open End PERLES (symbole: NIKKY) sur l’indice principal japonais est à la disposition des personnes souhaitant investir sur une poursuite du mouvement haussier. Ce produit de participation participe pleinement à l’évolution du cours du sous-jacent. Attention: le produit en CHF n’est pas couvert contre les risques de change. Les investisseurs souhaitant bénéficier d’une protection partielle en raison des incertitudes politiques et économiques à l’échelle mondiale pourraient être intéressés par le Callable Kick-In GOAL (symbole: KCITDU) sur NIKKEI 225™, S&P 500™, SMI™ et Euro STOXX 50™. La marge de risque de 40 pour cent permet des baisses modérées sans mettre en péril l’opportunité de gain de 4,50 pour cent par an.

Risques: il n’existe aucune protection du capital pour les produits présentés. Avec l’Open End PERLES, il est possible d’essuyer des pertes en cas de baisse de l’indice sous-jacent. Si, avec le Worst of Kick-In GOAL, pendant la durée de l’investissement, l’un des sous-jacents atteint une seule fois la barrière respective («Kick-In Level») ou est inférieur à celle-ci, et que la fonction de remboursement anticipé ne s’applique pas, l’amortissement par remboursement en espèces à l’échéance est basé sur la performance la plus faible (base Strike) du quatuor (au maximum toutefois à la valeur nominale majorée du coupon). Dans un tel cas, des pertes sont probables. Par ailleurs, avec les produits structurés, l’investisseur supporte le risque d’émetteur. Cela signifie qu’en cas d’insolvabilité d’UBS SA, le capital investi peut être perdu, indépendamment de l’évolution du sous-jacent.

Vous trouverez davantage de produits UBS et des informations sur les opportunités et les risques à l’adresse ubs.com/keyinvest.

NIKKEI 225™ Index (5 ans)¹

Source: UBS AG, Bloomberg

Valeurs du: 05.09.2018

SMI™ vs. Euro STOXX 50™ vs. S&P 500™ vs. Nikkei 225™ (5 ans)¹

Source: UBS AG, Bloomberg

Valeurs du: 05.09.2018

¹) La performance passée n’indique pas les résultats futures.
²) Les condition des ETTs sont vérifiés annuellement et peuvent être ajustées avec un délai de 13 mois après la publication.
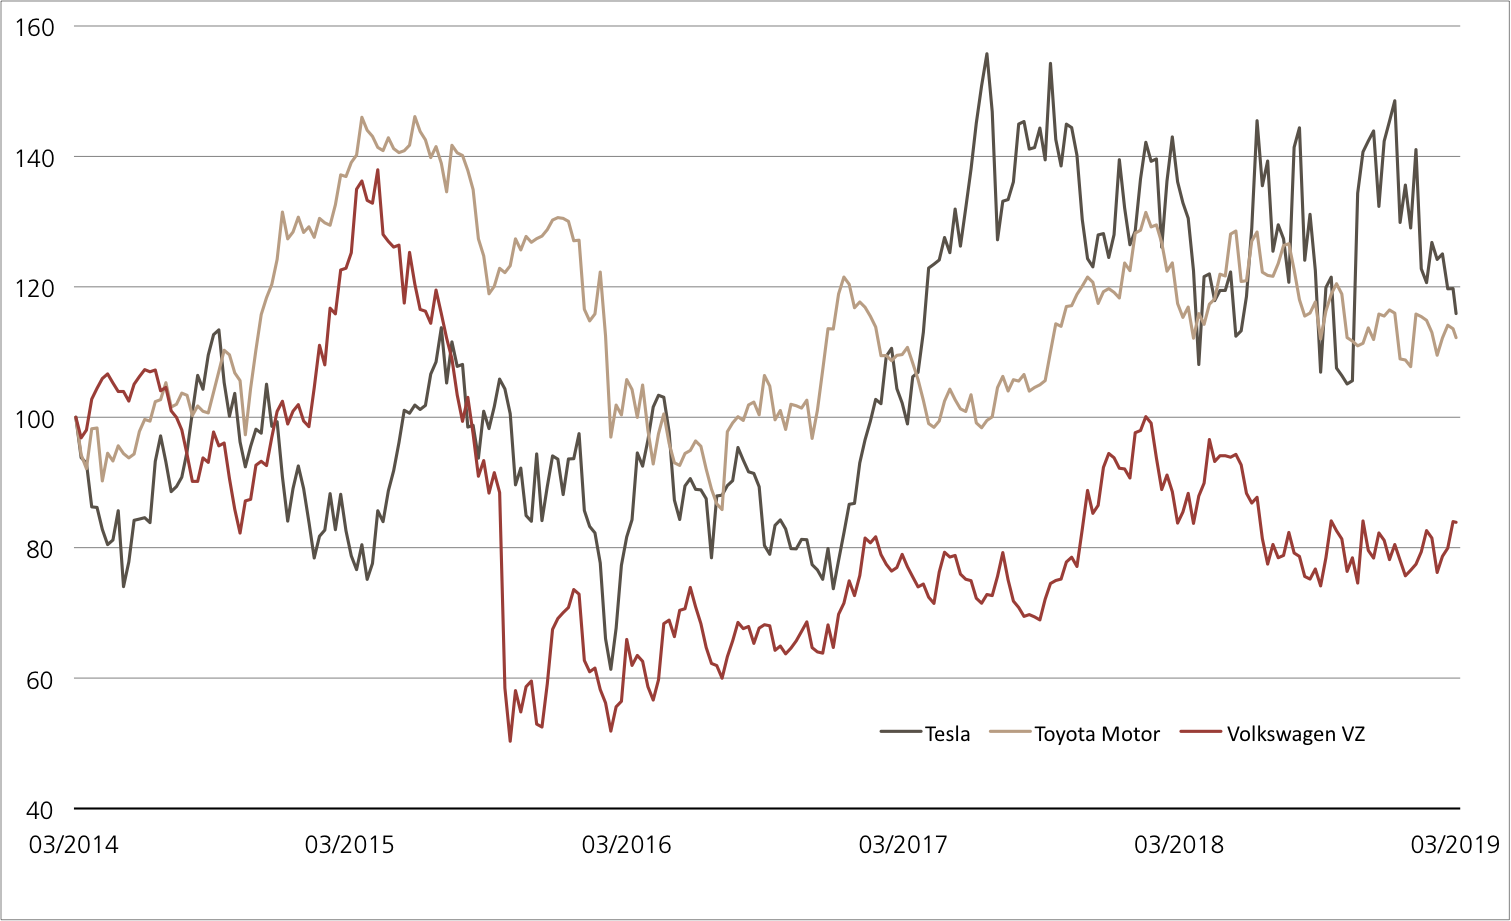
Open End PERLES sur NIKKEI 225™

Symbol NIKKY
SVSP Name Tracker-Zertifikat
SPVSP Code 1300
Sous-jacent NIKKEI 225™ Index
Rapport de souscription 10:1
Devise CHF
Frais de gestion 0.00%
Participation 100%
Echéance Open End
Émetteur UBS AG, London
Bid/Ask CHF 19.55 / 19.65
 

4.50% p.a. Callable Worst of Kick-In GOAL sur SMI™ / Euro STOXX 50™ / S&P 500™ / Nikkei 225™

Symbol KCITDU
SVSP Name Barrier Reverse Convertible
SPVSP Code 1230 (Callable)
Sous-jacent SMI™ / Euro STOXX 50™ / S&P 500™ / Nikkei 225™
Devise CHF (Quanto)
Coupon 4.50% p.a.
Kick-In Level 60.00%
Echéance 03.09.2021
Émetteur UBS AG, London
Prix ​​d’émission 100.00%
 

Vous trouverez davantage de produits UBS et des informations sur les opportunités et les risques à l’adresse ubs.com/keyinvest.

Source: UBS AG, Bloomberg

Valeurs du: 05.09.2018

Apérçu du marché

Index Citation Semaine¹
SMI™ 8’868.86 -2.4%
SLI™ 1’450.84 -2.4%
S&P 500™ 2’888.60 -0.9%
Euro STOXX 50™ 3’315.62 -4.1%
S&P™ BRIC 40 3’902.26 -4.9%
CMCI™ Compos. 921.68 -1.1%
Gold (once troy) 1’201.30 -0.8%

¹ Changement basé sur le cours de clôture du jour précédent par rapport au cours de clôture de la semaine dernière.

SMI™ vs. VSMI™ 1 année

L’index VSMI™ est calculé depuis 2005. Il affiche la volatilité des actions inclus dans le SMI™ index. Pour la calculation, un portefeuille est utilisé qui ne réagit qu’au variations de la volatilité au lieu des variations des prix. En le faisant, la méthodologie du VSMI™ utilise la volatilité carré, connu sous le terme variance, des options sur le SMI avec 30 jours jusqu’à l’échéance négociées à la Bourse Eurex.

Source: UBS AG, Bloomberg

Valeurs du: 05.09.2018

Jeu vidéo
Le marché du gaming en plein boom

Fin août, l’univers des geeks s’est retrouvé à Cologne: le plus grand festival mondial du jeu Gamescom a établi de nouveaux records, avec plus de 1000 exposants et 370 000 visiteurs. On y a retrouvé notamment Activision Blizzard. Le développeur de jeux américain s’est vu décerner le «Gamescom Award» pour le meilleur jeu d’action. De plus, le groupe a présenté le jeu attendu avec impatience «Call of Duty: Black Ops 4» que l’on retrouvera dans les commerces dès le 12 octobre 2018. L’entreprise Activision est très appréciée par les geeks, mais également sur le marché des actions. Son cours a plus que triplé au cours des cinq dernières actions. Pendant la même période, ses concurrents Electronic Arts et Take-Two ont même connu une progression encore plus importante. ¹ Le Worst of Kick-In GOAL (symbole: KCJJDU) actuellement en souscription prévoit le cas où le trio s’accorderait désormais un bref répit. Si la barrière de 60 pour cent des cours initiaux reste intacte, le produit générera dans un an le montant maximum de 12 pour cent par an.

Une croissance mondiale: selon l’analyste de marché Newzoo, les chiffres d’affaires pour les jeux passeront de 121,7 milliards de dollars US l’année dernière à 180,1 milliards de dollars US en 2021, et ce surtout grâce aux Mobile Games toujours plus appréciés. Cela correspond à un taux de croissance annuel moyen de 10,3 pour cent. (Source: Newzoo.com). Enfin, Take-Two et Activision ont également enregistré une forte croissance ces derniers temps. Au deuxième trimestre, les deux entreprises ont dépassé les attentes. Alors qu’Activision a connu une hausse inattendue de son bénéfice de 65 pour cent grâce aux succès du blockbuster «Call of Duty», Take-Two a créé la surprise avec une hausse de ses chiffres d’affaires de tout juste douze pour cent. Les recettes ont été stimulées par des jeux tels que «Grand Theft Auto» et «NBA 2K18». Le troisième élément, Electronic Arts, a également convaincu grâce à son rapport intermédiaire, mais il a déçu en raison de ses perspectives pour le trimestre en cours. Dans le même temps pourtant, l’entreprise a rassuré avec de nouveaux jeux tels que «Madden NFL» et «Battlefield V», qui devraient arriver sur le marché encore au second semestre.

Opportunités: le nouveau Worst of Kick-In GOAL (symbole: KCJJDU) sur Activision Blizzard, Electronic Arts et Take-Two Interactive est doté d’un coupon de 12,00 pour cent par an. La distribution est échue indépendamment de l’évolution des cours des trois développeurs de jeux américains. Le remboursement final est couplé aux sous-jacents. Les investisseurs se voient rembourser l’intégralité du nominal à l’échéance pour autant qu’aucune action n’ait atteint ou ne soit passée sous la barrière de 60 pour cent du niveau initial.

Risques: il n’existe aucune protection du capital pour le produit présenté. Si, pendant la durée de l’investissement, l’un des sous-jacents atteint une seule fois la barrière respective («Kick-In Level») ou est inférieur à celle-ci, le remboursement par amortissement en espèces à l’échéance est basé sur la performance la plus faible (base Strike) du trio (au maximum toutefois à la valeur nominale majorée du coupon). Dans un tel cas, des pertes sont probables. Par ailleurs, avec les produits structurés, l’investisseur supporte le risque d’émetteur. Cela signifie qu’en cas d’insolvabilité d’UBS SA, le capital investi peut être perdu, indépendamment de l’évolution du sous-jacent.

Vous trouverez davantage de produits UBS et des informations sur les opportunités et les risques à l’adresse ubs.com/keyinvest.

Activision vs. Electronic Arts vs.Take-Two (5 ans)¹

Source: UBS AG, Bloomberg

Valeurs du: 05.09.2018

12.00% p.a. Worst of Kick-In GOAL sur Activision / Electronic Arts / Take-Two

Symbol KCJJDU
SVSP Name Barrier Reverse Convertible
SPVSP Code 1230
Sous-jacent Activision, Electronic Arts, Take-Two
Devise USD
Coupon 12.00% p.a.
Strike Level 100%
Kick-In Level 60.00%
Echéance 12.09.2019
Émetteur UBS AG, London
Date de fixation du prix 12.09.2018, 15:00 Uhr
 

Vous trouverez davantage de produits UBS et des informations sur les opportunités et les risques à l’adresse ubs.com/keyinvest.

Source: UBS AG, Bloomberg

Valeurs du: 05.09.2018

¹) La performance passée n’indique pas les résultats futures.
²) Les condition des ETTs sont vérifiés annuellement et peuvent être ajustées avec un délai de 13 mois après la publication.
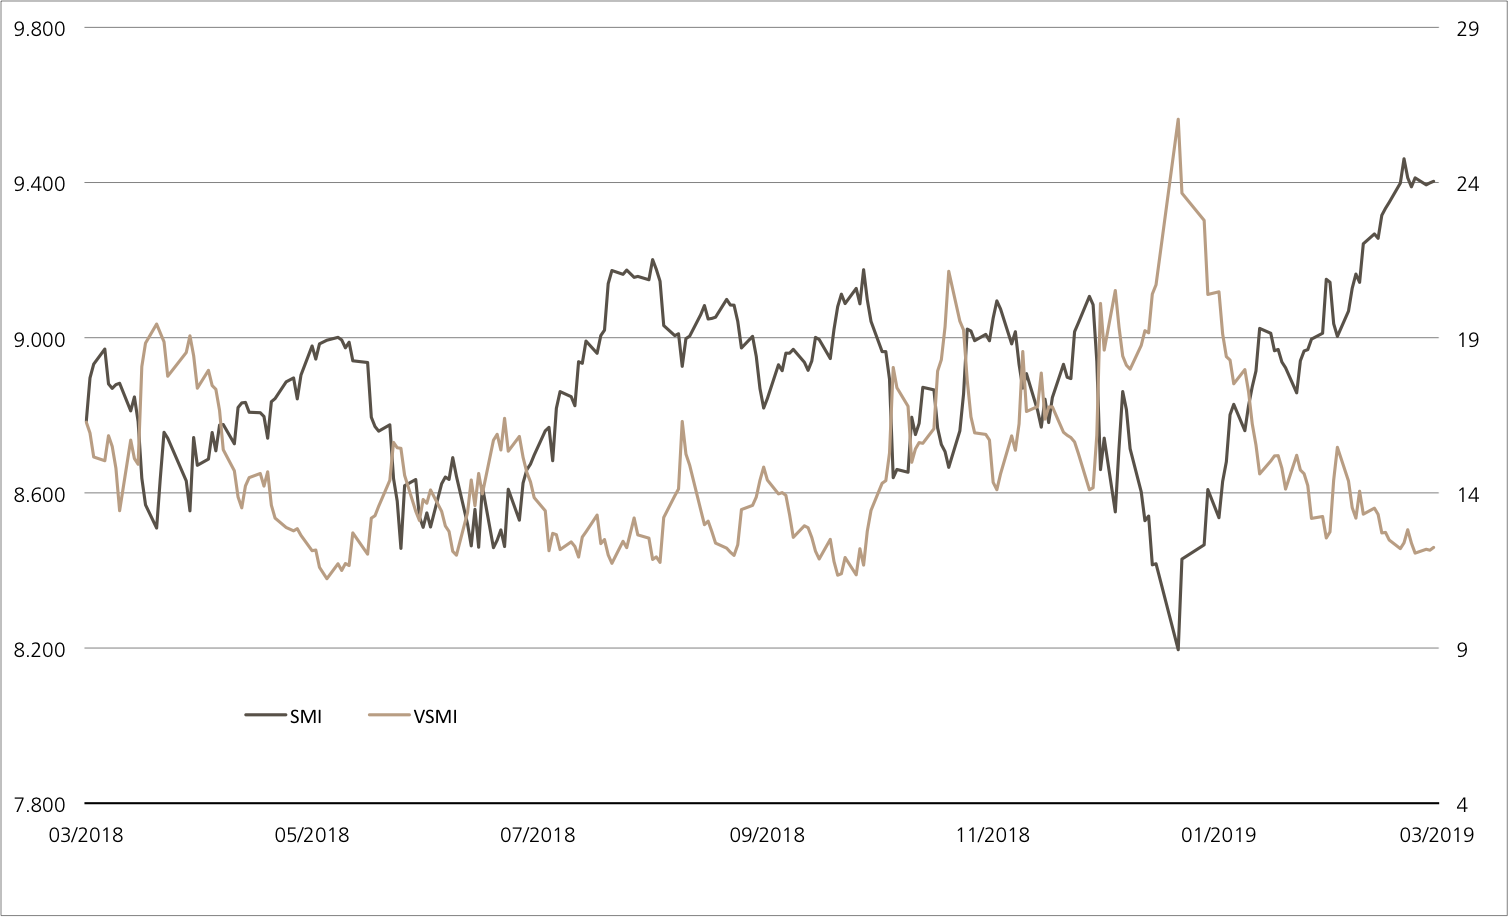
This material has been prepared by UBS AG or one of its affiliates («UBS»). This material is for distribution only as permitted by law. It is not prepared for the needs of any specific recipient. It is published solely for information and is not a solicitation or offer to buy or sell any securities or related financial instruments (“Instruments”). UBS makes no representation or warranty, either express or implied, on the completeness or reliability of the information contained in this document (“Information”) except that concerning UBS AG and its affiliates. The Information should not be regarded by recipients as a substitute for using their own judgment. Any opinions expressed in this material may change without notice and may be contrary to opinions expressed by other business areas of UBS as a result of using different assumptions or criteria. UBS is under no obligation to update the Information. UBS, its officers, employees or clients may have or have had an interest in the Instruments and may at any time transact in them. UBS may have or have had a relationship with entities referred to in the Information. Neither UBS nor any of its affiliates, or their officers or employees, accepts any liability for any loss arising from use of the Information. This presentation is not a basis for entering into a transaction. Any transaction between you and UBS will be subject to the detailed provisions of the term sheet, confirmation or electronic matching systems relating to that transaction. Clients wishing to effect transactions should contact their local sales representative.
This information is communicated by UBS AG and/or its affiliates («UBS»). * (see below) UBS may from time to time, as principal or agent, have positions in, or may buy or sell, or make a market in any securities, currencies, financial instruments or other assets underlying the product to which this website relates (the «Structured Product»). UBS may provide investment banking and other services to and/or have officers who serve as directors of the companies referred to in this website. UBS’s trading and/or hedging activities related to the Structured Product may have an impact on the price of the underlying asset and may affect the likelihood that any relevant barrier or relevant trigger event is crossed or triggered. UBS has policies and procedures designed to minimise the risk that officers and employees are influenced by any conflicting interest or duty and that confidential information is improperly disclosed or made available. UBS may pay or receive brokerage or retrocession fees in connection with the Structured Product described herein. In respect of any Structured Product that is a security, UBS may, in certain circumstances, sell the Structured Product to dealers and other financial institutions at a discount to the issue price or rebate to them for their own account some proportion of the issue price. Further information is available on request. Structured Products are complex and may involve a high risk of loss. Prior to purchasing the Structured Product you should consult with your own legal, regulatory, tax, financial and accounting advisors to the extent you consider it necessary, and make your own investment, hedging and trading decisions (including decisions regarding the suitability of the Structured Product) based upon your own judgement and advice from those advisers you consider necessary. Save as otherwise expressly agreed in writing, UBS is not acting as your financial adviser or fiduciary in relation to the Product. UBS generally hedges its exposure to Structured Products, although it may elect not to hedge or to partially hedge any Structured Product. UBS’s hedging activity may be conducted through transactions in the underlying asset, index or instrument or in options, futures or other derivatives related to the underlying asset, index or instrument on publicly traded markets or otherwise, and may have an impact on the price of the under-lying asset. If a transaction is cash settled, UBS will generally unwind or offset any hedge it has for such Structured Product in close proximity to the relevant valuation time or period. In some cases, this activity may affect the value of the Structured Product. Unless stated otherwise in this document, (i) this document is for information purposes only and should not be construed as an offer, personal recommendation or solicitation to purchase the Structured Product and should not be treated as giving investment advice, and (ii) the terms of any investment in the Structured Product will be exclusively subject to the detailed provisions, including risk considerations, contained in the more detailed legal documentation that relates to the Structured Product (being the confirmation, information memorandum, prospectus or other issuer documentation as relevant). UBS makes no representation or warranty relating to any information herein which is derived from independent sources. This document shall not be copied or reproduced without UBS’s prior written permission. In respect of any Structured Product that is a security, no action has been or will be taken in any jurisdiction that would permit a public offering of the Product, save where explicitly stated in the issuer documentation. The Structured Product must be sold in accordance with all applicable selling restrictions in the jurisdictions in which it is sold.
© UBS 2018. All rights reserved. UBS prohibits the forwarding of this information without the approval of UBS.
Weekly-Hits édition de 07.09.20182018-09-07T17:14:56+02:00

Weekly-Hits edition of 07.09.2018

KeyInvest Weekly Hits

Friday, 07.09.2018

ubs_weeklyhits_japan
  • Topic 1: Japan – Highs and lows in Nippon
  • Topic 2: Computer games – The gaming market is booming

Japan
Highs and lows in Nippon

The Japanese economy finds itself in a constant state of fluctuation. While the economy continued to expand for more than two years until the end of 2017, the longest growth period since the end of the 1980s, the first quarter of 2018 saw the country suffer a setback. Despite all of the efforts of Prime Minister Shinzo Abe, Japan’s economic recovery is lacking in stamina. Nevertheless, the government is not admitting defeat, as it can ultimately rely on the central bank and its expansive monetary policy. “There will be no interest rate hikes for a good while,” clarified the current Governor of the Bank of Japan Haruhiko Kuroda recently in an interview with the «Yomiuri Shimbun» newspaper. (Source: Thomson Reuters, media report, 9.1.2018). The Open End PERLES (symbol: NIKKY) on the NIKKEI 225™ allows for direct participation – at no cost – on the key Japanese index. More cautious investors can use the new Callable Worst of Kick-In GOAL (symbol: KCITDU) to invest in the NIKKEI 225™, S&P 500™, SMI™ and Euro STOXX 50™ with conditional partial protection. The product provides a risk buffer of 40% and a return opportunity of 4.50% p.a.

The Japanese economy is currently traversing many highs and lows. For example, the employment situation in the “Land of the Rising Sun” was on the negative side in August, as the unemployment rate increased by slightly more than it was expected to, reaching 2.5% after standing at 2.4% in the previous month. In addition, Japan’s industrial output in July was down 0.1% on the previous month, which contrasted with the general consensus that it would increase by 0.2%. The decline in output was partly due to lower vehicle and steel exports. Nevertheless, the Japanese economy is displaying encouraging signals. Following the decline in the gross domestic product (GDP) in the first quarter, the economy performed a turnaround in the subsequent period between April and June. Thanks to rising consumer spending and higher investments, the country is back on track to enjoy growth. According to a first estimate, GDP was up 0.5% on the previous quarter, after economists had only forecast an increase of 0.3%.

Meanwhile, the trade dispute with the US is hanging over Japan like the Sword of Damocles. US President Donald Trump is pressuring Tokyo to sign a bilateral free trade agreement under the threat of higher tariffs. The Japanese government is reluctant to sign such an agreement and continues to look to multilateral free trade agreements. For example, the EU and Japan concluded a free trade agreement in mid-July after five years at the negotiating table. The agreement thus creates a common economic area for over 600 million people in which more than a quarter of the world’s GDP is generated. Both parties emphasized that the conclusion of this agreement points the way for “free, fair and rule-based trade and takes a stand against protectionism”.

Opportunities: Since the incumbent Prime Minister Shinzo Abe took office at the end of 2012, the NIKKEI 225™ has more than doubled. ¹ For investors who want to invest in further upward trends, an Open End PERLES (symbol: NIKKY) is available on the Japanese benchmark index. The participation product tracks the price history of the underlying. Please note: The product denominated in CHF does not include currency hedging. If, on the other hand, you would like to operate with partial protection due to global political and economic uncertainties, you could take a look at the Callable Kick-In GOAL (symbol: KCITDU) on the NIKKEI 225™, S&P 500™, SMI™ and Euro STOXX 50™. The 40% risk buffer allows for moderate setbacks without putting the return opportunity of 4.50% p.a. at risk.

Risks: These products do not have capital protection. With Open End PERLES, losses are incurred if the underlying index falls. If, for Worst of Kick-In GOAL, the underlyings equal or fall below the respective kick-in level (barrier) and the callable feature does not apply, the amount repaid on the date of maturity may be in cash, reflecting the worst performance of the four shares (but not more than nominal value plus coupon). In this case, it is likely that losses will be incurred. Investors in structured products are also exposed to issuer risk, which means that the invested capital may be lost if UBS AG becomes insolvent, regardless of the performance of the underlying.

More UBS products and further information on the risks and opportunities are available at ubs.com/keyinvest.

NIKKEI 225™ Index (5 years)¹

Source: UBS AG, Bloomberg

As of 05.09.2018

SMI™ vs. Euro STOXX 50™ vs. S&P 500™ vs. Nikkei 225™ (5 years)¹

Source: UBS AG, Bloomberg

As of: 05.09.2018

¹) Please be aware that past performance does not indicate future results.
²) The conditions of ETTs are reviewed on a yearly basis and can be adjusted with a deadline of 13 months after the announcement.

Open End PERLES on NIKKEI 225™

Symbol NIKKY
SVSP Name Tracker-Certificate
SPVSP Code 1300
Underlying NIKKEI 225™ Index
Ratio 10:1
Currency CHF
Administration fee 0.00%
Participation 100%
Expiry Open End
Issuer UBS AG, London
Bid/ask CHF 19.55 / 19.65
 

4.50% p.a. Callable Worst of Kick-In GOAL on SMI™ / Euro STOXX 50™ / S&P 500™ / Nikkei 225™

Symbol KCITDU
SVSP Name Barrier Reverse Convertible
SPVSP Code 1230 (Callable)
Underlyings SMI™ / Euro STOXX 50™ / S&P 500™ / Nikkei 225™
Currency CHF (Quanto)
Coupon 4.50% p.a.
Kick-In Level 60.00%
Expiry 03.09.2021
Issuer UBS AG, London
Issue price 100.00%
 

More UBS products and further information on the risks and opportunities are available at ubs.com/keyinvest.

Source: UBS AG, Bloomberg

As of: 05.09.2018

Market overview

Index Quotation Week¹
SMI™ 8’868.86 -2.4%
SLI™ 1’450.84 -2.4%
S&P 500™ 2’888.60 -0.9%
Euro STOXX 50™ 3’315.62 -4.1%
S&P™ BRIC 40 3’902.26 -4.9%
CMCI™ Compos. 921.68 -1.1%
Gold (troy ounce) 1’201.30 -0.8%

¹ Change based on the closing price of the previous day compared to the closing price a week ago.

SMI™ vs. VSMI™ 1 year

The VSMI™ Index is calculated since 2005. It shows the volatility of the stocks within the SMI™ index. A portfolio which reacts only to changes in volatility instead of volatility itself is relevant for the calculation. Thereby, the VSMI™ methodology uses the squared volatility, known as variance, of the SMI options with remaining time to expiry of 30 days traded at the Eurex.

Source: UBS AG, Bloomberg

As of: 05.09.2018

Computer games
The gaming market is booming

At the end of August, gamers from around the world arrived en masse in Cologne for the world’s largest trade fair for video games, Gamescom, setting new records with over 1,000 exhibitors and 370,000 visitors. Activision Blizzard were just one of the big names in attendance, with the US video games developer being presented with the Gamescom Award for the best action game. The holding company also gave visitors a glimpse of the eagerly awaited game “Call of Duty: Black Ops 4”, which has been given a retail release on October 12, 2018. Gamers are not the group of people to love Activision , the company also has a huge number of fans on the equity market. The share price has more than tripled in value over the past few five years. Competitors Electronic Arts and Take-Two have recorded even greater growth in their respective share prices in the same period of time. ¹ In the event that the trio will take a little break, the Worst of Kick-In GOAL (symbol: KCJJDU) currently in subscription is suitable. If the barrier remains intact at 60% of the starting prices, the product returns the maximum amount of 12.00% p.a.

Global growth: According to information provided by market researcher Newzoo, video games sales look set to increase from the USD 121.7 billion recorded in the past year to USD 180.1 billion in 2021, primarily thanks to the increasing popularity of mobile games. This equates to an average annual growth rate of 10.3%. (Source: Newzoo.com) Take-Two and Activision have also shown strong growth lately, with both companies’ Q2 figures exceeding expectations. While Activision has seen its profits enjoy surprisingly strong growth of 65% thanks to the success of the «Call of Duty» blockbuster series, Take-Two has been a positive surprise with sales increasing by just under 12%. The increase in the company’s revenues has been driven by games such as Grand Theft Auto and NBA 2K18. Although the third company under the spotlight, Electronic Arts, likewise achieved an impressive interim result, its outlook for the current quarter is disappointing. At the same time, however, the company will be bolstered by new games such as “Madden NFL” and *Battlefield V”, which are scheduled to be released in the second half of the year.

Opportunities: The new Worst of Kick-In GOAL (symbol: KCJJDU) for Activision Blizzard, Electronic Arts and Take-Two Interactive has a coupon of 12.00% p.a. The distribution will be paid out regardless of the performance of the three US games developers. Meanwhile, the final repayment is linked to the underlyings. If none of the shares fall at or below the barrier of 60% of the starting price, investors will receive the nominal amount fully repaid upon maturity.

Risks: This product does not have capital protection. If the underlyings touch or fall below the respective Kick-In level (barrier), the amount repaid on the date of maturity may be in cash, reflecting the worst performance of the three shares (but not more than nominal value plus coupon). In this case, it is likely that losses will be incurred. Investors in structured products are also exposed to issuer risk, which means that the invested capital may be lost if UBS AG becomes insolvent, regardless of the performance of the underlying.

More UBS products and further information on the risks and opportunities are available at ubs.com/keyinvest.

Activision vs. Electronic Arts vs.Take-Two (5 years)¹

Source: UBS AG, Bloomberg

As of: 05.09.2018

12.00% p.a. Worst of Kick-In GOAL on Activision / Electronic Arts / Take-Two

Symbol KCJJDU
SVSP Name Barrier Reverse Convertible
SPVSP Code 1230
Underlyings Activision, Electronic Arts, Take-Two
Currency USD
Coupon 12.00% p.a.
Strike Level 100%
Kick-In Level 60.00%
Expiry 12.09.2019
Issuer UBS AG, London
Subscription until 12.09.2018, 15:00 Uhr
 

More UBS products and further information on the risks and opportunities are available at ubs.com/keyinvest.

Source: UBS AG, Bloomberg

As of: 05.09.2018

¹) Please be aware that past performance does not indicate future results.
²) The conditions of ETTs are reviewed on a yearly basis and can be adjusted with a deadline of 13 months after the announcement.

This material has been prepared by UBS AG or one of its affiliates («UBS»). This material is for distribution only as permitted by law. It is not prepared for the needs of any specific recipient. It is published solely for information and is not a solicitation or offer to buy or sell any securities or related financial instruments (“Instruments”). UBS makes no representation or warranty, either express or implied, on the completeness or reliability of the information contained in this document (“Information”) except that concerning UBS AG and its affiliates. The Information should not be regarded by recipients as a substitute for using their own judgment. Any opinions expressed in this material may change without notice and may be contrary to opinions expressed by other business areas of UBS as a result of using different assumptions or criteria. UBS is under no obligation to update the Information. UBS, its officers, employees or clients may have or have had an interest in the Instruments and may at any time transact in them. UBS may have or have had a relationship with entities referred to in the Information. Neither UBS nor any of its affiliates, or their officers or employees, accepts any liability for any loss arising from use of the Information. This presentation is not a basis for entering into a transaction. Any transaction between you and UBS will be subject to the detailed provisions of the term sheet, confirmation or electronic matching systems relating to that transaction. Clients wishing to effect transactions should contact their local sales representative.
This information is communicated by UBS AG and/or its affiliates («UBS»). * (see below) UBS may from time to time, as principal or agent, have positions in, or may buy or sell, or make a market in any securities, currencies, financial instruments or other assets underlying the product to which this website relates (the «Structured Product»). UBS may provide investment banking and other services to and/or have officers who serve as directors of the companies referred to in this website. UBS’s trading and/or hedging activities related to the Structured Product may have an impact on the price of the underlying asset and may affect the likelihood that any relevant barrier or relevant trigger event is crossed or triggered. UBS has policies and procedures designed to minimise the risk that officers and employees are influenced by any conflicting interest or duty and that confidential information is improperly disclosed or made available. UBS may pay or receive brokerage or retrocession fees in connection with the Structured Product described herein. In respect of any Structured Product that is a security, UBS may, in certain circumstances, sell the Structured Product to dealers and other financial institutions at a discount to the issue price or rebate to them for their own account some proportion of the issue price. Further information is available on request. Structured Products are complex and may involve a high risk of loss. Prior to purchasing the Structured Product you should consult with your own legal, regulatory, tax, financial and accounting advisors to the extent you consider it necessary, and make your own investment, hedging and trading decisions (including decisions regarding the suitability of the Structured Product) based upon your own judgement and advice from those advisers you consider necessary. Save as otherwise expressly agreed in writing, UBS is not acting as your financial adviser or fiduciary in relation to the Product. UBS generally hedges its exposure to Structured Products, although it may elect not to hedge or to partially hedge any Structured Product. UBS’s hedging activity may be conducted through transactions in the underlying asset, index or instrument or in options, futures or other derivatives related to the underlying asset, index or instrument on publicly traded markets or otherwise, and may have an impact on the price of the under-lying asset. If a transaction is cash settled, UBS will generally unwind or offset any hedge it has for such Structured Product in close proximity to the relevant valuation time or period. In some cases, this activity may affect the value of the Structured Product. Unless stated otherwise in this document, (i) this document is for information purposes only and should not be construed as an offer, personal recommendation or solicitation to purchase the Structured Product and should not be treated as giving investment advice, and (ii) the terms of any investment in the Structured Product will be exclusively subject to the detailed provisions, including risk considerations, contained in the more detailed legal documentation that relates to the Structured Product (being the confirmation, information memorandum, prospectus or other issuer documentation as relevant). UBS makes no representation or warranty relating to any information herein which is derived from independent sources. This document shall not be copied or reproduced without UBS’s prior written permission. In respect of any Structured Product that is a security, no action has been or will be taken in any jurisdiction that would permit a public offering of the Product, save where explicitly stated in the issuer documentation. The Structured Product must be sold in accordance with all applicable selling restrictions in the jurisdictions in which it is sold.
© UBS 2018. All rights reserved. UBS prohibits the forwarding of this information without the approval of UBS.
Weekly-Hits edition of 07.09.20182018-09-07T17:13:28+02:00

Weekly Hits EN Template 3 Seiten

KeyInvest Weekly Hits

Friday, 27.07.2018

Weekly Hits Versorger
  • Topic 1: Europäische Versorger – Transformation kommt an
  • Topic 2: Netflix – Gerissene Erfolgsserie

Ölmarkt
Strukturelles Wachstum

Der globale Ölmarkt ist drauf und dran, eine historische Schallmauer zu durchbrechen. Im laufenden zweiten Semester 2018 könnte die Nachfrage im Durchschnitt erstmals bei mehr als 100 Millionen Barrel pro Tag (MBpT) liegen. UBS CIO WM geht davon aus, dass der Verbrauch 2019 weiter zunimmt. Trotz dieser Prognose stockt der Aufwärtstrend beim Ölpreis: Die US-Sorte Western Texas Intermediate notiert rund ein Zehntel unter dem Anfang Juli erreichten Mehrjahreshoch von 75.27 US-Dollar je Barrel.¹ Mit einer CPN (Symbol: KBTVDU) können Anleger kapitalgeschützt und überproportional darauf setzen, dass das schwarze Gold den übergeordneten Aufwärtstrend fortsetzt. Während dieses Produkt bereits an der SIX Swiss Exchange kotiert ist, basiert ein in der Zeichnung stehender Worst of Kick-In GOAL (Symbol: KCIHDU) auf drei prominenten Öl- und Gasunternehmen: BP, Total und Royal Dutch Shell. Anleger erhalten hier eine Couponzahlung von 5.50 Prozent p.a. Diese Renditechance ist mit einem Sicherheitspolster von 31 Prozent für jeden der drei Basiswerte verbunden.

In einem kürzlich veröffentlichten Kommentar stellte UBS CIO WM fest, dass die durchschnittliche weltweite Ölnachfrage über die vergangenen fünf Jahre um sieben MBpT zugelegt hat. Neben den ab 2015 reduzierten Preisen nennen die Experten das starke Wirtschaftswachstum als zentralen Antriebsfaktor. Viele Marktteilnehmer sind der Ansicht, dass die OPEC mit den zusammen mit weiteren Förderländern ab 2016 eingeführten Produktionskürzungen die massive Überversorgung am Ölmarkt beendet hat. Allerdings hätte die Rückkehr ins Gleichgewicht laut CIO WM ohne den hohen Verbrauch noch länger gedauert. Die Analysten rechnen damit, dass die Nachfrage im kommenden Jahr weiter zunimmt. Mit 1.2 bis 1.4 MBpT dürfte das Wachstum über dem langfristigen Trend liegen. Der Grossteil der Nachfrage wird bis auf Weiteres aus den USA kommen. Als Wachstumstreiber bezeichnet CIO WM die Schwellenländer. China und Indien rangieren in punkto Nachfrage schon jetzt auf den Plätzen zwei und drei. Was die kurzfristigen Aussichten anbelangt, spielt der Iran eine entscheidende Rolle. Wegen der von den USA neu verhängten Sanktionen, gehen die Ölexporte dieses wichtigen OPEC-Mitglieds stark zurück. CIO WM rechnet vor diesem Hintergrund mit steigenden Preisen. (Quelle: UBS CIO WM Energie Rohöl: Nachfrage steuert auf 100 MBpT zu, 25.07.2018)

Zu den unmittelbaren Nutzniessern eines solchen Szenarios zählen die grossen Öl- und Gaskonzerne. Schon jetzt lässt die Aufwärtsbewegung beim schwarzen Gold die Gewinne in dem Sektor sprudeln. Das gilt auch für die europäischen Multis. Beispiel Total: Im zweiten Quartal 2018 erhöhte der französische Konzern die Produktion um 8.7 Prozent. Gleichzeitig steigerte das Unternehmen den Gewinn um 44 Prozent auf 3.6 Milliarden US-Dollar. Eine für den Sektor durchaus typische Entwicklung zeigt Total auch beim operativen Cashflow. Von April bis Juni 2018 erreichten die Mittelzuflüsse 6.2 Milliarden US-Dollar – 35 Prozent mehr als im Vorjahreszeitraum. (Quelle: Total Medienmitteilung, 26.07.2018)

Opportunities: Der ETT (Symbol: ETUTI) auf den STOXX™ Europe 600 Utilities Index ermöglicht nicht nur ein breit diversifiziertes Investment in diesen sprichwörtlich energiegeladenen Sektor. Da es sich beim Basiswert um die Net-Return-Variante des Benchmark handelt profitieren Anleger von den attraktiven Ausschüttungen der enthaltenen Unternehmen. Per 31. Mai 2018 belief sich die Dividenden-rendite des Index auf 4.8%. Zum Vergleich: Beim STOXX™ Europa 600 Index betrug die Kennzahl zum Stichtag 3.4%. (Quelle: STOXX Indexfactsheet, 31.05.2018) UBS greift das Momentum des europäischen Versorgersektors mit einem neuen Wost of Kick-In GOAL (Symbol: KCBJDU) auf. Typisch für die UBS-Produktkategorie ETT fallen keine laufenden Verwaltungsgebühren an.² Die Basiswerte E.ON, Enel und RWE ermöglichen einen Coupon in Höhe von 6.25 Prozent p.a. Zudem geht das prominente Trio mit einem komfortablen Sicherheitspuffer von 36 Prozent in die einjährige Laufzeit.

Risks: Der Kapitalschutz greift bei der CPN erst zum Verfalltermin. Während der Laufzeit kann es zu Preisschwankungen kommen. Worst of Kick-In GOALs sind dagegen nicht kapitalgeschützt. Notiert einer der Basiswerte während der Laufzeit einmal auf oder unter dem jeweiligen Kick-In Level (Barriere), kann die Rückzahlung am Verfalltag durch Bartilgung entsprechend der (vom Strike aus) schwächsten Performance unter den Basiswerten erfolgen (höchstens jedoch zum Nominalwert zuzüglich Coupon). In diesem Fall sind Verluste wahrscheinlich. Zudem trägt der Anleger bei strukturierten Produkten das Emittentenrisiko, so dass das eingesetzte Kapital – unabhängig von der Entwicklung des Basiswertes – im Falle einer Insolvenz der UBS AG verloren gehen kann.

More UBS products and further information on the risks and opportunities are available at ubs.com/keyinvest.

WTI Crude Oil (USD je Barrel) 5 Jahre¹

Zum ersten Mal seit November 2014 kostet ein Barrel WTI Anfang Juli mehr als 75 US-Dollar. Auch wenn der Energieträger dieses Niveau nicht halten konnte: Der übergeordnete Aufwärtstrend ist intakt.

Source: UBS AG, Bloomberg

As of 25.07.2018

BP vs. Total vs. Royal Dutch Shell (5 Jahre, nur zu illustrativen Zwecken, Angaben in %)¹

Die drei europäischen Ölmultis zeigen über einen historischen Zeitraum von fünf Jahren eine starke Korrelation. Dabei führt Total das Trio mit einem knappen Vorsprung auf BP und Royal Dutch Shell an.

Source: UBS AG, Bloomberg

As of: 25.07.2018

¹) Please be aware that past performance does not indicate future results.
²) The conditions of ETTs are reviewed on a yearly basis and can be adjusted with a deadline of 13 months after the announcement.

CPN auf WTI Crude Oil

Symbol KBTVDU
SVSP Name Column 1 Value
SPVSP Code Column 1 Value
Partizipation Column 1 Value
Verfall Column 1 Value
Emittentin Column 1 Value
SPVSP Code Column 1 Value
 

5.50% p.a. Worst of Kick-In GOAL auf BP / Total / Royal Dutch Shell

Symbol Column 1 Value
SVSP Name Column 1 Value
SPVSP Code Column 1 Value
Partizipation Column 1 Value
Verfall Column 1 Value
Emittentin Column 1 Value
SPVSP Code Column 1 Value
 

More UBS products and further information on the risks and opportunities are available at ubs.com/keyinvest.

Source: UBS AG, Bloomberg

As of: 25.07.2018

Market overview

Index Quotation Week¹
SMI™ 9’048.20 1.4%
SLI™ 9’048.20 1.4%
S&P 500™ 9’048.20 1.4%
Euro STOXX 50™ 9’048.20 1.4%
S&P™ BRIC 40 9’048.20 1.4%
CMCI™ Compos. 9’048.20 1.4%
Gold (Feinunze) 9’048.20 1.4%

¹ Change based on the closing price of the previous day compared to the closing price a week ago.

SMI™ vs. VSMI™ 1 Jahr

The VSMI™ Index is calculated since 2005. It shows the volatility of the stocks within the SMI™ index. A portfolio which reacts only to changes in volatility instead of volatility itself is relevant for the calculation. Thereby, the VSMI™ methodology uses the squared volatility, known as variance, of the SMI options with remaining time to expiry of 30 days traded at the Eurex.

Source: UBS AG, Bloomberg

As of: 25.07.2018

Netflix
Gerissene Erfolgsserie

„Wer viel wagt, der viel gewinnt“, heisst es gerne an den Kapitalmärkten. Um Aktien in risikoreiche und risikoärmere Papiere einzuteilen, bedienen sich Experten in der Regel der Kursschwankungen. Je nach Höhe der Volatilität werden die Papiere segmentiert. Dabei gilt: Je höher die Schwankungen, desto risikoreicher die Aktie – und umgekehrt. Höheres Risiko muss aber nicht gleich höhere Rendite bedeuten. Auch die „Langweiler“ können aus Ertragsgesichtspunkten durchaus attraktiv erscheinen. Den Beleg dafür liefert der K Switzerland Low Volatility Index. Das Barometer, das auf eine „Niedrige-Volatilität-Aktien“-Strategie abzielt, liegt im laufenden Jahr klar vor dem SMI™.¹ Mit dem PERLES (Symbol: SOLVZU) können sich Anleger die aussichtsreiche Strategie bequem und kostengünstig ins Portfolio holen. Das Produkt bietet bei einer jährlichen Gebühr von 1.00 Prozent eine vollständige Partizipation an steigenden Kursen des breit gefächerten Basiswertes.¹

Insgesamt befinden sich 20 Aktien von Schweizer Unternehmen in dem Index, welche über einen Zeitraum von 90 Tagen die geringste Kursvolatilität aufweisen. Mit abnehmender Schwankungsbreite – gemessen relativ zu den anderen Indexmitgliedern – erhöht sich die Gewichtung eines einzelnen Tites. Allerdings ist der Anteil jedes Mitglieds auf zehn Prozent begrenzt. Damit das Strategiebarometer immer up-to-date ist, wird der Selektions- und Gewichtungsprozess einmal pro Monat umgesetzt. In dem Index sind derzeit Blue Chips wie Nestlé, Roche oder auch Zurich Insurance ebenso enthalten, wie auch Titel aus der zweiten und dritten Börsenreihe. Aus dem SMIM™ sind beispielsweise unter anderem Baloise, EMS Chemie sowie Lindt & Sprüngli mit von der Partie. Gutlaufende Geschäe schoben den Kurs des letztgenannten Schoggi-Konzerns dieses Jahr bereits um mehr als 15 Prozent an. Mehr als doppelt so schnell war der SPI™-Titel Siegfried Holding in diesem Jahr unterwegs. Der Pharmazulieferer wächst allerdings auch rasant: Der Halbjahresgewinn legte um 41.1 Prozent auf 30.5 Millionen Franken zu.¹

Opportunities: Selbst wenn die Experten nicht Recht behalten und die Netflix-Aktie eine gemächlichere Gangart einlegt, wäre mit dem Kick-In GOAL (Symbol: KCEFDU) eine attraktive Rendite von 10.0 Prozent p.a. möglich. Der Coupon in dieser Höhe wird durch die Emittentin unabhängig vom Fortgang des Basiswertes ausbezahlt. Derweil ist die Tilgung des Nominals durch eine tiefe Barriere bei 60 Prozent des Anfangsniveaus teilgeschützt. Solange Netflix nicht auf oder unter den Kick-In Level fällt, erhalten Anleger das Nominal am Verfalltermin vollständig zurückbezahlt.

Risks: Das vorgestellte Produkt ist nicht kapitalgeschützt. Bei einem PERLES kommt es zu Verlusten, sobald der zugrundeliegende Index fällt. Zudem trägt der Anleger bei strukturierten Produkten das Emittentenrisiko, so dass das eingesetzte Kapital – unabhängig von der Entwicklung des Basiswertes – im Falle einer Insolvenz der UBS AG verloren gehen kann.

More UBS products and further information on the risks and opportunities are available at ubs.com/keyinvest.

K Switzerland Low Volatility Index 5 Jahre¹

Source: UBS AG, Bloomberg

As of: 25.07.2018

PERLES auf den K Switzerland Low Volatility Index (CHF)

Symbol Column 1 Value
SVSP Name Column 1 Value
SPVSP Code Column 1 Value
Partizipation Column 1 Value
Verfall Column 1 Value
Emittentin Column 1 Value
SPVSP Code Column 1 Value
 

More UBS products and further information on the risks and opportunities are available at ubs.com/keyinvest.

Source: UBS AG, Bloomberg

As of: 25.07.2018

¹) Please be aware that past performance does not indicate future results.
²) The conditions of ETTs are reviewed on a yearly basis and can be adjusted with a deadline of 13 months after the announcement.

This material has been prepared by UBS AG or one of its affiliates («UBS»). This material is for distribution only as permitted by law. It is not prepared for the needs of any specific recipient. It is published solely for information and is not a solicitation or offer to buy or sell any securities or related financial instruments (“Instruments”). UBS makes no representation or warranty, either express or implied, on the completeness or reliability of the information contained in this document (“Information”) except that concerning UBS AG and its affiliates. The Information should not be regarded by recipients as a substitute for using their own judgment. Any opinions expressed in this material may change without notice and may be contrary to opinions expressed by other business areas of UBS as a result of using different assumptions or criteria. UBS is under no obligation to update the Information. UBS, its officers, employees or clients may have or have had an interest in the Instruments and may at any time transact in them. UBS may have or have had a relationship with entities referred to in the Information. Neither UBS nor any of its affiliates, or their officers or employees, accepts any liability for any loss arising from use of the Information. This presentation is not a basis for entering into a transaction. Any transaction between you and UBS will be subject to the detailed provisions of the term sheet, confirmation or electronic matching systems relating to that transaction. Clients wishing to effect transactions should contact their local sales representative.
This information is communicated by UBS AG and/or its affiliates («UBS»). * (see below) UBS may from time to time, as principal or agent, have positions in, or may buy or sell, or make a market in any securities, currencies, financial instruments or other assets underlying the product to which this website relates (the «Structured Product»). UBS may provide investment banking and other services to and/or have officers who serve as directors of the companies referred to in this website. UBS’s trading and/or hedging activities related to the Structured Product may have an impact on the price of the underlying asset and may affect the likelihood that any relevant barrier or relevant trigger event is crossed or triggered. UBS has policies and procedures designed to minimise the risk that officers and employees are influenced by any conflicting interest or duty and that confidential information is improperly disclosed or made available. UBS may pay or receive brokerage or retrocession fees in connection with the Structured Product described herein. In respect of any Structured Product that is a security, UBS may, in certain circumstances, sell the Structured Product to dealers and other financial institutions at a discount to the issue price or rebate to them for their own account some proportion of the issue price. Further information is available on request. Structured Products are complex and may involve a high risk of loss. Prior to purchasing the Structured Product you should consult with your own legal, regulatory, tax, financial and accounting advisors to the extent you consider it necessary, and make your own investment, hedging and trading decisions (including decisions regarding the suitability of the Structured Product) based upon your own judgement and advice from those advisers you consider necessary. Save as otherwise expressly agreed in writing, UBS is not acting as your financial adviser or fiduciary in relation to the Product. UBS generally hedges its exposure to Structured Products, although it may elect not to hedge or to partially hedge any Structured Product. UBS’s hedging activity may be conducted through transactions in the underlying asset, index or instrument or in options, futures or other derivatives related to the underlying asset, index or instrument on publicly traded markets or otherwise, and may have an impact on the price of the under-lying asset. If a transaction is cash settled, UBS will generally unwind or offset any hedge it has for such Structured Product in close proximity to the relevant valuation time or period. In some cases, this activity may affect the value of the Structured Product. Unless stated otherwise in this document, (i) this document is for information purposes only and should not be construed as an offer, personal recommendation or solicitation to purchase the Structured Product and should not be treated as giving investment advice, and (ii) the terms of any investment in the Structured Product will be exclusively subject to the detailed provisions, including risk considerations, contained in the more detailed legal documentation that relates to the Structured Product (being the confirmation, information memorandum, prospectus or other issuer documentation as relevant). UBS makes no representation or warranty relating to any information herein which is derived from independent sources. This document shall not be copied or reproduced without UBS’s prior written permission. In respect of any Structured Product that is a security, no action has been or will be taken in any jurisdiction that would permit a public offering of the Product, save where explicitly stated in the issuer documentation. The Structured Product must be sold in accordance with all applicable selling restrictions in the jurisdictions in which it is sold.
© UBS 2018. All rights reserved. UBS prohibits the forwarding of this information without the approval of UBS.
Weekly Hits EN Template 3 Seiten2018-09-07T11:28:37+02:00

Keyinvest 04.06.2018


KeyInvest Daily Markets

Montag, 04.06.2018
  • Thema 1: SMI – Die Dämme brechen
  • Thema 2: Novartis – Verkaufssignal belastet

SMI – Die Dämme brechen

Rückblick:Nachdem der SMI Index Anfang Mai mehrfach an der Hürde bei 9.050 Punkten gescheitert war, wurde mit dem Bruch der zentralen Aufwärtstrendlinie auf Höhe von 8.862 Punkten ein kurzfristiges Verkaufssignal generiert. In der Folge setzte der Index zunächst an die Unterstützung bei 8.729 Punkten zurück. Die Versuche der Käuferseite, diese Marke zu verteidigen, scheiterten jedoch kläglich: Am vergangenen Dienstag fiel der SMI mit einem Abwärtsgap unter die Haltemarke zurück und wurde binnen weniger Tage an die langfristige Unterstützung bei 8.480 Punkten ausverkauft. Zwar konnte die Marke schon am vergangenen Freitag zurückerobert werden, doch bleibt der Wert damit stark einbruchsgefährdet.

Ausblick:Die Verkaufswelle der letzten Tage hat die Erholung seit Ende März schlagartig beendet. Sollte die Erholung nicht zügig fortgesetzt werden, drohen neue Jahrestiefs. Die Short-Szenarien: Der kurzfristige Abwärtstrend ist unterhalb der Hürde bei 8.729 Punkten trotz der jüngsten Erholung intakt und würde durch ein Unterschreiten der 8.525 Punkte-Marke direkt fortgesetzt werden können. Wird die 8.480 Punkte-Marke dabei erneut gebrochen, stünde eine Ausweitung des Ausverkaufs bis 8.375 Punkte an. Dort wäre eine weitere Erholung möglich. Auf Sicht der kommenden Tage dürfte der Index jedoch bei Kursen unter 8.480 Punkten bis an die Unterstützung bei 8.311 Punkten einbrechen. Die Long-Szenarien: Sollte dagegen der Bereich der Hochpunkte der letzten Tage bei 8.650 Punkten überschritten werden, könnte sich die kurzfristige Erholung bis 8.729 Punkte ausdehnen. Dort wäre mit der nächsten Verkaufswelle zu rechnen. Doch selbst ein Anstieg über die Barriere hätte nur wenig Potenzial und würde bereits bei 8.780 Punkten auf eine starke Hürde treffen. Derzeit wäre ohnehin erst ein Anstieg über 8.862 Punkte bullish zu werten.

SMI

Valor: 998089
ISIN: CH0009980894
Kursstand: 8.618,54 Punkte
Tendenz: seitwärts/abwärts
Widerstände: 8.729+8.780+8.862
Unterstützungen: 8.525+8.480+8.311

Stand 04.06.2018, 7:00 Uhr; Quelle: BörseGo AG

SMI6-Monats-ChartQuelle: BörseGo AGSMI5-Jahres-ChartQuelle: BörseGo AG

Produkt (Call) Symbol SL/KO/Strike* Hebel Briefkurs
Warrant Warrant 8’300.00 CHF 15.89 1.10 CHF
Turbo Warrant Turbo Warrant 7’520.35 CHF 7.56 2.30 CHF
Produkt (Put) Symbol SL/KO/Strike* Hebel Briefkurs
Turbo Warrant Turbo Warrant 10’102.78 CHF 5.81 2.97 CHF
Mini Future Mini Future 9’035.32 CHF 17.81 0.97 CHF

*SL = Stop-Loss (Mini-Futures) / KO = Knock Out (Turbos) / Strike = Ausübungspreis (Warrants); Weitere passende Produkte sowie Informationen zu Chancen und Risiken finden Sie unter: www.ubs.com/keyinvest Stand 16.06.2017, 7:00 Uhr


Technischer Marktausblick

Index Kurs Veränderung zum Vortag kurzfristige Tendenz mittelfristige Tendenz
SMI™ 8.618,54 1,91 %
DAX™ 12.724,30 0,95 %
S&P 500™ 2.734,62 1,08 %
Nikkei™ 22.475,94 1,37 %
EUR/CHF 1,1540 0,09 %
Crude Öl 76,62 0,13 %
Gold 1.293,55 -0,02 %

 Stand 04.06.2018, 7:00 Uhr; Quelle: BörseGo AG


Novartis – Verkaufssignal belastet

Rating & Kursziel von UBS IB Research

12-Monats-Rating Neutral
Kursziel 80,00 CHF
Prognostizierte Preisänderung +7,04%
Stand 04.06.2018, 7:00 Uhr

Rückblick: Zu Jahresbeginn waren die Aktien von Novartis aus einer Konsolidierungsphase über den Widerstand bei 85,40 CHF ausgebrochen und hatten mit 88,30 CHF ein neues Rallyhoch markiert. Doch dieser steile Anstieg wurde in der Folge von einer ebenso steilen Verkaufswelle abgelöst, die mit dem Bruch zweier wichtiger Trendlinien und dem Unterschreiten der Haltemarke bei 78,00 CHF kurzfristige Verkaufssignale nach sich zog. Erst nach dem Bruch der Unterstützung bei 75,10 CHF gelang es der Käuferseite bei 74,22 CHF Ende März eine Erholung zu starten, die zunächst im Bereich von 80,00 CHF gestoppt wurde. Nach einer weiteren Abwärtsbewegung an die 74,22 CHF-Marke hatten die Bullen kurzzeitig die Chance, die Baisse mit einem Doppelboden zu beenden. Doch am Widerstand bei 78,00 CHF schlugen die Bären erneut zu und sorgten mit dem Bruch der 74,22 CHF-Marke für ein weiteres Verkaufssignal.

Ausblick: Nach einem Kursrutsch unter 73,00 CHF kam es bei den Aktien von Novartis am vergangenen Freitag zwar zu einer leichten Erholung. Die negativen Vorzeichen des jüngsten Verkaufssignals bleiben dennoch erhalten und weitere Verluste wahrscheinlich. Die Short-Szenarien: Zwar könnte der Wert in den kommenden Tagen an die 75,10 CHF-Marke steigen, doch schon dieser Widerstand dürfte die Erholungsbemühungen der Käuferseite beenden. Sollte anschliessend auch die 74,22 CHF-Marke ein weiteres Mal unterschritten werden, dürfte sich der Ausverkauf bis an das frühere Zwischentief bei 72,45 CHF  ausdehnen. An dieser Stelle hätten die Käufer die Gelegenheit eine deutlichere Erholung zu starten. Werden die Aktien von Novartis jedoch direkt oder im Anschluss an eine leichte Gegenbewegung unter die Marke gedrückt, stünde ein Rückfall an die 69,70 CHF-Marke auf der Agenda. Auf Sicht der kommenden Wochen wäre sogar ein Einbruch bis 67,00 CHF denkbar. Die Long-Szenarien: Kurse oberhalb von 75,10 CHF würden den Wert zwar nicht vor weiteren Verlusten bewahren, jedoch für eine Ausweitung der Erholung bis 76,50 CHF sprechen. Allerdings könnte erst ein Anstieg über diese Hürde eine deutlichere Aufwärtsbewegung nach sich ziehen und der Wert bis an den zentralen Widerstandsbereich von 78,00 bis 78,38 CHF gekauft werden. Es ist jedoch zu bezweifeln, ob dieses Niveau in Richtung 81,10 CHF durchbrochen werden kann.

Novartis

Valor: 1200526
ISIN: CH0012005267
Kursstand: 74,70 CHF
Tendenz: abwärts/seitwärts
Widerstände: 75,10+76,50+78,00
Unterstützungen: 74,22+72,45+69,70

Stand 04.06.2018, 7:00 Uhr; Quelle: BörseGo AGNovartis6-Monats-ChartQuelle: BörseGo AG
Novartis5-Jahres-ChartQuelle: BörseGo AG

Produkt (Call) Symbol SL/KO/Strike* Hebel Briefkurs
Warrant Warrant 75.00 CHF 19.96 0.25 CHF
Mini Future Mini Future 67.90 CHF 8.94 0.42 CHF
Produkt (Put) Symbol SL/KO/Strike* Hebel Briefkurs
Turbo Warrant Turbo Warrant 85.01 CHF 6.89 0.54 CHF
Mini Future Mini Future 85.05 CHF 6.33 0.60 CHF

*SL = Stop-Loss (Mini-Futures) / KO = Knock Out (Turbos) / Strike = Ausübungspreis (Warrants); Weitere passende Produkte sowie Informationen zu Chancen und Risiken finden Sie unter: www.ubs.com/keyinvest Stand 04.06.2018, 7:00 UhrAktuelle Kurzmeldungen

  • USA: Überraschend starker Stellenaufbau im Mai
    Im Mai betrug der Beschäftigungsaufbau in den USA 223.000 Personen, wie das US-Arbeitsministerium mitteilte. Die neuen Stellen in den beiden Vormonaten wurden zudem um 15.000 nach oben revidiert. Die Arbeitslosenquote ging um 0,1 auf 3,8% zurück. Der Lohnzuwachs betrug deutliche 0,3% im Vergleich zum Vormonat.  
  • Deutschland: Industrie-PMI sinkt im Mai
    Der von IHS Markit erhobene Einkaufsmanagerindex für das Verarbeitende Gewerbe in Deutschland sank im Mai in zweiter Veröffentlichung auf 56,9 (April: 58,1) Punkte. IHS Markit sprach von einer „spürbaren Abkühlung in der deutschen Industrie“. Verringert hätten sich nicht nur die Zuwächse bei Produktion, Auftragseingang und Beschäftigung, auch die Geschäftsaussichten seien abgesackt.
  • Weitere Stimmungsverbesserung in der US-Industrie
    Der nationale Einkaufsmanagerindex für das Verarbeitende Gewerbe in den USA, der ISM PMI Manufacturing, konnte im Mai von zuvor 57,3 auf 58,7 Punkte zulegen. Damit diagnostizieren die Befragungsteilnehmer eine Beschleunigung der ohnehin hohen ökonomischen Aktivität in der US-Industrie. 
Die in diesem Dokument enthaltenen Informationen werden ausschliesslich zu Informations- und Werbezwecken zur Verfügung gestellt und stellen weder Empfehlungen noch Anlageberatung von UBS AG, einer ihrer Tochtergesellschaften oder verbundenen Unternehmen («UBS») dar. Dieses Dokument wird nicht von einer UBS Research Abteilung ausgegeben und ist deshalb nicht als unabhängige Anlageforschung zu erachten. Es stellt weder einen Verkaufsprospekt, noch ein Angebot oder eine Einladung zur Offertenstellung dar, irgendeine Art von Anlage zu tätigen. Beachten Sie bitte, dass die Anlagebeispiele die Ansichten von UBS Research möglicherweise nicht vollständig wiedergeben. Dieses Dokument und die darin beschriebenen Produkte und Dienstleistungen sind allgemeiner Natur und beziehen sich weder auf die persönlichen Anlageziele noch die finanzielle Situation oder besonderen Bedürfnisse eines spezifischen Empfängers. Anlageentscheide sollten stets im Portfoliokontext getroffen werden und Ihre persönliche Situation und Ihre entsprechende Risikobereitschaft und Risikofähigkeit berücksichtigen. Sie werden hiermit auf diese Risiken (die mitunter erheblich sein können) hingewiesen. Bevor Sie einen Anlageentscheid treffen, lesen Sie bitte die spezifischen Produkteinformationen und die Broschüre «Besondere Risiken im Effektenhandel ». Bitte kontaktieren Sie Ihren Kundenberater, der Sie gerne bei Ihren Anlageideen unterstützt und Ihnen die spezifischen Produktinformationen zur Verfügung stellt. Das (vollständige oder teilweise) Reproduzieren, Übermitteln (elektronisch oder mit anderen Mitteln) oder Modifizieren dieser Materialien ist ohne vorherige schriftliche Zustimmung der UBS untersagt. UBS übernimmt diesbezüglich keinerlei Haftung für das Verhalten von Dritten. Wir weisen Sie darauf hin, dass sich UBS das Recht vorbehält, Dienstleistungen, Produkte und Preise jederzeit ohne vorhergehende Ankündigung zu ändern, und dass sich die wiedergegebenen Informationen und Meinungen jederzeit ändern können. Es wird weder eine ausdrückliche noch stillschweigende Gewährleistung oder Garantie in Bezug auf die Richtigkeit, Vollständigkeit oder Verlässlichkeit der wiedergegebenen Informationen abgegeben, es sei denn, es handelt sich um Informationen, die sich auf die UBS AG beziehen. Zudem stellt dieses Dokument keine umfassende Beschreibung oder Zusammenfassung der genannten Märkte und Entwicklungen dar. Gewisse Zahlen beziehen sich auf vergangene Wertentwicklungen oder stellen simulierte Wertentwicklungen dar und sind somit keine zuverlässigen Indikatoren für künftige Ergebnisse. Bei einigen Zahlen handelt es sich möglicherweise lediglich um Prognosen, und Prognosen sind kein zuverlässiger Indikator für zukünftige Entwicklungen. Gewisse Diagramme und/oder Darstellungen von Wertentwicklungen basieren möglicherweise nicht auf 12-Monate-Perioden, was ihre Vergleichbarkeit und Aussagekraft reduziert. Wechselkurse können sich negativ auf den Wert, den Preis oder die Einnahmen von Produkten und Dienstleistungen auswirken, die in den Materialien genannt werden. Gebühren sind möglicherweise nicht enthalten und reduzieren die Wertentwicklung entsprechend. Die steuerliche Behandlung hängt von den individuellen Umständen jedes Kunden ab und kann sich in Zukunft ändern. UBS erbringt keine Rechtsoder Steuerberatungsdienste und gibt weder allgemeine noch auf die spezifischen Umstände und Bedürfnisse eines Kunden bezogene Erklärungen im Hinblick auf die steuerliche Behandlung von Anlagen oder der damit verbundenen Anlagerenditen ab. Die Empfänger sollten eine unabhängige rechtliche und steuerliche Beratung im Hinblick auf die Auswirkungen der Produkte/Dienstleistungen in der jeweiligen Rechtsordnung sowie die Eignung der Produkte und Dienstleistungen in Anspruch nehmen. UBS, ihre Verwaltungsräte, Geschäftsführer und Mitarbeiter oder Kunden halten oder hielten möglicherweise Anteile oder Hausse- und Baisse-Positionen («Long- oder Short-Positionen») an den hierin genannten Wertpapieren oder sonstigen Finanzinstrumenten und können jederzeit als Auftraggeber oder Beauftrage Käufe und/oder Verkäufe tätigen. UBS fungiert oder fungierte möglicherweise als Marktmacher («Market-Maker») bei den Wertpapieren oder sonstigen Finanzinstrumenten. Des Weiteren unterhält oder unterhielt UBS möglicherweise eine Geschäftsbeziehung mit oder erbringt oder erbrachte Investmentbanking-, Kapitalmarktdienstleistungen und/oder sonstige Finanzdienstleistungen für die jeweiligen Unternehmen. Dieses Dokument und die darin enthaltenen Informationen sind ausschliesslich für Personen mit Domizil Schweiz gedacht. Sie dürfen unter keinen Umständen in Rechtsordnungen verbreitet werden, in denen eine solche Verbreitung gegen geltende Gesetze oder Regulierungen verstösst. Sie dürfen insbesondere nicht in den USA und/oder an US-Personen oder in Rechtsordnungen verteilt werden, in denen der Vertrieb durch uns eingeschränkt ist. Die im Dokument enthaltenen Informationen stammen, sofern nicht anders angegeben, von UBS. UBS übernimmt keine Gewährleistung (weder ausdrücklich noch stillschweigend) für Richtigkeit, Vollständigkeit und Aktualität der Informationen. Sie können jederzeit und ohne vorherige Ankündigung geändert werden. UBS ist nicht verpflichtet, die hierin enthaltenen Informationen zu aktualisieren oder auf dem neusten Stand zu halten. Gewisse Links führen zu Websites Dritter. Diese sind dem Einfluss der UBS vollständig entzogen, weshalb UBS für Richtigkeit, Vollständigkeit und Rechtmässigkeit des Inhalts solcher Websites sowie für darauf enthaltene Angebote und (Dienst-) Leistungen keinerlei Verantwortung übernimmt. Für gewisse Dienstleistungen und Produkte gelten gesetzliche Bestimmungen. Diese Dienstleistungen und Produkte können daher nicht weltweit uneingeschränkt angeboten werden. Hinweise zu den Grafiken: Nur für Illustrationszwecke. Vergangene Performance ist kein zuverlässiger Indikator für die künftige Performance.

Keyinvest 04.06.20182018-06-04T08:23:40+02:00
Go to Top